Abstract
Background:
Exercise-induced pulmonary hypertension (PH) is often seen in chronic thromboembolic PH (CTEPH) patients with normalized resting hemodynamics, but it is difficult to differentiate precapillary PH as pulmonary vascular dysfunction and post-capillary PH from occult-left ventricular dysfunction (LVD). The aim of this study was to examine whether the exercise-induced elevation of pulmonary arterial wedge pressure (PAWP) can be predicted by the echocardiographic index at rest.
Methods and Results:
A total of 71 CTEPH patients (67±11 years old, male/female=15/56) treated by pulmonary angioplasty with near-normal pulmonary arterial pressure (PAP) and normal PAWP at rest underwent symptom-limited exercise test using supine cycle ergometer with right heart catheterization. Exercise-induced elevation in PAWP of >20 mmHg during exercise was defined as occult-LVD. Resting echocardiography was performed within 3 months. In the occult-LVD (n=28), PAWP at rest after leg raising for exercise (14±4 vs. 11±3 mmHg, P<0.001), and mean PAP during exercise were higher compared with the non-LVD (n=43). Peak oxygen consumption, cardiac output, and pulmonary vascular resistance at peak exercise did not differ between groups. Left atrial volume index (LAVi) in the occult-LVD was significantly larger (39.7±8.1 vs. 34.4±9.6 mL/m2, P=0.017). LAVi correlated with exercise PAWP (r=0.356, P=0.002), but not resting PAWP (r=0.161, P=0.179).
Conclusions:
Larger left atrial volume may reflect the exercise-induced PAWP elevation as occult-LVD in CTEPH patients.
Recently, exercise-induced pulmonary hypertension (PH), defined as ‘mean pulmonary arterial pressure (mPAP) >30 mmHg at cardiac output (CO) 10 L/min on exercise’ has been recognized and is considered to be present as a mild degree of PH with mPAP <25 mmHg at rest.1–3
Therefore, detection of exercise-induced PH, or early pulmonary vascular dysfunction, is important in terms of early diagnosis and intervention. Exercise-induced PH includes exercise-induced precapillary PH, which is abnormal only in the pulmonary circulation, and exercise-induced post-capillary PH accompanied by a rise in pulmonary arterial wedge pressure (PAWP).
With advancements in the treatment of chronic thromboembolic PH (CTEPH), such as pulmonary endarterectomy (PEA) and percutaneous transluminal pulmonary angioplasty (PTPA, or balloon pulmonary angioplasty (BPA)), CTEPH is increasing in cases where mPAP is normalized.4–6
However, there are some successfully operated patients whose shortness of breath remains during exercise and they have reduced exercise capacity despite normalization of mPAP at rest.7–9
It is necessary to distinguish whether it is exercise-induced precapillary PH or exercise-induced post-capillary PH, which includes early heart failure with preserved ejection fraction (HFpEF).10
If it is exercise-induced precapillary PH, additional treatment is sometimes considered, and in the case of post-capillary PH, intervention for a complicated disease, such as hypertension, is considered.
In the present study, we examined whether the increase in PAWP during exercise can be predicted by echocardiographic indexes at rest in patients with CTEPH treated by PTPA and with near-normal hemodynamics at rest.
Methods
This study was approved by the Committee for Clinical Studies and Ethics of Kyorin University School of Medicine (Approval no. 490).
Study Patients
A total of 71 patients (67±11 years old; male/female=15/56) with CTEPH with near-normal PAP (<30 mmHg) at rest after treatment with PTPA were eligible for the study. The patients with higher mean PAP (>30 mmHg) were not entered. Baseline characteristics of the study group are shown in
Table 1. Even if the patients had good hemodynamic results at rest but had dyspnea on exertion and abnormal hemodynamics on exercise, they underwent an additional session of angioplasty when the flow-limiting pulmonary artery had treatable anatomy.
Table 1.
Baseline Characteristics of the Study Patients in the Resting State
| |
Total
(n=71) |
Non-LVD
(n=43) |
Occult-LVD
(n=28) |
P value |
| Age, years |
67±11 |
66±12 |
70±9 |
0.139 |
| Sex, male/female |
15/56 |
10/33 |
5/23 |
0.768 |
| BW, kg |
60.7±11.8 |
60.3±12.1 |
61.2±11.8 |
0.742 |
| Diabetes melltius, n (%) |
5 (7) |
2 (5) |
3 (11) |
0.968 |
| Hyperlipidemia, n (%) |
20 (28) |
11 (26) |
9 (32) |
0.596 |
| Hypertension, n (%) |
26 (37) |
18 (42) |
8 (29) |
0.318 |
| Diuretic therapy, n (%) |
12 (17) |
6 (14) |
6 (21) |
0.521 |
| Duration after last PTPA, months |
12 (7, 24) |
12 (8, 26) |
12 (10, 23) |
0.968 |
| BNP, pg/dL |
26.1 (15.8, 50.3) |
24.1 (11.5, 34.7) |
36.9 (21.2, 82.2) |
0.025 |
| Hb, g/dL |
12.5±1.4 |
12.6±1.5 |
12.3±1.5 |
0.406 |
| Mean RA, mmHg |
4±2 |
4±2 |
4±3 |
0.748 |
| Systolic PAP, mmHg |
33±6 |
33±6 |
33±6 |
0.908 |
| Diastolic PAP, mmHg |
9±4 |
8±4 |
9±4 |
0.628 |
| Mean PAP, mmHg |
19±4 |
19±4 |
19±4 |
0.524 |
| PAWP, mmHg |
8±3 |
8±2 |
8±3 |
0.844 |
| SaO2, % |
93.6±3.1 |
93.9±3.0 |
93.0±3.2 |
0.222 |
| SvO2, % |
70.3±4.5 |
70.6±4.1 |
69.8±5.1 |
0.438 |
| Cardiac output, L/min |
4.7±1.1 |
4.7±1.0 |
4.8±1.2 |
0.813 |
| Cardiac index, L/min/m2 |
2.9±0.6 |
2.9±0.6 |
3.0±0.7 |
0.746 |
| PVR, Wood units |
2.5±1.1 |
2.4±1.1 |
2.5±1.1 |
0.655 |
Values are reported as mean±standard deviation (SD), or median (25–75th interquartile range) where appropriate. BW, body weight; LVD, left ventricular dysfunction; Mean RA, mean right atrium pressure; PAP, pulmonary artery pressure; PAWP, Pulmonary artery wedge pressure; PTPA, percutaneous transluminal pulmonary angioplasty; PVR, pulmonary vascular resistance; SaO2, O2 saturation in arterial blood; SvO2, O2 saturation in the pulmonary artery.
Patients with PAWP elevation (>15 mmHg) at rest were excluded. The other exclusion criteria were more than mild aortic insufficiency, mild mitral regurgitation, any degree of mitral stenosis, valvular prosthesis, low left ventricular ejection fraction (LVEF), chronic dialysis patient with arteriovenous fistula, and history of atrial arrhythmia, including atrial fibrillation, atrial flutter, and other documented and/or treated atrial rhythm abnormalities.
The purposes and risks of the study were explained to the patients, and informed consent was given by each.
Right Heart Catheterization (RHC) and Cardiopulmonary Exercise Testing
RHC was performed with a 6F double-lumen, balloon-tipped, flow-directed Swan-Ganz catheter (Harmac Medical Products, Inc., USA) via a transjugular approach.
Baseline hemodynamic data were recorded; the zero reference level (mid-chest) was adjusted at the start of pressure measurement, and PAWP was obtained as the mean value of the occlusion arterial trace. Measurements were obtained at the end of a normal expiration with the patient in the supine position, in order to assess right chamber and pulmonary artery pressure (mean PAP, systolic PAP and diastolic PAP) and PAWP.11
An incremental symptom-limited exercise test was performed in the supine position, with an electromagnetically braked cycle ergometer (Nuclear Imaging Table with Angio Ergometer; Lode; Groningen, The Netherlands) according to the ramp protocol. For cycling, the legs were elevated. The test consisted of a 3-min resting period, followed by 3 min of warm-up at an ergometer setting of 10 W (60 rpm), followed by testing with a 1 W increase in exercise load every 6 s (10 W/min).
During exercise, oxygen consumption (V̇O2), carbon dioxide output (V̇CO2), and minute ventilation (V̇E) were measured with a metabolic cart (Cpex-1; Inter-Reha Co., Ltd., Tokyo, Japan). Prior to calculating the parameters from respiratory gas analysis, an 8-point moving average of the breath-by-breath data was obtained. Peak V̇O2
was defined as the average value obtained during the last 30 s of exercise. The anaerobic threshold (AT) point was determined using the
V-slope method in addition to the following conventional criteria: V̇E/V̇O2
increases after registering as flat or decreasing, whereas V̇E/V̇CO2
remains constant or decreases.12,13
The V̇E vs. V̇CO2
slope was calculated from the start of incremental exercise to the respiratory compensation point by least squares linear regression.14,15
Heart rate, arterial blood pressure directly recorded in the radial artery and ECG were monitored continuously during the test. PAP and PAWP in RHC were also measured every minute. We used averaged mean PAP and mean PAWP during several seconds rather than end-expiratory measurements during exercise.
Oxygen (O2) saturation in arterial blood (SaO2), partial pressure of arterial O2
(PaO2), partial pressure of arterial CO2
(PaCO2) in the radial artery and O2
saturation in the pulmonary artery (SvO2) were measured at rest, AT and peak exercise. CO was determined by the Fick method using the formula: CO (L/min)=V̇O2/{1.34×hemoglobin×(SaO2−SvO2)}. Cardiac index (CI) (L/min/m2) was determined by the calculation as follows: CO/body surface area (BSA). Pulmonary vascular resistance (PVR) was calculated as: PVR (Wood units)=(mean PAP−PAWP)/CO. All measurements during exercise testing were performed without supplemental O2. Patients were divided according to PAWP during exercise of >20 mmHg (occult-left ventricular dysfunction (LVD) group) or ≤20 mmHg (non-LVD group).
Echocardiography
Transthoracic Doppler echocardiography was performed and images were stored digitally on an Artida (TOSHIBA, Japan) or EPIQ (PHILIPS, USA) ultrasound system within 3 months of RHC. On echocardiography, the patient was given a unique ID number to ensure analysis of images could be performed blinded for all invasive data and patient characteristics. Frame rate was kept to a minimum rate of 60/s. For Doppler recordings the average of 3–5 consecutive beats was measured using a horizontal sweep of 75–100 cm/s.
Left ventricular (LV) dimensions and left atrial diameter (LAd) were measured from the parasternal long-axis view. The LV mass was calculated and indexed to the BSA. LVEF was calculated using Simpson’s biplane method from the apical 4- and 2-chamber views.
Left atrial (LA) maximal and minimal volumes were estimated from the apical 4- and 2-chamber views using biplane planimetry. LA maximal volume was measured from the frame just before mitral valve opening, and the LA volume index (LAVi) was indexed for BSA.
Mitral inflow was assessed in the apical 4-chamber view with the pulsed-wave Doppler sample volume placed at the tips of the mitral valve leaflets during diastole.
From pulsed-wave Doppler mode positioned at the tip of the mitral valve, early (E) and late (A) peak diastolic velocities of the mitral inflow and E wave deceleration time were measured. Mitral annular motion was assessed using pulsed-wave tissue Doppler with the sample volume placed in the septal (e’ septal) and lateral mitral annulus (e’ lateral). The E/e’ ratio was calculated.
Right ventricular (RV) systolic function was assessed by measuring the tricuspid annular plane systolic excursion (TAPSE). RV end-diastolic and end-systolic areas were assessed by manual planimetry in the apical 4-chamber view, and RV fractional area change (RVFAC) was derived using the formula RVFAC=[(RVEDarea−RVESarea)/RVEDarea]×100 (where ED=end-diastolic and ES=end-systolic).
Statistical Analysis
The data are presented as mean±SD, or median (25–75th interquartile range where appropriate, and categorical variables are expressed as numbers and percentages. The Shapiro-Wilk test was used to assess the normality of distribution of the data. All the continuous values, except for B-type natriuretic peptide (BNP), were distributed normally. The correlations between echocardiographic parameters and PAWP during exercise were assessed using Pearson’s correlation analysis. A logistic regression analysis was performed to predict over 20 mmHg of PAWP during exercise using echocardiographic parameters. Statistical comparisons were considered significant at P<0.05. All analyses were performed using the SPSS statistical package, version 11.0 (SPSS Inc., Chicago, IL, USA).
Results
Baseline RHC Data
Parameters determined through RHC were: mean PAP 19±4 mmHg, PAWP 8±3 mmHg, PVR 2.5±1.1 Wood units, and CO 4.7±1.1 mL/min, indicating that patients had near-normal PAP. Baseline characteristics of the study group classified by PAWP at peak exercise are shown in
Table 1. There were 28 patients in the occult-LVD group and 43 in the non-LVD group. There were no significant differences in baseline hemodynamic data between groups. BNP in the occult-LVD group was significantly higher than in the non-LVD group (24.1 vs. 36.9 pg/dL, P=0.025).
Exercise Data
The exercise test responses at rest, AT, and peak exercise are listed in
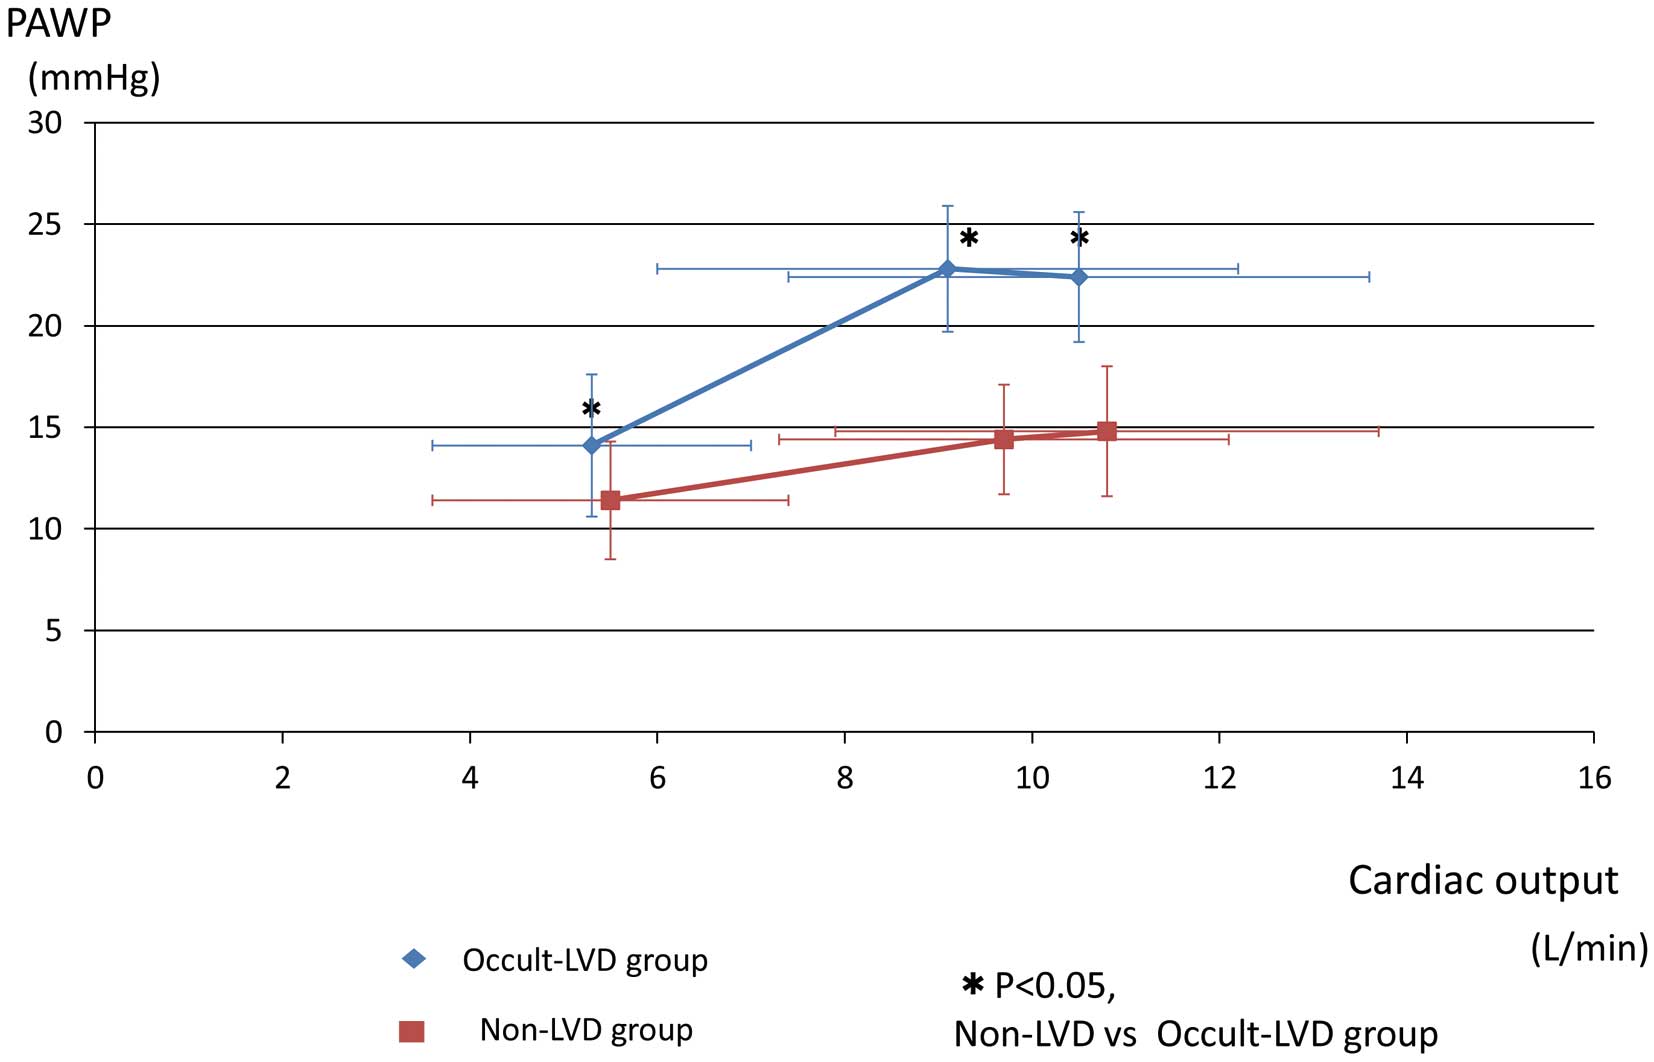
Table 2. Relationships of PAWP according to CO in each group are shown in
Figure 1.
Table 2.
Exercise Parameters
| |
Non-LVD
(n=43) |
Occult-LVD
(n=28) |
P value |
| Rest after leg-raise |
| HR, beats/min |
70±13 |
68±10 |
0.630 |
| Systolic BP, mmHg |
147±26 |
151±21 |
0.531 |
| Diastolic BP, mmHg |
74±13 |
73±13 |
0.831 |
| Mean BP, mmHg |
103±17 |
102±16 |
0.796 |
| Systolic PAP, mmHg |
40±9 |
44±8 |
0.082 |
| Diastolic PAP, mmHg |
9±4 |
13±5 |
0.001 |
| Mean PAP, mmHg |
23±5 |
26±5 |
0.024 |
| PAWP, mmHg |
11±3 |
14±4 |
<0.001 |
| ΔPAWP(pre-leg raise), mmHg |
3±3 |
6±4 |
<0.001 |
| Cardiac output, L/min |
5.5±1.9 |
5.3±1.7 |
0.724 |
| PVR, Wood units |
2.5±1.5 |
2.6±1.4 |
0.832 |
| PaO2, mmHg |
73.1±8.8 |
73.4±7.1 |
0.902 |
| PaCO2, mmHg |
40.5±6.0 |
38.6±2.9 |
0.162 |
| SaO2, % |
94.5±2.2 |
94.6±1.6 |
0.946 |
| SvO2, % |
69.3±4.8 |
68.1±5.0 |
0.315 |
| V̇O2, mL/min |
224±65 |
225±64 |
0.967 |
| V̇CO2, mL/min |
191±63 |
186±58 |
0.750 |
| R |
0.82±0.06 |
0.81±0.08 |
0.763 |
| V̇E, L/min |
8.6±2.3 |
8.4±1.7 |
0.639 |
| V̇E/V̇O2 |
39.9±7.3 |
39.3±7.1 |
0.716 |
| V̇E/V̇CO2 |
49.0±9.1 |
48.6±9.2 |
0.840 |
| Anaerobic threshold |
| Work rate, Watts |
36±16 |
35±15 |
0.893 |
| HR, beats/min |
101±16 |
98±17 |
0.571 |
| Systolic BP, mmHg |
182±31 |
186±32 |
0.693 |
| Diastolic BP, mmHg |
83±14 |
82±14 |
0.912 |
| Mean BP, mmHg |
120±16 |
118±16 |
0.582 |
| Systolic PAP, mmHg |
61±12 |
68±11 |
0.025 |
| Diastolic PAP, mmHg |
15±6 |
20±6 |
0.002 |
| Mean PAP, mmHg |
37±7 |
43±7 |
<0.001 |
| PAWP, mmHg |
14.4±2.7 |
22.8±3.1 |
<0.001 |
| Cardiac output, L/min |
9.7±2.4 |
9.1±3.1 |
0.387 |
| PVR, Wood units |
2.5±1.4 |
2.5±1.3 |
0.972 |
| PaO2, mmHg |
70.6±8.8 |
68.2±8.5 |
0.347 |
| PaCO2, mmHg |
39.4±2.8 |
38.5±3.3 |
0.295 |
| SaO2, % |
93.5±3.0 |
92.6±2.7 |
0.194 |
| SvO2, % |
51.9±6.3 |
48.0±7.1 |
0.019 |
| V̇O2, mL/min |
675±208 |
649±182 |
0.598 |
| V̇CO2, mL/min |
631±220 |
631±186 |
0.670 |
| R |
0.94±0.08 |
0.96±0.09 |
0.487 |
| V̇E, L/min |
24.7±6.5 |
24.2±6.6 |
0.744 |
| V̇E/V̇O2 |
38.3±7.5 |
39.3±8.0 |
0.607 |
| V̇E/V̇CO2 |
41.6±9.0 |
42.1±8.1 |
0.812 |
| Peak |
| Work rate, Watts |
69±23 |
65±24 |
0.501 |
| HR, beats/min |
117±17 |
113±17 |
0.290 |
| Systolic BP, mmHg |
195±30 |
196±39 |
0.920 |
| Diastolic BP, mmHg |
85±16 |
81±15 |
0.422 |
| Mean BP, mmHg |
123±20 |
123±21 |
0.996 |
| Systolic PAP, mmHg |
65±12 |
73±13 |
0.011 |
| Diastolic PAP, mmHg |
16±6 |
21±6 |
<0.001 |
| Mean PAP, mmHg |
39±7 |
46±7 |
<0.001 |
| PAWP, mmHg |
14.8±3.2 |
22.4±3.2 |
<0.001 |
| Cardiac output, L/min |
10.8±2.9 |
10.5±3.1 |
0.663 |
| PVR, Wood units |
2.5±1.2 |
2.6±1.3 |
0.743 |
| PaO2, mmHg |
67.8±8.2 |
67.6±8.6 |
0.932 |
| PaCO2, mmHg |
38.7±3.2 |
38.5±3.3 |
0.802 |
| SaO2, % |
92.9±3.0 |
92.2±2.3 |
0.275 |
| SvO2, % |
44.4±6.6 |
42.4±6.1 |
0.197 |
| V̇O2, mL/min |
881±292 |
855±276 |
0.713 |
| V̇CO2, mL/min |
919±343 |
897±292 |
0.780 |
| R |
1.04±0.10 |
1.05±0.11 |
0.471 |
| V̇E, L/min |
37.8±12.3 |
37.8±10.2 |
0.990 |
| V̇E/V̇O2 |
44.3±8.7 |
46.3±7.1 |
0.327 |
| V̇E/V̇CO2 |
43.0±8.5 |
44.2±7.6 |
0.563 |
| Peak V̇O2, mL/kg/min |
14.6±4.2 |
13.9±3.6 |
0.463 |
| V̇E vs.V̇CO2 slope |
39.4±9.4 |
40.4±10.0 |
0.685 |
Values are reported as mean±SD. BP, blood pressure; HR, heart rate; PaCO2, partial pressure of arterial CO2; R, respiratory exchange ratio; V̇CO2, carbon dioxide output; V̇E, minute ventilation; V̇O2, oxygen consumption. Other abbreviations as in Table 1.
Peak V̇O2
averaged 14.3±3.9 mL/min/kg, with a respiratory quotient of 1.04±0.10, consistent with near-maximal effort. The V̇E vs. V̇CO2
slope was 39.8±9.5. Peak V̇O2, CO, the V̇E vs. V̇CO2
slope and PVR at peak exercise did not differ between groups.
In the occult-LVD group, PAWP after legs raised approximately 30 degrees for cycle ergometer exercise was significantly higher (14±4 vs. 11±3 mmHg, P<0.001) than in the non-LVD group, despite no significant difference in PAWP at baseline before leg raising. Mean PAP during exercise (AT: 43±7 vs. 37±7 mmHg, P<0.001, peak: 46±7 vs. 39±7 mmHg, P<0.001) was higher, compared with the non-LVD group.
Echocardiographic Data
Echocardiographic parameters between groups are shown in
Table 3. LAd and LAVi in the occult-LVD group were significantly larger than in the non-LVD group (LAd: 38.2±8.2 vs. 34.8±4.7 mm, P=0.031, LAVi: 39.7±8.1 vs. 34.4±9.6 mL/m2, P=0.017) (Figure 2). LVEF in both groups was not different and within normal limits, suggesting that LVD was caused by LV diastolic dysfunction.
Table 3.
Echocardiographic Parameters
| |
Non-LVD
(n=43) |
Occult-LVD
(n=28) |
P value |
| LVEF, % |
67.5±4.8 |
66.9±5.7 |
0.593 |
| LV mass index, g/m2 |
95±17 |
92±15 |
0.504 |
| LAd, mm |
34.8±4.7 |
38.2±8.2 |
0.031 |
| LAVi, mL/m2 |
34.4±9.6 |
39.7±8.1 |
0.017 |
| E, cm/s |
72.6±17.4 |
73.3±22.1 |
0.871 |
| A, cm/s |
86.4±18.6 |
82.1±19.0 |
0.347 |
| E/A |
0.88±0.29 |
0.94±0.37 |
0.434 |
| DcT, cm/s |
209±53 |
203±48 |
0.589 |
| E’ septal, cm/s |
6.8±2.3 |
6.2±1.7 |
0.226 |
| E/e’ septal, cm/s |
11.6±3.4 |
12.1±2.6 |
0.512 |
| E’ lateral, cm/s |
8.9±2.7 |
9.1±2.6 |
0.754 |
| E/e’ lateral, cm/s |
8.7±2.9 |
8.5±2.6 |
0.708 |
| TAPSE, mm |
22.6±5.2 |
21.8±4.9 |
0.515 |
| RV FAC, % |
40.5±5.9 |
40.5±6.1 |
0.969 |
Values are reported as mean±standard deviation (SD). DcT, deceleration time; LAd, left atrial diameter; LAVi, left atrial volume index; LVD, left ventricular dysfunction; LVEF, left ventricular ejection fraction; LV mass index, left ventricular mass index; RV FAC, right ventricular fractional area change; TAPSE, tricuspid annular plane systolic excursion.
The correlations between echocardiographic parameters and PAWP at peak exercise are shown in
Table 4. Only LAVi had a significantly positive correlation with PAWP at peak exercise. Correlations between PAWP at each stage and LAVi are shown in
Figure 3. PAWP during exercise had a positive correlation with LAVi (AT:r=0.356, P=0.002, peak: r=0.340, P=0.004), but PAWP at rest did not (rest: r=0.161, P=0.179, leg raise: r=0.184, P=0.125). Using univariate logistic regression analysis, LAVi and LAd were significant predictors of PAWP >20 mmHg during exercise (Table 5). However, using multivariate logistic regression analysis, nothing was left as a significant predictor.
Table 4.
Correlation With PAWP at Peak Exercise
| |
r |
P value |
| LVEF, % |
−0.080 |
0.507 |
| LV mass index, g/m2 |
−0.043 |
0.725 |
| LAd, mm |
0.204 |
0.087 |
| LAVi, mL/m2 |
0.340 |
0.004 |
| E, cm/s |
0.033 |
0.784 |
| A, cm/s |
−0.121 |
0.316 |
| E/A |
0.104 |
0.387 |
| DcT, cm/s |
−0.161 |
0.183 |
| E’ septal, cm/s |
−0.092 |
0.448 |
| E/e’ septal, cm/s |
0.081 |
0.504 |
| E’ lateral, cm/s |
0.107 |
0.375 |
| E/e’ lateral, cm/s |
−0.063 |
0.599 |
| TAPSE, mm |
0.001 |
0.992 |
| RV FAC, % |
0.116 |
0.344 |
Abbreviations as in Table 3.
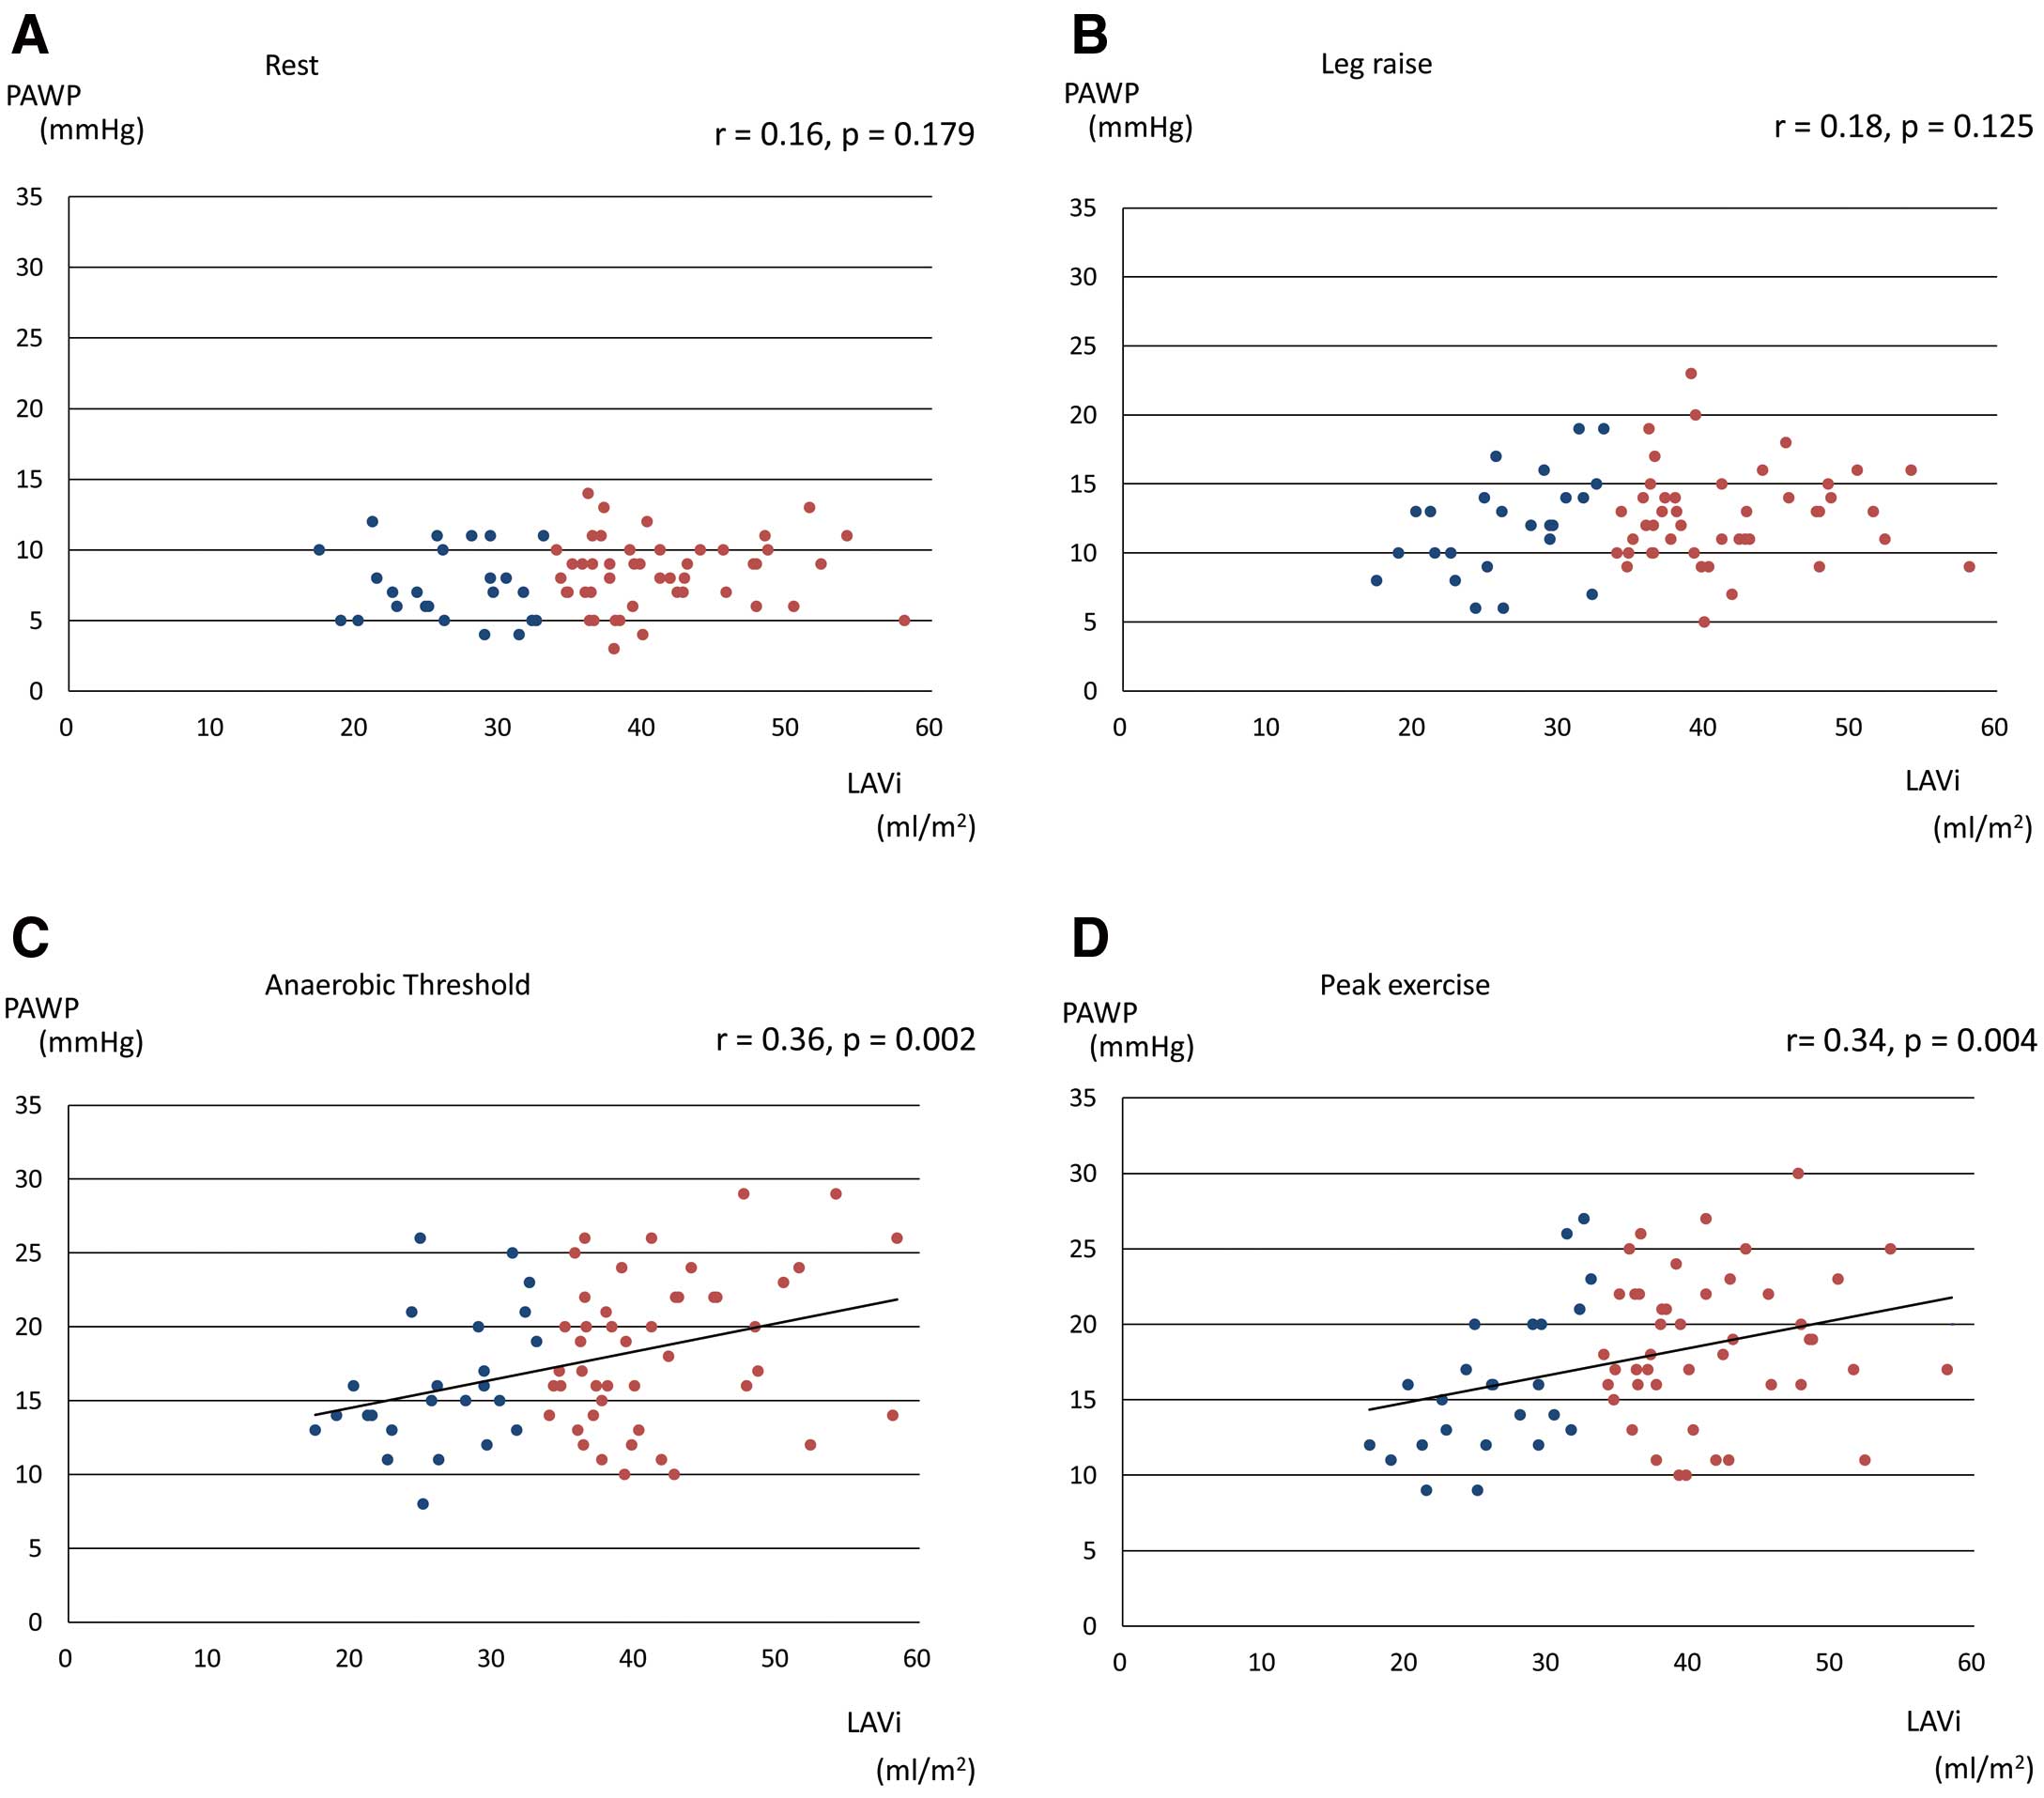
Table 5.
Univariate and Multivariate Logistic Analyses Using >20 mmHg of PAWP During Exercise
| |
Univariate |
Multivariate |
| OR |
95% confidence
interval |
P value |
OR |
95% confidence
interval |
P value |
| LVEF, % |
0.98 |
0.88–1.07 |
0.587 |
|
|
|
| LV mass index, g/m2 |
0.99 |
0.96–1.02 |
0.520 |
|
|
|
| LAd, mm |
1.10 |
1.00–1.21 |
0.047 |
1.07 |
0.97–1.17 |
0.173 |
| LAVi, mL/m2 |
1.07 |
1.01–1.13 |
0.022 |
1.05 |
0.99–1.12 |
0.090 |
| E, cm/s |
1.00 |
0.98–1.03 |
0.869 |
|
|
|
| A, cm/s |
0.99 |
0.96–1.01 |
0.342 |
|
|
|
| E/A |
1.82 |
0.41–8.04 |
0.430 |
|
|
|
| DcT, cm/s |
1.00 |
0.99–1.01 |
0.583 |
|
|
|
| E’ septal, cm/s |
0.86 |
0.67–1.10 |
0.226 |
|
|
|
| E/e’ septal, cm/s |
1.05 |
0.90–1.23 |
0.506 |
|
|
|
| E’ lateral, cm/s |
1.03 |
0.86–1.23 |
0.754 |
|
|
|
| E/e’ lateral, cm/s |
0.97 |
0.81–1.15 |
0.703 |
|
|
|
| TAPSE, mm |
0.97 |
0.87–1.07 |
0.511 |
|
|
|
| RV FAC, % |
1.00 |
0.92–1.09 |
0.969 |
|
|
|
OR, odds ratio. Other abbreviations as in Table 3.
Discussion
Our study is the first to show that larger LA volume suggests the possibility of post-capillary exercise PH in CTEPH patients with normalized PAP at rest but PH during exercise.
Cause of Residual Shortness of Breath After CTEPH Treatment
PTPA and PEA provide a potential cure for patients with CTEPH.4,6
However, some successfully operated patients continue to suffer from a limitation of exercise capacity, despite normalization of pulmonary artery pressure and PVR. Bonderman et al reported that, after successful PEA, patients with persistent exertional dyspnea display an abnormal pulmonary hemodynamic response to exercise, characterized by increased PVR and decreased pulmonary compliance.7
One factor of exercise intolerance with CTEPH patients after PEA can be explained by exercise-induced precapillary PH.
On the other hand, exercise-induced PAWP elevation is also considered to be one of the causes of residual shortness of breath in CTEPH patients. In early-stage HFpEF, the elevation in PAWP, that is, elevation in LV filling pressure, is not present at rest but is seen during exercise.10
Dorfs et al reported that an excessive rise of PAWP during exercise despite normal PAWP at rest was associated with increased mortality and might be considered as early HFpEF.16
Invasive hemodynamic assessment during provocative maneuvers, such as exercise and volume challenge, allows for greater sensitivity to positively diagnose or exclude HFpEF.17–19
Unlike with other types of PH, CTEPH patients are considered to show PAWP elevation during exercise; that is, occult LV diastolic dysfunction because they have the usual HFpEF risk factors of hypertension and older age.
Exercise Stress Testing With RHC
Cardiopulmonary exercise testing (CPX) with RHC (invasive CPX) attracts a great deal of interest in the area of pulmonary vascular disease in patients with pulmonary arterial hypertension (PAH) and HFpEF.2,20–23
Exercise-induced PH represents the hemodynamic appearance of early pulmonary vascular disease, left heart disease, lung disease and a combination of these conditions. Exercise-induced PAP, PAWP, PVR elevation, and the pulmonary artery pressure–flow relationships can be evaluated by invasive CPX.24–26
Early detection of pulmonary vascular dysfunction in PAH patients is an important strategic objective against this terrible disease whose mortality remains high despite current medical progress. In general, it is not until more than 60% of the pulmonary circulation is obstructed (effective pulmonary flow <40%) that a rise in resting PAP is detected. Exercise-induced PH screened by echocardiography can detect early PH in patients with connective tissue disease.27
In PAH and CTEPH patients, the pressure–flow relationship during exercise predicts survival and correlates with established markers of disease severity and outcome.28
The future paradigm of early disease detection in high-risk patients should ideally be aimed at detecting disease before a rise in resting PAP.
LA Dilatation in Cardiovascular Disease
The LA modulates LV filling and cardiac performance through its roles as a reservoir, conduit, and booster pump. During diastole, the LA is directly exposed to pressures in the LV. With increased stiffness or non-compliance of the LV, the LA pressure rises to maintain adequate LV filling. With diastolic dysfunction, the LA will be exposed to increased filling pressure during diastole, causing increased atrial wall tension, stretching of the atrial myocardium, and eventually chamber dilation. Thus, previous data have suggested that LA volume is considered to reflect the duration and severity of increased LA pressure, choric E/e’ rise, and sustained diastolic failure.29
LA dilatation and functional remodeling are frequently seen in patients with LV pressure overload, such as hypertension and HFpEF patients.30–33
The dilated LA is primarily seen as a prognostic marker for disease progression, and indeed the prognostic relevance of LA dilatation is well established.34–37
The relevance of LA volume and function in overall cardiovascular health is being increasingly recognized. LA volume is now understood to be a noninvasive “biomarker” that can predict cardiovascular risk and prognosis in a wide range of cardiovascular diseases. LA functional remodeling has been proposed as an independent prognostic marker also in HFpEF patients.38
Exercise Hemodynamics and LA Volume
On the other hand, various studies have assessed whether the elevation in PAWP during exercise is reflected in the LA volume using echocardiography and cardiac magnetic resonance imaging. During exercise, CO has to increase despite a reduction in filling time because of the higher heart rate. Thus it seems logical that an increase in reservoir function plays an important role in accelerating LV filling by helping to maintain an enhanced atrioventricular pressure gradient. The LA, a compliant chamber with thin walls, has a tendency to dilate in response to intermittent and chronic elevations in LV filling pressures.
Christensen et al reported that LA size and resting E/e’ were related to PAWP rise during exercise in asymptomatic aortic stenosis, and it is concluded that LA size reflects hemodynamic burden during exercise.39
In HFpEF patients, LA volume seems to be helpful for predicting abnormal exercise LV filling pressure, estimated by exercise E/e’ over 13.40
LVAi >33 mL/m2
can predict abnormal higher LV filling pressure with high sensitivity and specificity. LAVi reflects the elevation in LV filling pressure during exercise and is considered to be the same result as our CTEPH study.
In a recent report, an impaired LA strain response was related with RV-to-pulmonary circulation uncoupling and exercise ventilation inefficiency in HFpEF patients.41
Also in the CTEPH population, Schnell et al reported that inadequate diastolic filling together with increased PAWP may explain the dysfunctional response of the LA during exercise.42
Ritcher et al reported that PAWP increased from 10 to 19 mmHg during exercise after PEA, which can be interpreted both as a physiological response to the increased CO but partially also as a response unmasking previously unknown LV diastolic dysfunction.9
CTEPH occurs in the relatively elderly patient, and it is considered that there will be some patients with occult LV diastolic dysfunction. Considering the study of HFpEF, the presence of exercise-induced PAWP increase may affect recovery of RV function.43
There were no significantly differences in TAPSE and RVFAC on 2D echocardiography in our study population. However, future research is needed.
Study Limitations
Our study population did not include patients with high mean PAP at rest or who had completely normal pulmonary vascular function. The interval between echocardiography and RHC was slightly apart in some patients.
Conclusions
Larger LA volume in CTEPH patients may reflect exercise-induced PAWP elevation. Exercise-induced PH in CTEPH patients with a larger LA might be exercise-induced post-capillary PH. Further study is warranted to examine whether exercise-induced PAWP elevation is associated with LA enlargement even in other cardiovascular diseases.
Author Contributions
Dr. Goda designed this study, and participated in data analysis, and writing of the manuscript. Dr. Satoh, Dr. Finger, Dr. Sakata and Dr. Soejima reviewed the data, and edited the paper. Dr. Takeuchi, Dr. Kikuchi, and Dr. Inami performed the exercise tests and PTPA.
Financial / Nonfinancial Disclosure
The authors report no potential conflicts of interest exist with any company or organization whose products or services are discussed in this article.
References
- 1.
Naeije R, Vanderpool R, Dhakal BP, Saggar R, Vachiery JL, Lewis GD. Exercise-induced pulmonary hypertension: Physiological basis and methodological concerns. Am J Respir Crit Care Med 2013; 187: 576–583.
- 2.
Kovacs G, Herve P, Barbera JA, Chaouat A, Chemla D, Condliffe R, et al. An official European Respiratory Society statement: Pulmonary haemodynamics during exercise. Eur Respir J 2017; 50: pii: 1700578.
- 3.
Simonneau G, Montani D, Celermajer DS, Denton CP, Gatzoulis MA, Krowka M, et al. Haemodynamic definitions and updated clinical classification of pulmonary hypertension. Eur Respir J 2019; 53: pii: 1801913.
- 4.
Inami T, Kataoka M, Yanagisawa R, Ishiguro H, Shimura N, Fukuda K, et al. Long-term outcomes after percutaneous transluminal pulmonary angioplasty for chronic thromboembolic pulmonary hypertension. Circulation 2016; 134: 2030–2032.
- 5.
Kataoka M, Inami T, Hayashida K, Shimura N, Ishiguro H, Abe T, et al. Percutaneous transluminal pulmonary angioplasty for the treatment of chronic thromboembolic pulmonary hypertension. Circ Cardiovasc Interv 2012; 5: 756–762.
- 6.
Mahmud E, Madani MM, Kim NH, Poch D, Ang L, Behnamfar O, et al. Chronic thromboembolic pulmonary hypertension: Evolving therapeutic approaches for operable and inoperable disease. J Am Coll Cardiol 2018; 71: 2468–2486.
- 7.
Bonderman D, Martischnig AM, Vonbank K, Nikfardjam M, Meyer B, Heinz G, et al. Right ventricular load at exercise is a cause of persistent exercise limitation in patients with normal resting pulmonary vascular resistance after pulmonary endarterectomy. Chest 2011; 139: 122–127.
- 8.
Claessen G, La Gerche A, Dymarkowski S, Claus P, Delcroix M, Heidbuchel H. Pulmonary vascular and right ventricular reserve in patients with normalized resting hemodynamics after pulmonary endarterectomy. J Am Heart Assoc 2015; 4: e001602.
- 9.
Richter MJ, Sommer N, Gall H, Voswinckel R, Seeger W, Mayer E, et al. Pulmonary hemodynamic response to exercise in chronic thromboembolic pulmonary hypertension before and after pulmonary endarterectomy. Respiration 2015; 90: 63–73.
- 10.
Borlaug BA, Nishimura RA, Sorajja P, Lam CS, Redfield MM. Exercise hemodynamics enhance diagnosis of early heart failure with preserved ejection fraction. Circ Heart Fail 2010; 3: 588–595.
- 11.
Hoeper MM, Bogaard HJ, Condliffe R, Frantz R, Khanna D, Kurzyna M, et al. Definitions and diagnosis of pulmonary hypertension. J Am Coll Cardiol 2013; 62(Suppl): D42–D50.
- 12.
Beaver WL, Wasserman K, Whipp BJ. A new method for detecting anaerobic threshold by gas exchange. J Appl Physiol (1985) 1986; 60: 2020–2027.
- 13.
Sue DY, Wasserman K, Moricca RB, Casaburi R. Metabolic acidosis during exercise in patients with chronic obstructive pulmonary disease: Use of the V-slope method for anaerobic threshold determination. Chest 1988; 94: 931–938.
- 14.
Chua TP, Ponikowski P, Harrington D, Anker SD, Webb-Peploe K, Clark AL, et al. Clinical correlates and prognostic significance of the ventilatory response to exercise in chronic heart failure. J Am Coll Cardiol 1997; 29: 1585–1590.
- 15.
Koike A, Itoh H, Kato M, Sawada H, Aizawa T, Fu LT, et al. Prognostic power of ventilatory responses during submaximal exercise in patients with chronic heart disease. Chest 2002; 121: 1581–1588.
- 16.
Dorfs S, Zeh W, Hochholzer W, Jander N, Kienzle RP, Pieske B, et al. Pulmonary capillary wedge pressure during exercise and long-term mortality in patients with suspected heart failure with preserved ejection fraction. Eur Heart J 2014; 35: 3103–3112.
- 17.
Andersen MJ, Ersboll M, Bro-Jeppesen J, Gustafsson F, Hassager C, Kober L, et al. Exercise hemodynamics in patients with and without diastolic dysfunction and preserved ejection fraction after myocardial infarction. Circ Heart Fail 2012; 5: 444–451.
- 18.
Robbins IM, Hemnes AR, Pugh ME, Brittain EL, Zhao DX, Piana RN, et al. High prevalence of occult pulmonary venous hypertension revealed by fluid challenge in pulmonary hypertension. Circ Heart Fail 2014; 7: 116–122.
- 19.
Andersen MJ, Olson TP, Melenovsky V, Kane GC, Borlaug BA. Differential hemodynamic effects of exercise and volume expansion in people with and without heart failure. Circ Heart Fail 2015; 8: 41–48.
- 20.
Andersen MJ, Borlaug BA. Invasive hemodynamic characterization of heart failure with preserved ejection fraction. Heart Fail Clin 2014; 10: 435–444.
- 21.
Oldham WM, Lewis GD, Opotowsky AR, Waxman AB, Systrom DM. Unexplained exertional dyspnea caused by low ventricular filling pressures: Results from clinical invasive cardiopulmonary exercise testing. Pulm Circ 2016; 6: 55–62.
- 22.
Obokata M, Kane GC, Reddy YN, Olson TP, Melenovsky V, Borlaug BA. Role of diastolic stress testing in the evaluation for heart failure with preserved ejection fraction: A simultaneous invasive-echocardiographic study. Circulation 2016; 135: 825–838.
- 23.
Maor E, Grossman Y, Balmor RG, Segel M, Fefer P, Ben-Zekry S, et al. Exercise haemodynamics may unmask the diagnosis of diastolic dysfunction among patients with pulmonary hypertension. Eur J Heart Fail 2015; 17: 151–158.
- 24.
Lewis GD, Murphy RM, Shah RV, Pappagianopoulos PP, Malhotra R, Bloch KD, et al. Pulmonary vascular response patterns during exercise in left ventricular systolic dysfunction predict exercise capacity and outcomes. Circ Heart Fail 2011; 4: 276–285.
- 25.
Lewis GD, Bossone E, Naeije R, Grunig E, Saggar R, Lancellotti P, et al. Pulmonary vascular hemodynamic response to exercise in cardiopulmonary diseases. Circulation 2013; 128: 1470–1479.
- 26.
Biering-Sorensen T, Santos M, Rivero J, McCullough SD, West E, Opotowsky AR, et al. Left ventricular deformation at rest predicts exercise-induced elevation in pulmonary artery wedge pressure in patients with unexplained dyspnoea. Eur J Heart Fail 2017; 19: 101–110.
- 27.
Kusunose K, Yamada H, Hotchi J, Bando M, Nishio S, Hirata Y, et al. Prediction of future overt pulmonary hypertension by 6-min walk stress echocardiography in patients with connective tissue disease. J Am Coll Cardiol 2015; 66: 376–384.
- 28.
Hasler ED, Muller-Mottet S, Furian M, Saxer S, Huber LC, Maggiorini M, et al. Pressure-flow during exercise catheterization predicts survival in pulmonary hypertension. Chest 2016; 150: 57–67.
- 29.
Melenovsky V, Hwang SJ, Redfield MM, Zakeri R, Lin G, Borlaug BA. Left atrial remodeling and function in advanced heart failure with preserved or reduced ejection fraction. Circ Heart Fail 2015; 8: 295–303.
- 30.
Kurt M, Wang J, Torre-Amione G, Nagueh SF. Left atrial function in diastolic heart failure. Circ Cardiovasc Imaging 2009; 2: 10–15.
- 31.
Santos AB, Kraigher-Krainer E, Gupta DK, Claggett B, Zile MR, Pieske B, et al. Impaired left atrial function in heart failure with preserved ejection fraction. Eur J Heart Fail 2014; 16: 1096–1103.
- 32.
Lam CS, Rienstra M, Tay WT, Liu LC, Hummel YM, van der Meer P, et al. Atrial fibrillation in heart failure with preserved ejection fraction: Association with exercise capacity, left ventricular filling pressures, natriuretic peptides, and left atrial volume. JACC Heart Fail 2017; 5: 92–98.
- 33.
Sanchis L, Gabrielli L, Andrea R, Falces C, Duchateau N, Perez-Villa F, et al. Left atrial dysfunction relates to symptom onset in patients with heart failure and preserved left ventricular ejection fraction. Eur Heart J Cardiovasc Imaging 2015; 16: 62–67.
- 34.
Moller JE, Hillis GS, Oh JK, Seward JB, Reeder GS, Wright RS, et al. Left atrial volume: A powerful predictor of survival after acute myocardial infarction. Circulation 2003; 107: 2207–2212.
- 35.
Beinart R, Boyko V, Schwammenthal E, Kuperstein R, Sagie A, Hod H, et al. Long-term prognostic significance of left atrial volume in acute myocardial infarction. J Am Coll Cardiol 2004; 44: 327–334.
- 36.
Hoit BD. Left atrial size and function: Role in prognosis. J Am Coll Cardiol 2014; 63: 493–505.
- 37.
Poulsen MK, Dahl JS, Henriksen JE, Hey TM, Hoilund-Carlsen PF, Beck-Nielsen H, et al. Left atrial volume index: Relation to long-term clinical outcome in type 2 diabetes. J Am Coll Cardiol 2013; 62: 2416–2421.
- 38.
Welles CC, Ku IA, Kwan DM, Whooley MA, Schiller NB, Turakhia MP. Left atrial function predicts heart failure hospitalization in subjects with preserved ejection fraction and coronary heart disease: Longitudinal data from the Heart and Soul Study. J Am Coll Cardiol 2012; 59: 673–680.
- 39.
Christensen NL, Dahl JS, Carter-Storch R, Bakkestrom R, Jensen K, Steffensen FH, et al. Association between left atrial dilatation and invasive hemodynamics at rest and during exercise in asymptomatic aortic stenosis. Circ Cardiovasc Imaging 2016; 9: pii: e005156.
- 40.
Hammoudi N, Achkar M, Laveau F, Boubrit L, Djebbar M, Allali Y, et al. Left atrial volume predicts abnormal exercise left ventricular filling pressure. Eur J Heart Fail 2014; 16: 1089–1095.
- 41.
Sugimoto T, Bandera F, Generati G, Alfonzetti E, Bussadori C, Guazzi M. Left atrial function dynamics during exercise in heart failure: Pathophysiological implications on the right heart and exercise ventilation inefficiency. JACC Cardiovasc Imaging 2016; 10: 1253–1264.
- 42.
Schnell F, Claessen G, La Gerche A, Claus P, Bogaert J, Delcroix M, et al. Atrial volume and function during exercise in health and disease. J Cardiovasc Magn Reson 2017; 19: 104.
- 43.
Gorter TM, Obokata M, Reddy YNV, Melenovsky V, Borlaug BA. Exercise unmasks distinct pathophysiologic features in heart failure with preserved ejection fraction and pulmonary vascular disease. Eur Heart J 2018; 39: 2825–2835.

