Abstract
Background:
An unconventional risk factor, “dysfunction of hemodialysis vascular access”, was demonstrated to be associated with subsequent major adverse cardiovascular events (MACE) in our previous study. However, applying this suggestion in a clinical scenario may be not intuitive. A group-based trajectory model was applied to further recognize those patients with the highest risks for MACE.
Methods and Results:
In a cohort of patients who received hemodialysis from 2001 to 2010, we identified 9,711 cases that developed MACE in the stage of stable maintenance dialysis, and 19,422 randomly selected controls matched to cases on age, gender and duration of dialysis. Events of vascular access dysfunction in the 6-month period before MACE for cases and index dates for controls were evaluated. By group-based trajectory modeling, patients according to their counts of vascular access dysfunction in each month over the 6-month period prior to MACE or index dates were categorized. There were 26,744 patients in group 1 (no dysfunction), 650 in group 2 (escalating dysfunction) and 1,739 in group 3 (persistent dysfunction). Logistic regression analysis indicated that patients in group 3 had the highest chance of subsequent MACE (odds ratio 2.47, in comparison with group 1) after controlling for all the available potential confounders.
Conclusions:
Uninterrupted clusters of vascular access dysfunction are associated with a higher risk of subsequent MACE.
Cardiovascular disease is the most common cause of death in end-stage renal disease (ESRD) patients, probably because hemodialysis patients have higher rates of cardiovascular morbidities than the general population.1
The prevalence of coronary artery disease, congestive heart failure, cerebrovascular disease or peripheral vascular disease in hemodialysis patients ranged from 20–30% in Japan and Europe to approximately 50% in the United States.2,3
Traditional cardiovascular risk factors (i.e., diabetes, hypertension, dyslipidemia), as well as non-traditional risk factors (i.e., inflammation, ESRD itself, dialysis duration, disturbed calcium-phosphate metabolism, vascular/valvular calcification) are commonly seen in the hemodialysis population.4–7
In our prior study based on population data, an unconventional risk factor, “dysfunction of hemodialysis vascular access”, was demonstrated to be associated with subsequent major adverse cardiovascular events (MACE).8
This novel cardiovascular risk factor to explain cardiovascular events and mortality in hemodialysis patients was also supported by another hospital-based study.9
It was our suggestion that patients with recurrent vascular access dysfunction should be actively monitored and treated to reduce the risk of subsequent MACE. However, applying this suggestion in a clinical scenario may be not intuitive because vascular access dysfunction can occur in nearly 50% of patients within the median follow-up time of 1 year after the vascular access creation, and false alarms for MACE may frequently occur.10
Therefore, the present study aimed to use a group-based trajectory model for categorization of hemodialysis patients with similar occurrences of vascular access dysfunction presented in a time sequence. The purpose of such analysis is to provide clinicians a way to characterize the groups of hemodialysis patients with high risks for MACE.
Methods
Details of data sources, patient selection, and definitions of variables and outcomes can be referred to in our prior publication.8
A brief overview of the methods and a comprehensive group-based trajectory modeling is described below.
Data Source
This study is an additional analysis of our prior research. Our data were from the National Health Insurance Research Database (NHIRD) of Taiwan, a longitudinal health insurance database that includes claim data for all of the health beneficiaries in Taiwan. The NHIRD created a profile of the ESRD population consisting of the medical claim data of all dialysis patients, including the inpatient/outpatient diagnosis, coded in the format of the International Classification of Disease, Ninth Revision, Clinical Modification (ICD-9-CM), and treatment claims. This study was approved by the Institutional Review Board (IRB) of the National Cheng Kung University Hospital (A-ER-102-222). The personal identification number for each patient in the NHIRD was encrypted for confidentiality; therefore, the IRB waived written informed consent from the enrolled patients.
Study Cohort
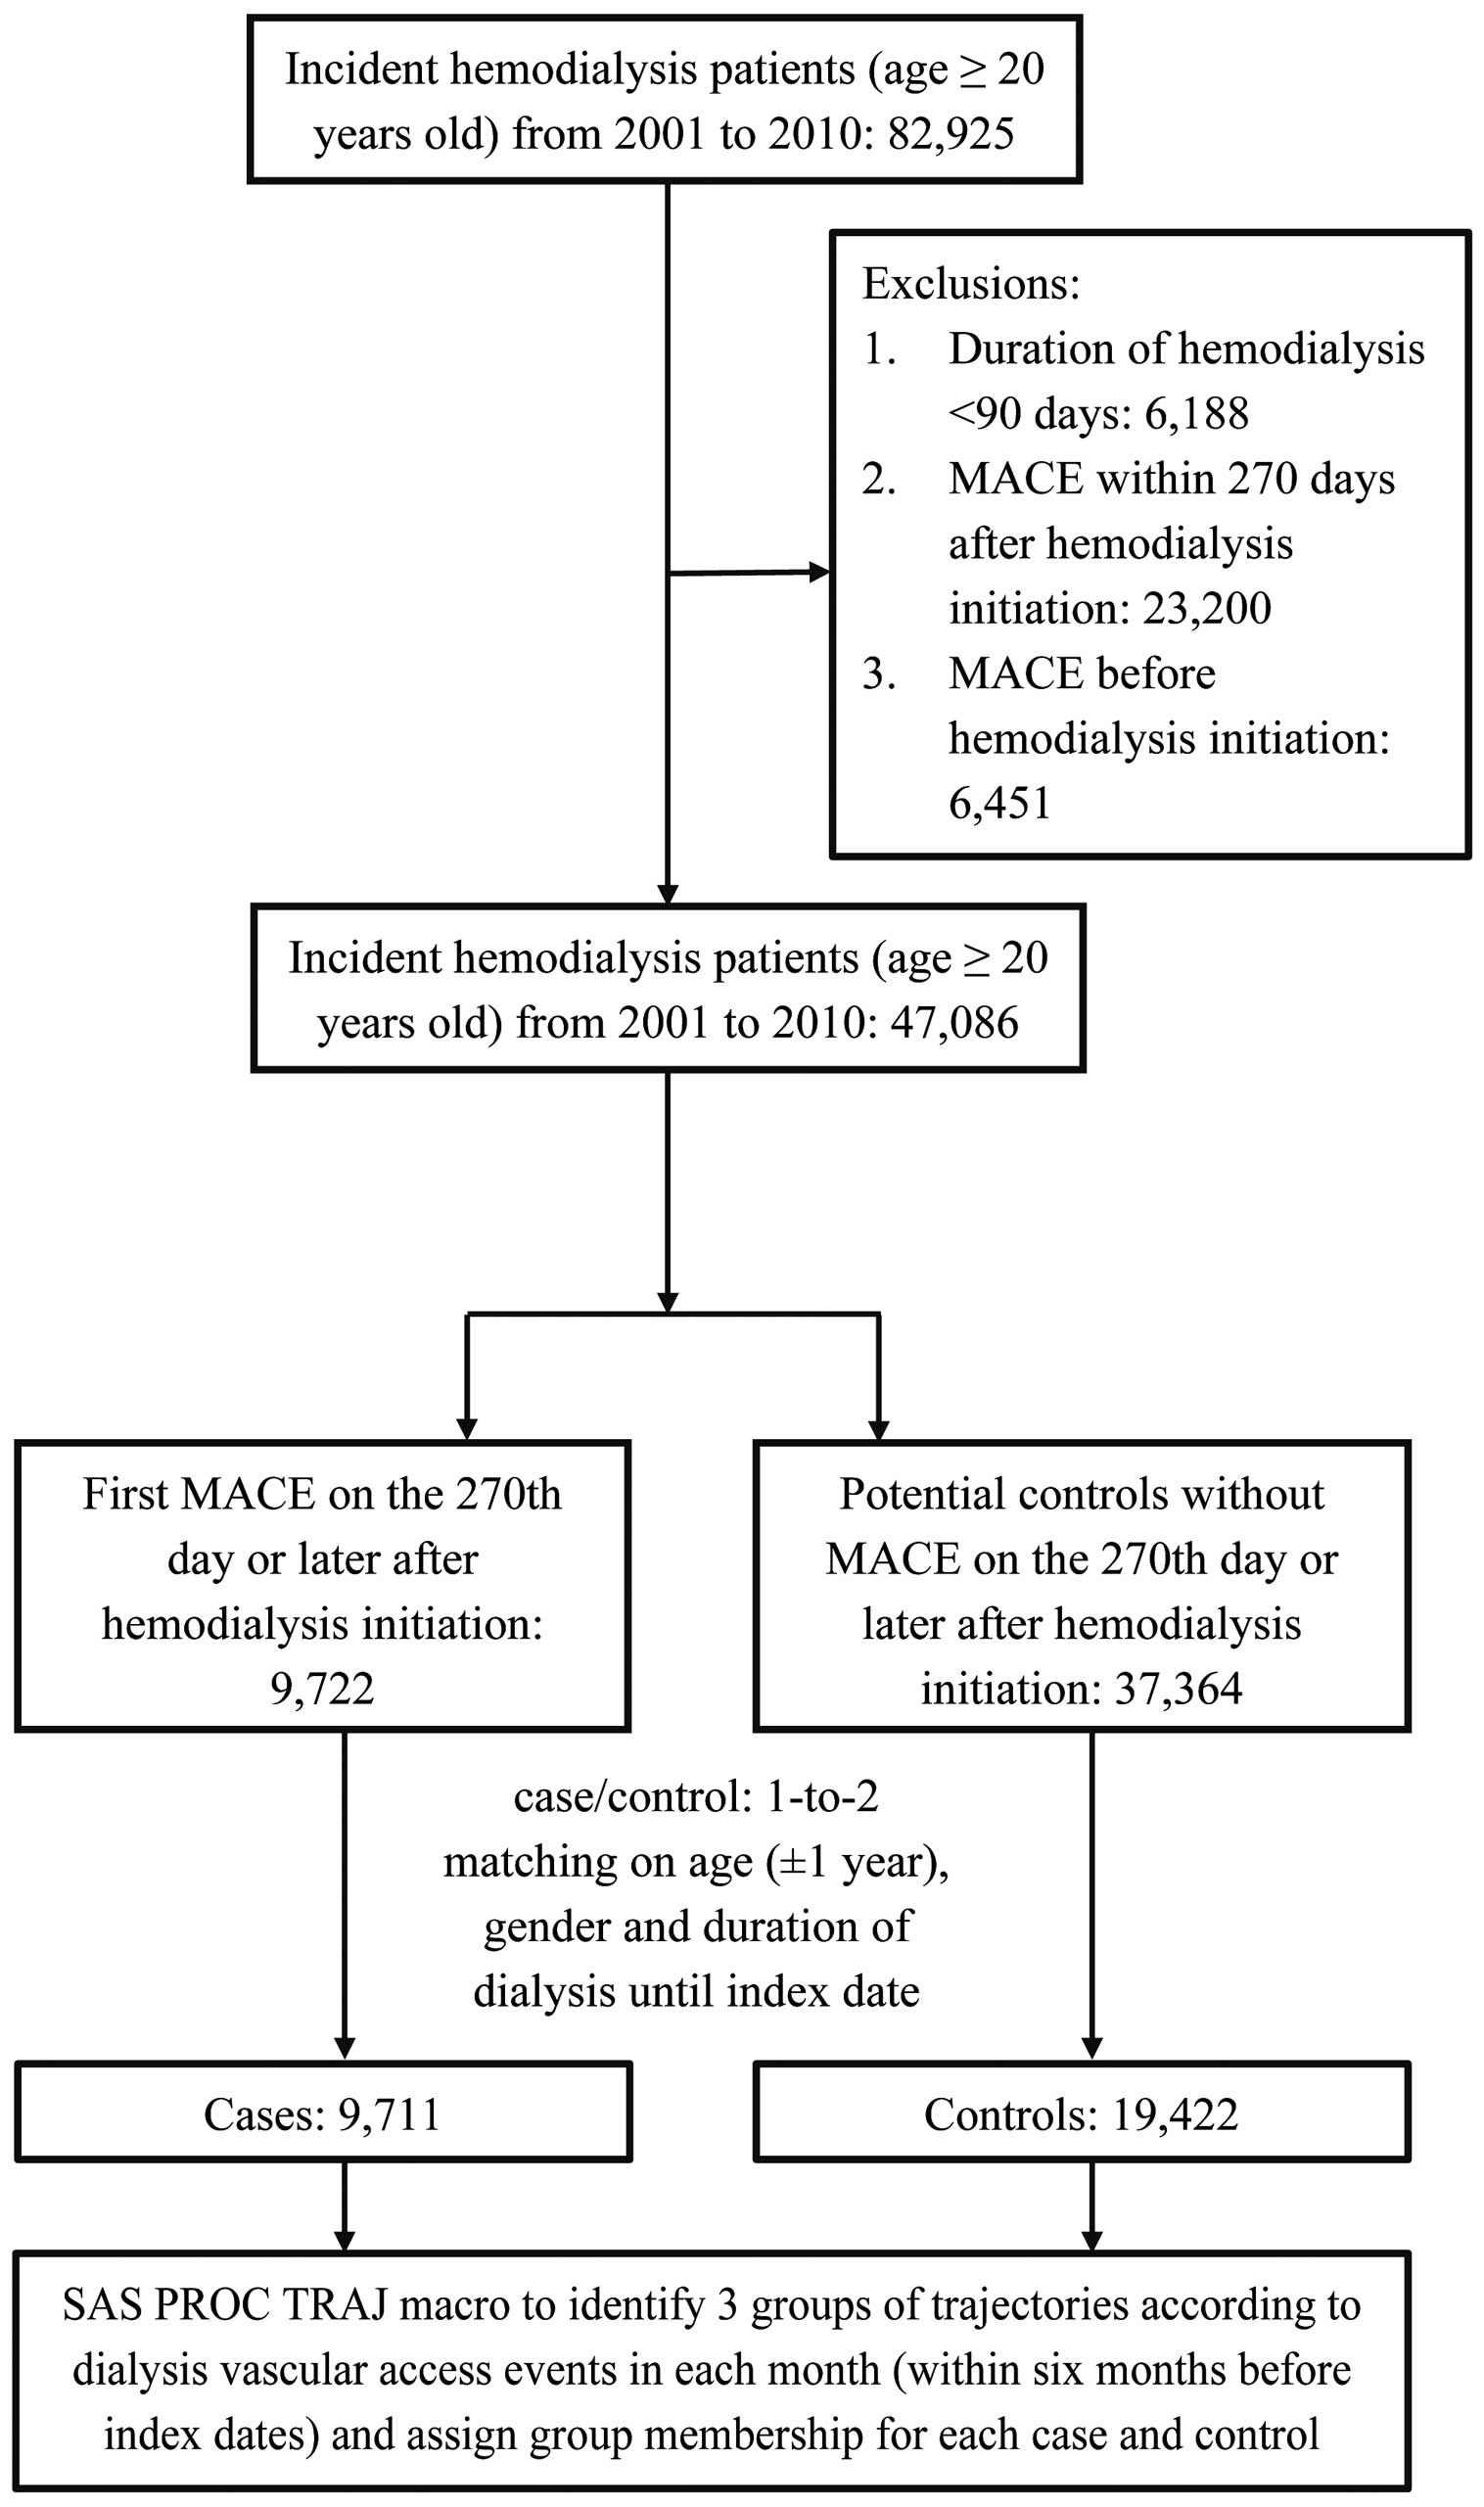
The study used a nested case-control design. We identified 47,086 ESRD patients (ICD-9-CM code: 585) who initially received hemodialysis therapy between 1 January 2001 and 31 December 2010 as our study cohort by excluding: (1) those who already initiated hemodialysis before 2001; (2) renal transplantation recipients before hemodialysis occurred; (3) those patients who ever received peritoneal dialysis before hemodialysis; (4) patients aged younger than 20 years at the time of initiating hemodialysis; and (5) those receiving hemodialysis for <90 days.
Selecting Cases and Controls, and Defining Their Comorbidities
Cases were defined as patients in the cohort who developed MACE (Supplementary Table 1; myocardial infarction, ICD-9-CM codes: 410, 412; congestive heart failure: 402.01, 402.11, 402.91, 425, 428, 429.3; peripheral vascular disease: 440, 441, 442, 443.1–443.9x, 447.1x, 785.4x, and cerebrovascular disease: 362.34, 430–436, 437–437.1, 437.9, 438, 781.4, 784.3, 997.0) and were hospitalized for MACE on the 270th day or later after their dialysis initiation. There were 9,722 patients selected as cases in the present study. We randomly selected 2 controls for each case by matching cases on sex, birth year (±1 year), and duration of hemodialysis. As we defined index date as the date of MACE presence in the inpatient claims of each case, the index date for each control was the day of hemodialysis initiation adding the matched duration of hemodialysis. Finally, 11 cases were excluded because no eligible controls were available for them. Then, we searched the comorbidities for the 9,711 cases and 19,422 controls from inpatient/outpatient claims before patient’s initiation of maintenance hemodialysis (Figure 1).
The comorbidities we analyzed included those comorbidities listed in the Romano-Charlson comorbidity index score, including diabetes, hypertension, ischemic heart disease, dyslipidemia, myocardial infarction, heart failure, peripheral artery disease, stroke, dementia, chronic lung disease, peptic ulcer disease, liver disease, hemiplegia/paraplegia and malignancy (Supplementary Table 1).
Trajectory Groups of Vascular Access Dysfunction
We searched in both inpatient and outpatient claims for procedure codes (Supplementary Table 1) that were related to vascular access malfunction/dysfunction (Procedure codes include arteriovenous fistula (AVF)/arteriovenous graft (AVG) operation, temporary/permanent double-lumen catheter placement, percutaneous intervention of access or surgical thromboembolectomy) during the 6-month period prior to the index date for each patient. The rationale of utilizing a 6-month period prior to MACE as the observation interval of vascular access dysfunction was based on the findings by Hase et al who found that initial MACEs after hemodialysis usually occur before the 8th to 9th month of hemodialysis and the temporal nearness of shunt dysfunction and MACE in a clinical scenario.8,11
Because 3-month hemodialysis after dialysis initiation was needed to make sure these patients were in their stable stage of maintenance hemodialysis, at least 6 months (9 months minus 3 months) would be left as an observation period for those patients who have already passed “the early unstable period” of hemodialysis. To identify distinctive groups of the 6-month changes in vascular access dysfunction, the group-based trajectory model was used. Each patient’s counts of vascular access dysfunction events were summed within each month in the 6-month period. We applied group-based trajectory modeling to categorize patients according to their counts of vascular access dysfunction in each month over the 6-month period prior to the index date.
Statistical Analysis
The group-based trajectory analysis was performed with the PROC TRAJ macro in the SAS statistical software (version 9.4 for Windows; SAS Institute Inc., Cary, NC, USA).12
This method assumes that the population is composed of a mixture of distinct groups defined by their trajectories, and each group of patients follow similar patterns of developmental trajectories; for example, Yi={yi1, yi2, yi3, .... yiT} represented the long-term repeated measurements of vascular access dysfunction on patient
i
over T periods. The group-based trajectory model supposes that the study population is composed of a mixture of
j
underlying groups with various patterns of long-term vascular access dysfunction. P(Yi) denotes the probability of Yi
and is estimated from ΣπjPj(Yi), a weighted sum of probabilities when individual
i
is in the group
j, and πj, the weight, is the proportion of group
j
in the total study population. We assumed the distribution of P(Yi) in this study as a Poisson distribution. The Bayesian information criterion (BIC) from models assuming 1 to 5 trajectories and fitted by intercept-only, linear, quadratic, or cubic functions (up to a third-order polynomial) was calculated to determine the final model with best fitness.12,13
The optimal trajectory group number was determined by the smallest BIC in absolute value. If the value of 2∆BIC, comparing model fit of the more complex model with the simpler model to approximate the log Bayes factor, is greater than 10, it can be interpreted as very strong evidence for the more complex model. The order of the equations varied among different combinations, and the preferred order for the polynomial function was determined by the highest order with a stable standard error (SE) of the estimates in each trajectory according to the statistical criteria (P<0.05). After the model was selected, diagnostic criteria to judge model adequacy were examined: (1) average posterior probability of assignment is >0.7; (2) odds of correct classification is >5; and (3) estimated group probabilities and the proportions of the sample assigned to the group are reasonably close; and (4) confidence intervals for group membership probabilities are reasonably tight.14,15
In the process of identifying the optimal number of groups and assessing its adequacy, because the pattern of 5 groups of trajectories is not a useful pattern to recognize in a clinical setting in our test run (Supplementary Figure 1), as well as the estimates in 2 of the groups are not separable (high SE and P>0.05), a series of models containing from 1 to 4 groups of trajectories were compared according to their BIC (Supplementary Table 2). Absolute value of BIC decreased gradually as the number of groups increased from 1 (BIC=−40,868.0) to 4 (BIC=−34,316.7). The 2∆BIC for the comparison of the 3- vs. 2-group and the 4- vs. 3-group model were equal to 1010 and 1389; however, the 4-group trajectories (Supplementary Figure 2) compared with the 3-group ones were still not a useful pattern to identify patients in a clinical scenario. Thus, we selected the 3-group model (Figure 2) because the model selection does not maximize statistics of model fit, but does summarize distinctive and useful features of the data.15
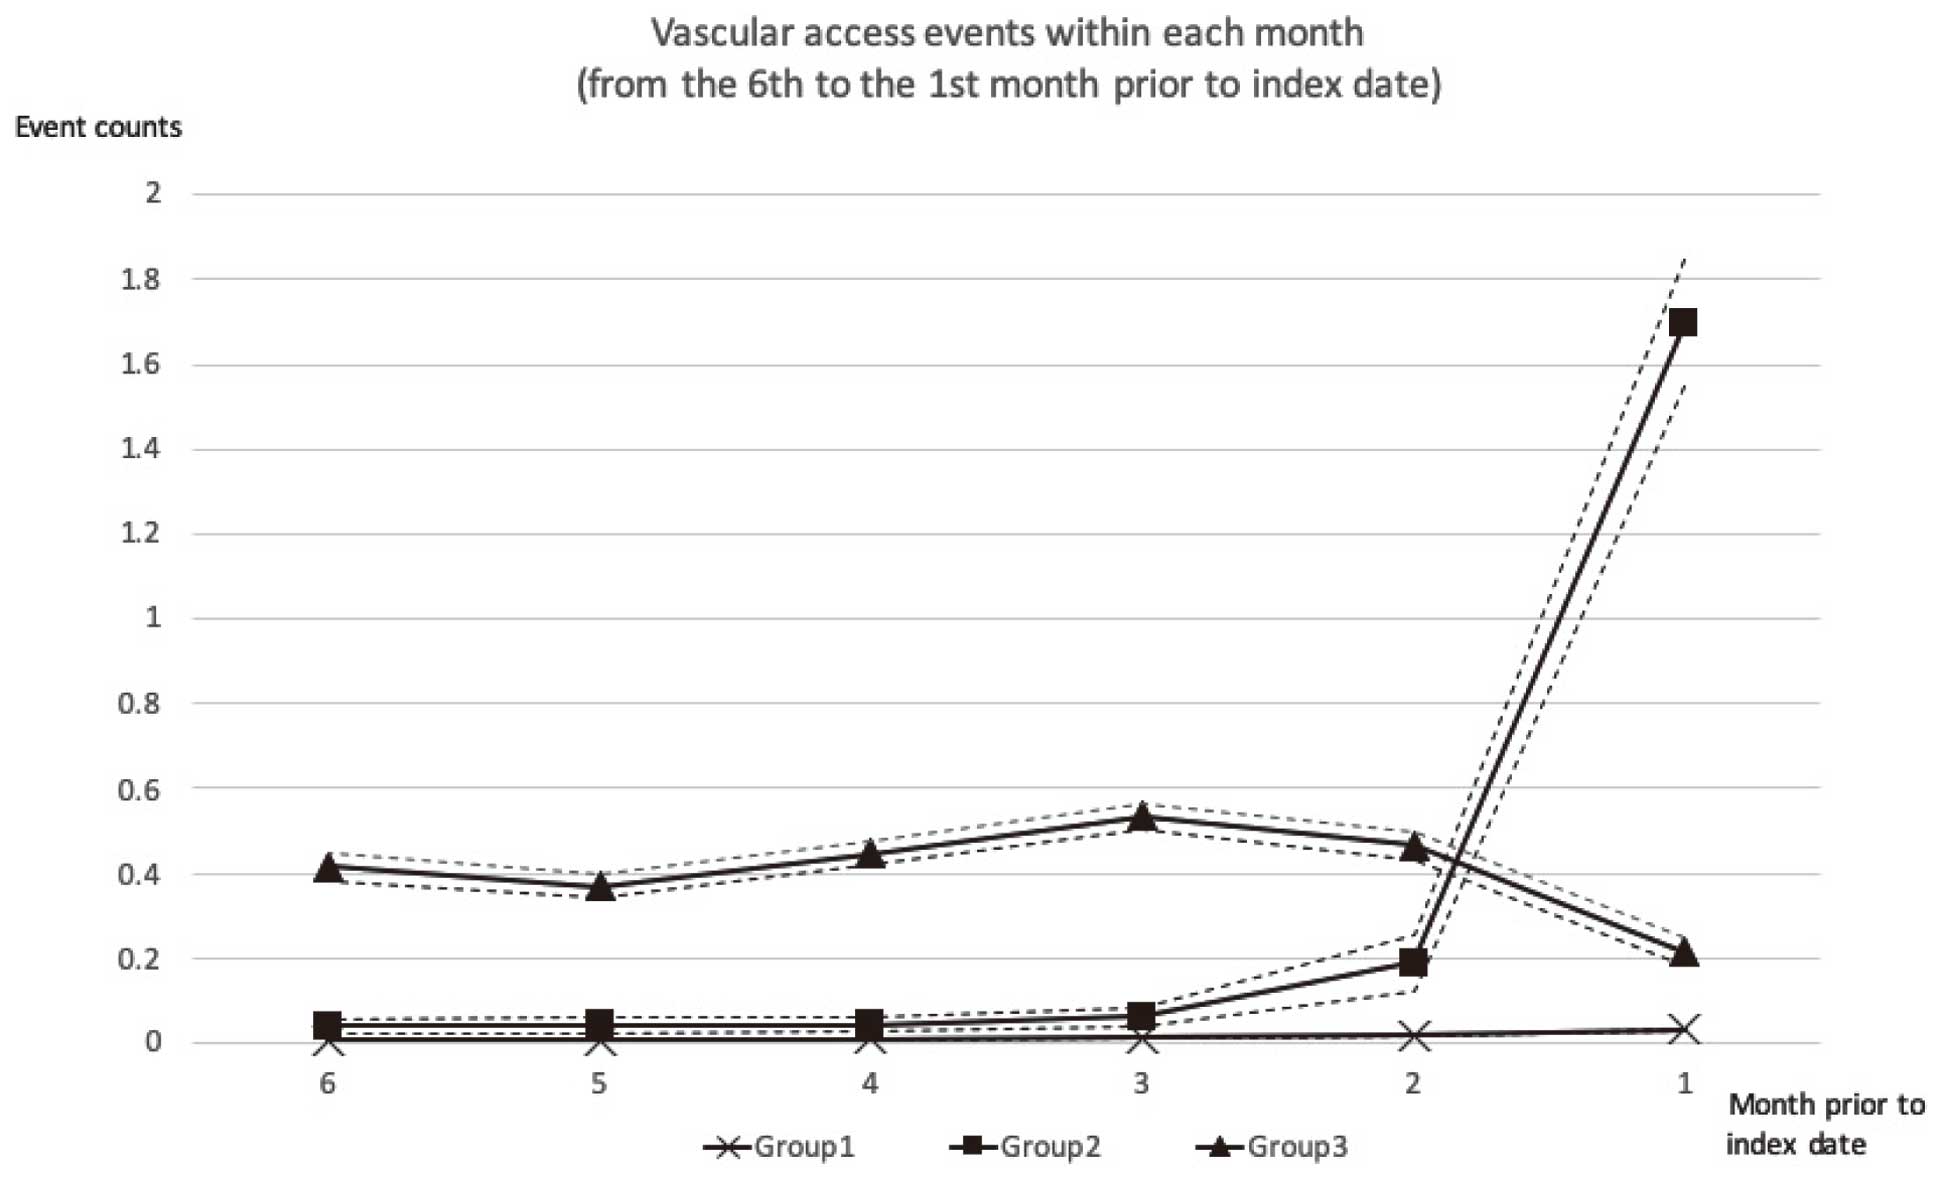
The next step was to determine the preferred order for the polynomial function and the 3-group model, consisting of the cubic, quadratic, and cubic equation, was identified as the best-fit model with a stable SE of the estimates. The model adequacy was acceptable because the average of the posterior probabilities of group membership for individuals assigned to 3 groups was 0.95, and the odds of correct classification was 42.0. Overall, there were 26,744 patients in group 1 (no dysfunction), 650 in group 2 (escalating dysfunction) and 1,739 in group 3 (persistent dysfunction).
Baseline characteristics of the trajectory groups were presented as means±standard deviation or proportion as appropriate, and we compared them by using analysis of variance (ANOVA) or Chi-squared statistics. Unconditional logistic regression analyses for the association between MACE and the trajectory groups of vascular access dysfunction were conducted. The association of interest was determined by odds ratios (OR) and 95% confidence intervals (CI). Multiple logistic regression analyses were performed by adjusting for various subsets of covariates (covariate set 1 included traditional risk factors for MACE: diabetes, hypertension, coronary artery disease, and dyslipidemia; covariate set 2 added calendar year of dialysis initiation to balance time-related progress in knowledge and technology in hemodialysis and vascular access care; covariate set 3 adjusted for all the available comorbidities in the dataset), and the adjusted ORs and 95% CIs of MACE in relation to the trajectory groups were calculated. The data were analyzed using the SAS software and results were considered statistically significant when P<0.05.
Results
Patient Characteristics in Each Group of Vascular Dysfunction
The descriptive data for the samples in each trajectory group are presented in
Table 1. In group 2, both the mean age of initiating dialysis and the percentage of male gender, which were traditional risk factors for MACE, were higher than those in group 3. However, the percentage of MACE cases was the highest in group 3, with a case/control ratio of 968/771. Also, group 3 had more patients with baseline diabetes, coronary artery disease and dyslipidemia than the other 2 groups.
Table 1.
Clinical Characteristics of Patients
| Characteristics |
Group 1
(n=26,744) |
Group 2
(n=650) |
Group 3
(n=1,739) |
P value |
| Age (years) |
63.1±12.0 |
66.3±11.6 |
64.7±12.2 |
<0.001 |
| Gender (male) |
13,608 (50.9) |
301 (46.3) |
758 (43.6) |
<0.001 |
| MACE |
| Case/control |
8491/18,253 |
252/398 |
968/771 |
<0.001 |
| Calendar year of dialysis initiation |
| 2001–2005 |
14,844 (55.5) |
410 (63.1) |
1,176 (67.6) |
<0.001 |
| 2006–2010 |
11,900 (44.5) |
240 (36.9) |
563 (32.4) |
|
| Baseline comorbidities |
| Diabetes mellitus |
13,506 (50.5) |
329 (50.6) |
966 (55.6) |
<0.001 |
| Hypertension |
20,641 (78.5) |
501 (77.1) |
1,365 (77.2) |
0.264 |
| Coronary artery disease |
4,180 (15.6) |
115 (17.7) |
340 (19.6) |
0.004 |
| Dyslipidemia |
5,326 (19.9) |
129 (19.9) |
387 (22.3) |
0.041 |
| Dementia |
227 (0.9) |
7 (1.1) |
22 (1.3) |
0.230 |
| Chronic pulmonary disease |
2,010 (7.5) |
73 (11.2) |
150 (8.6) |
0.616 |
| Peptic ulcer disease |
5,224 (19.5) |
122 (18.8) |
376 (21.6) |
0.037 |
| Mild liver disease |
1,272 (4.8) |
22 (3.4) |
67 (3.9) |
0.566 |
| Moderate or severe liver disease |
238 (0.9) |
6 (0.9) |
15 (0.9) |
0.881 |
| Hemiplegia/paraplegia |
157 (0.6) |
5 (0.8) |
12 (0.7) |
0.894 |
| Malignancy |
2,058 (7.7) |
53 (8.2) |
114 (6.6) |
0.085 |
Data are presented as the mean±SD or number (percentage). MACE, major adverse cardiovascular event.
In
Table 2, univariate logistic regression analysis indicated that patients in group 3, who experienced persistent vascular access dysfunction within 6 months before the index dates, had the highest chance of subsequent MACE (OR 2.70, in comparison with group 1; 95% CI, 2.45–2.98). MACE was still associated with persistent vascular access dysfunction in group 3 patients after controlling for potential confounders like traditional risk factors for MACE (diabetes, hypertension, coronary artery disease and dyslipidemia; OR 2.67, 95% CI, 2.42–2.98), further controlling for the calendar year of initiating dialysis (OR 2.48, 95% CI, 2.23–2.75), and further controlling for the underlying comorbidities (OR 2.47, 95% CI, 2.23–2.75). The odds ratio of comparing patients with an escalating dysfunction pattern (group 2) with those without dysfunction (group 1) was 1.28 (95% CI, 1.08–1.51), even after adjustment for the available potential confounders.
Table 2.
Logistic Regression Analyses for Association of the Trajectory of Vascular Access Dysfunction (Counts of Events) and Odds of MACE
| Models |
Dysfunction
pattern |
Odds ratio |
95% CI
for OR |
P value |
| Univariate analysis |
Group 2 vs. 1 |
1.36 |
1.16–1.60 |
<0.001 |
| Group 3 vs. 1 |
2.70 |
2.45–2.98 |
<0.001 |
| Multivariate analysis adjusted for covariate set 1§ |
Group 2 vs. 1 |
1.36 |
1.16–1.59 |
<0.001 |
| Group 3 vs. 1 |
2.67 |
2.42–2.95 |
<0.001 |
| Multivariate analysis adjusted for covariate set 2§§ |
Group 2 vs. 1 |
1.28 |
1.08–1.51 |
0.005 |
| Group 3 vs. 1 |
2.48 |
2.23–2.75 |
<0.001 |
| Multivariate analysis adjusted for covariate set 3§§§ |
Group 2 vs. 1 |
1.28 |
1.08–1.51 |
0.005 |
| Group 3 vs. 1 |
2.47 |
2.23–2.75 |
<0.001 |
MACE, major adverse cardiovascular events; CI, confidence interval; OR, odds ratio. §Adjusted by patients’ baseline states of diabetes mellitus, hypertension, coronary artery disease, dyslipidemia. §§Adjusted by patients’ baseline states of diabetes mellitus, hypertension, coronary artery disease, dyslipidemia, calendar year of initiating dialysis (2001–2005, 2006–2010). §§§Adjusted by patients’ baseline states of diabetes mellitus, hypertension, coronary artery disease, dyslipidemia, calendar year of initiating dialysis (2001–2005, 2006–2010), dementia, chronic pulmonary disease, peptic ulcer disease, liver disease, paraplegia/hemiplegia, malignancy.
Discussion
The present study demonstrated recurrent vascular access dysfunction, particularly in an uninterrupted way of presentation, which is an easily recognized pattern in a clinical scenario, can be an unconventional risk factor for MACE in hemodialysis patients. The association remains significant even after adjustment for traditional risk factors for MACE.
Hemodialysis vascular access stenosis is initiated as a result of neointimal hyperplasia, which can be related to: (1) hemodynamic stress at the site of anastomosis; (2) surgical injury at the time of creation; (3) cytokine production by macrophages attracted by the presence of the implants of synthetic access; (4) dialysis needle injuries; and (5) endothelial dysfunction due to uremia itself.16
Recurrent vascular access dysfunction, observed in ~8% of the patients in this study, is commonly noted in hemodialysis patients. According to previous reports, stenosis recurs in approximately 25–40% of patients within 6 months after endovascular intervention.17,18
Trauma of endothelial and smooth muscle cells at the time of angioplasty for treating the initial stenosis puts the vascular access at risk of recurrent stenosis.19
Neointimal hyperplasia, in which the histology resembles the histology of atherosclerosis, may result from endothelial dysfunction due to inflammation.20
In addition, this uremia-related inflammation caused by oxidative stress may promote abnormal vascular behavior and thrombosis, not only in neointimal hyperplasia of vascular access, but also in cardiovascular morbidities/mortalities in ESRD patients. Hence, recurrent vascular access dysfunction is likely interrelated with MACE through inflammation.21,22
Some predisposing and precipitating factors may contribute to hemodialysis vascular access dysfunction. Female gender, elderly age, greater body mass index, diabetes, coronary artery disease, peripheral vascular disease, surgical expertise levels, small vessel or anatomical anomaly, hypercoagulable state, and African-American ethnicity can be the predisposing causes of vascular access failure. In contrast, the precipitating factors include hypovolemia, hypotension, excessive pressure to obtain hemostasis at the cannulation site, and repeated cannulation.23–27
If we focus our attention on “recurrent” dysfunction requiring repeated interventions to maintain patency of access, diabetes is identified as a strong predictor of recurrent vascular access dysfunction in several studies.17,28,29
As far as we know, diabetes is also a risk factor for cardiovascular disease/dysfunction in hemodialysis patients.30
Moreover, in the present study, 55.6% of the patients in the group with persistent dysfunction also suffered from diabetes, to a higher extent than the other 2 groups (50.5% and 50.6% in groups 1 and 2; P<0.001) Nonetheless, MACE was still related to vascular access dysfunction with statistical significance after controlling for the traditional cardiovascular risk factors, including diabetes, in our analysis. Therefore, recurrent hemodialysis vascular dysfunction, especially if it happens in a persistent way, may be a novel risk factor compared with the traditional ones for subsequent MACE in hemodialysis patients.
In addition to diabetes, some certain patient characteristics are associated with recurrent vascular access dysfunction depending on the types of vascular access. In patients with AVF, predictors of recurrent vascular access dysfunction are: diameter of vascular access, length of stenosis lesion, residual stenosis after intervention, severity of stenosis and access flow.17,28,29,31
All these factors can be summarized into a common factor-low access flow. Low access flow can lead to inadequate dialysis, which has been demonstrated to relate to high morbidity and mortality in dialysis patients. Therefore, delivering a minimum dose of Kt/V 1.2 to hemodialysis patients is recommended by clinical practice guidelines.32,33
In addition to inadequate dialysis, access blood flow may reflect cardiac function. A recent study disclosed that blood flow <1,000 mL/min is an independent risk factor for both short-term and long-term all-cause mortality in chronic hemodialysis patients.34
Other than diabetes, hypoalbuminemia is also a predictor of either recurrent AVG dysfunction or recurrent bacteremia in permanent double-lumen catheters.35,36
The mechanism by which hypoalbuminemia contributes to recurrent synthetic vascular access failure may be related to inflammation because hypoalbuminemia is considered as a marker of an inflammatory state in dialysis patients.37–39
In connection with malnutrition/inflammation and MACE, micro-inflammation in the implants of synthetic access, which results from the chronic microbial colonization inside its biofilm, may increase cardiovascular risks and influence survival of dialysis patients.40,41
Compared to AVF, the presence of a synthetic vascular access was associated with a 30% or more increase in the average C-reactive protein levels, which may be involved not only in the initiation and progression of accelerated atherosclerosis in uremia and subsequent MACE, but also in predicting vascular access thrombosis.42,43
In summary, recurrent hemodialysis vascular access dysfunction, especially if it is persistent in its presentation, which can be observed in its association with MACE in our study, may be a surrogate of all these aforementioned risk factors for MACE in patients receiving hemodialysis.
This study has several limitations. First, there was a lack of records of vascular access types currently in use in the NHIRD because this administrative database is specifically for the purpose of claiming reimbursement. When a patient has records of tunneled cuffed catheter placements and fistula/graft creations at the same time, commonly seen in the beginning of hemodialysis or after management of vascular dysfunction, the NHIRD data do not include enough information concerning which vascular access was in use. Nevertheless, we still tried to explore the vascular access types in this administrative database, but the percentages of missing information were quite high (Supplementary Table 3). Therefore, we did not provide the details of vascular access types at index dates and only analyzed our data without them. Second, neither clinical parameters related to cardiovascular risks or vascular access dysfunction, including blood pressure, physical status, smoking, body mass index, residual renal function, dialysis dose, and anatomical location of vascular access, nor the laboratory data were available from the NHIRD. Leaving out these variables for analyses may have led to a certain degree of residual confounding. Third, because hemodialysis reimbursement is a bundle payment and some of the prescribed medications, including erythropoiesis-stimulating agents, were not claimed, we were unable to assess their roles in explaining the relationship between vascular access dysfunction and MACE. Fourth, the results were acquired from those incident patients who had their maintenance hemodialysis for at least 9 months (3 months to confirm the state of chronic hemodialysis plus 6 months to follow any dysfunction of vascular access), and patients unable to survive for such a long period of time were not included. As such, extrapolating our results to patients with other clinical characteristics, especially the initial unstable status of ESRD and dialysis vascular access, would be difficult. Finally, not considering competing risk events in a case-control design nested within a cohort may overestimate the risk of vascular access events causing subsequent MACE.44
Among the potential controls (n=37,364), we noted 10,507 (28.1%) who terminated the health insurance coverage (likely to die) earlier than the last day of 2010. Some of these patients could have encountered MACE if they were observed longer. However, the potential for bias could be introduced only when the trajectory of dysfunction of hemodialysis vascular access is related to chance of death during the follow up, which is very difficult, even impossible, to assess.
Our study also has several strengths. First, the universal medical coverage in Taiwan allows for obtaining data from the whole population, and the claims data are of a sufficient size for data processing, matching, and proper trajectory grouping in these hemodialysis patients to document our study outcomes. Second, the design of the present study in a nested case-control strategy helps us avoid potential selection bias commonly seen in case-control studies.
Conclusions
We found that uninterrupted clusters of vascular access dysfunction are associated with an increased risk of subsequent MACE. For this reason, persistently recurrent vascular access failure can be an early sign of MACE for patients receiving maintenance hemodialysis. We concluded that for hemodialysis patients experiencing persistent vascular access failure, they should be managed promptly not only for access patency, but also for patients’ underlying cardiovascular diseases to reduce the risk of MACE.
Funding
This research was supported by the NCKUH-10302005, 10903028 grants from the National Cheng Kung University Hospital, College of Medicine, National Cheng Kung University, Tainan, Taiwan.
Disclosures
All authors declare that they have no conflicts of interest.
Supplementary Files
Please find supplementary file(s);
http://dx.doi.org/10.1253/circj.CJ-19-1036
References
- 1.
Foley RN, Parfrey PS. Cardiovascular disease and mortality in ESRD. J Nephrol 1998; 11: 239–245.
- 2.
Goodkin DA, Bragg-Gresham JL, Koenig KG, Wolfe RA, Akiba T, Andreucci VE, et al. Association of comorbid conditions and mortality in hemodialysis patients in Europe, Japan, and the United States: The Dialysis Outcomes and Practice Patterns Study (DOPPS). J Am Soc Nephrol 2003; 14: 3270–3277.
- 3.
Ishani A, Collins AJ, Herzog CA, Foley RN. Septicemia, access and cardiovascular disease in dialysis patients: The USRDS Wave 2 study. Kidney Int 2005; 68: 311–318.
- 4.
Weiner DE, Tighiouart H, Elsayed EF, Griffith JL, Salem DN, Levey AS, et al. Inflammation and cardiovascular events in individuals with and without chronic kidney disease. Kidney Int 2008; 73: 1406–1412.
- 5.
Selby NM, McIntyre CW. The acute cardiac effects of dialysis. Semin Dial 2007; 20: 220–228.
- 6.
Block GA, Klassen PS, Lazarus JM, Ofsthun N, Lowrie EG, Chertow GM. Mineral metabolism, mortality, and morbidity in maintenance hemodialysis. J Am Soc Nephrol 2004; 15: 2208–2218.
- 7.
Matsuo H, Dohi K, Machida H, Takeuchi H, Aoki T, Nishimura H, et al. Echocardiographic assessment of cardiac structural and functional abnormalities in patients with end-stage renal disease receiving chronic hemodialysis. Circ J 2018; 82: 586–595.
- 8.
Kuo TH, Tseng CT, Lin WH, Chao JY, Wang WM, Li CY, et al. Association between vascular access dysfunction and subsequent major adverse cardiovascular events in patients on hemodialysis: A population-based nested case-control study. Medicine (Baltimore) 2015; 94: e1032.
- 9.
Kim HJ, Lee H, Kim DK, Oh KH, Kim YS, Ahn C, et al. Recurrent vascular access dysfunction as a novel marker of cardiovascular outcome and mortality in hemodialysis patients. Am J Nephrol 2016; 44: 71–80.
- 10.
Erickson KF, Mell MW, Winkelmayer WC, Chertow GM, Bhattacharya J. Provider visit frequency and vascular access interventions in hemodialysis. Clin J Am Soc Nephrol 2015; 10: 269–277.
- 11.
Hase H, Tsunoda T, Tanaka Y, Takahashi Y, Imamura Y, Ishikawa H, et al. Risk factors for de novo acute cardiac events in patients initiating hemodialysis with no previous cardiac symptom. Kidney Int 2006; 70: 1142–1148.
- 12.
Jones BL, Nagin DS, Roeder K. A SAS procedure based on mixture models for estimating developmental trajectories. Sociol Methods Res 2001; 29: 374–393.
- 13.
Jones BL, Nagin DS. Advances in group-based trajectory modeling and an SAS procedure for estimating them. Sociol Methods Res 2007; 35: 542–571.
- 14.
Nagin DS. Group-based modeling of development: Cambridge, Massachusetts. Harvard University Press, 2005.
- 15.
Nagin DS, Odgers CL. Group-based trajectory modeling in clinical research. Annu Rev Clin Psychol 2010; 6: 109–138.
- 16.
Roy-Chaudhury P, Sukhatme VP, Cheung AK. Hemodialysis vascular access dysfunction: A cellular and molecular viewpoint. J Am Soc Nephrol 2006; 17: 1112–1127.
- 17.
Neves M, Outerelo C, Pereira M, Neves F, Carvalho T, Maia P, et al. Predictive factors of recurrent endovascular intervention for cephalic arch stenosis after percutaneous transluminal angioplasty. J Vasc Surg 2018; 68: 836–842.
- 18.
Bountouris I, Kristmundsson T, Dias N, Zdanowski Z, Malina M. Is repeat PTA of a failing hemodialysis fistula durable? Int J Vasc Med 2014; 2014: 369687.
- 19.
Chang CJ, Ko PJ, Hsu LA, Ko YS, Ko YL, Chen CF, et al. Highly increased cell proliferation activity in the restenotic hemodialysis vascular access after percutaneous transluminal angioplasty: Implication in prevention of restenosis. Am J Kidney Dis 2004; 43: 74–84.
- 20.
Gagliardi GM, Rossi S, Condino F, Mancuso D, Greco F, Tenuta R, et al. Malnutrition, infection and arteriovenous fistula failure: Is there a link? J Vasc Access 2011; 12: 57–62.
- 21.
Locatelli F, Canaud B, Eckardt KU, Stenvinkel P, Wanner C, Zoccali C. Oxidative stress in end-stage renal disease: An emerging threat to patient outcome. Nephrol Dial Transplant 2003; 18: 1272–1280.
- 22.
Zoccali C, Mallamaci F, Tripepi G. Inflammation and atherosclerosis in end-stage renal disease. Blood Purif 2003; 21: 29–36.
- 23.
Lok CE, Allon M, Moist L, Oliver MJ, Shah H, Zimmerman D. Risk equation determining unsuccessful cannulation events and failure to maturation in arteriovenous fistulas (REDUCE FTM I). J Am Soc Nephrol 2006; 17: 3204–3212.
- 24.
Goldfarb-Rumyantzev AS, Rout P. Characteristics of elderly patients with diabetes and end-stage renal disease. Semin Dial 2010; 23: 185–190.
- 25.
Plumb TJ, Adelson AB, Groggel GC, Johanning JM, Lynch TG, Lund B. Obesity and hemodialysis vascular access failure. Am J Kidney Dis 2007; 50: 450–454.
- 26.
Kian K, Shapiro JA, Salman L, Khan RA, Merrill D, Garcia L, et al. High brachial artery bifurcation: Clinical considerations and practical implications for an arteriovenous access. Semin Dial 2012; 25: 244–247.
- 27.
Knoll GA, Wells PS, Young D, Perkins SL, Pilkey RM, Clinch JJ, et al. Thrombophilia and the risk for hemodialysis vascular access thrombosis. J Am Soc Nephrol 2005; 16: 1108–1114.
- 28.
Clark TW, Hirsch DA, Jindal KJ, Veugelers PJ, LeBlanc J. Outcome and prognostic factors of restenosis after percutaneous treatment of native hemodialysis fistulas. J Vasc Interv Radiol 2002; 13: 51–59.
- 29.
Lamprou A, de Bruin C, van Roon A, Loonstra J, van der Laan M, Tielliu I, et al. Patient-related factors influencing patency of autogenous brachiocephalic haemodialysis fistulas. J Vasc Access 2017; 18: 104–109.
- 30.
Hung KC, Lee CH, Chen CC, Chu CM, Wang CY, Hsieh IC, et al. Advanced left ventricular diastolic dysfunction in uremic patients with type 2 diabetes on maintenance hemodialysis. Circ J 2012; 76: 2380–2385.
- 31.
Balamuthusamy S, Reddi AL, Madhrira MH, Sankarapandian B, Nguyen P, Vallurupalli A, et al. Clinical predictors of recurrent stenosis and need for re-intervention in the cephalic arch in patients with brachiocephalic AV fistulas. J Vasc Access 2017; 18: 319–324.
- 32.
Clinical practice guidelines for hemodialysis adequacy, update 2006. Am J Kidney Dis 2006; 48(Suppl 1): S2–S90.
- 33.
National Kidney Foundation. KDOQI Clinical Practice Guideline for Hemodialysis Adequacy: 2015 update. Am J Kidney Dis 2015; 66: 884–930.
- 34.
Wu CK, Wu CL, Lin CH, Leu JG, Kor CT, Tarng DC. Association of vascular access flow with short-term and long-term mortality in chronic haemodialysis patients: A retrospective cohort study. BMJ Open 2017; 7: e017035.
- 35.
Miller PE, Carlton D, Deierhoi MH, Redden DT, Allon M. Natural history of arteriovenous grafts in hemodialysis patients. Am J Kidney Dis 2000; 36: 68–74.
- 36.
Tanriover B, Carlton D, Saddekni S, Hamrick K, Oser R, Westfall AO, et al. Bacteremia associated with tunneled dialysis catheters: Comparison of two treatment strategies. Kidney Int 2000; 57: 2151–2155.
- 37.
Choi SR, Lee YK, Cho AJ, Park HC, Han CH, Choi MJ, et al. Malnutrition, inflammation, progression of vascular calcification and survival: Inter-relationships in hemodialysis patients. PLoS One 2019; 14: e0216415.
- 38.
Kaysen GA. Inflammation: Cause of vascular disease and malnutrition in dialysis patients. Semin Nephrol 2004; 24: 431–436.
- 39.
Cooper BA, Penne EL, Bartlett LH, Pollock CA. Protein malnutrition and hypoalbuminemia as predictors of vascular events and mortality in ESRD. Am J Kidney Dis 2004; 43: 61–66.
- 40.
Jones SM, Ravani P, Hemmelgarn BR, Muruve D, Macrae JM. Morphometric and biological characterization of biofilm in tunneled hemodialysis catheters. Am J Kidney Dis 2011; 57: 449–455.
- 41.
Wasse H. Catheter-related mortality among ESRD patients. Semin Dial 2008; 21: 547–549.
- 42.
Arici M, Walls J. End-stage renal disease, atherosclerosis, and cardiovascular mortality: Is C-reactive protein the missing link? Kidney Int 2001; 59: 407–414.
- 43.
Chou CY, Kuo HL, Yung YF, Liu YL, Huang CC. C-reactive protein predicts vascular access thrombosis in hemodialysis patients. Blood Purif 2006; 24: 342–346.
- 44.
Wolkewitz M, Cooper BS, Palomar-Martinez M, Olaechea-Astigarraga P, Alvarez-Lerma F, Schumacher M. Nested case-control studies in cohorts with competing events. Epidemiology 2014; 25: 122–125.
