Abstract
Background:
Prompt and potent antiplatelet effects are important aspects of management of ST-elevation myocardial infarction (STEMI) patients undergoing primary percutaneous coronary intervention (PPCI). We evaluated the association between platelet-derived thrombogenicity during PPCI and enzymatic infarct size in STEMI patients.
Methods and Results:
Platelet-derived thrombogenicity was assessed in 127 STEMI patients undergoing PPCI by: (1) the area under the flow-pressure curve for the PL-chip (PL18-AUC10) using the total thrombus-formation analysis system (T-TAS); and (2) P2Y12
reaction units (PRU) using the VerifyNow system. Patients were divided into 2 groups (High and Low) based on median PL18-AUC10
during PPCI. PRU levels during PPCI were suboptimal in both the High and Low PL18-AUC10
groups (median [interquartile range] 266 [231–311] vs. 272 [217–317], respectively; P=0.95). The percentage of final Thrombolysis in Myocardial Infarction (TIMI) 3 flow was lower in the High PL18-AUC10
group (75% vs. 90%; P=0.021), whereas corrected TIMI frame count (31.3±2.5 vs. 21.0±2.6; P=0.005) and the incidence of slow-flow/no-reflow phenomenon (31% vs. 11%, P=0.0055) were higher. The area under the curve for creatine kinase (AUCCK) was greater in the High PL18-AUC10
group (95,231±7,275 IU/L h vs. 62,239±7,333 IU/L h; P=0.0018). Multivariate regression analysis identified high PL18-AUC10
during PPCI (β=0.29, P=0.0006) and poor initial TIMI flow (β=0.37, P<0.0001) as independent determinants of AUCCK.
Conclusions:
T-TAS-based high platelet-derived thrombogenicity during PPCI was associated with enzymatic infarct size in patients with STEMI.
Primary percutaneous coronary intervention (PPCI) is the gold standard strategy for ST-elevation myocardial infarction (STEMI).1,2
Adjunct antithrombotic therapy, such as dual antiplatelet therapy (DAPT) with aspirin and P2Y12
receptor inhibitors, and intravenous anticoagulant drugs are the cornerstones of pharmacological treatment in patients with STEMI undergoing PPCI and serve to support reperfusion and optimize clinical outcomes.3
In particular, inhibition of P2Y12
receptors has been the focus of considerable interest.4
New P2Y12
receptor inhibitors, such as prasugrel, ticagrelor, and cangrelor, have been developed for more effective inhibition of P2Y12
receptors. Prompt and potent antiplatelet effects are required during PPCI in patients with STEMI.
Editorial p 885
Monitoring platelet function enables determination of platelet function in individual patients. The VerifyNow system (Accumetrics, San Diego, CA, USA) is a user-friendly point-of-care platelet function test system that produces results rapidly using a simple method. High on-treatment platelet reactivity (HTPR) is associated with adverse cardiovascular events.5,6
Thus, individualized antiplatelet therapy based on platelet function monitoring is recommended.7
However, some randomized clinical trials using the VerifyNow system have been unable to show the clinical superiority of monitoring reported as P2Y12
reaction units (PRU).8–11
A possible reason is that the PRU reflects platelet reactivity through P2Y12
receptors, but does not indicate total platelet-derived thrombogenicity because other pathways, such as thrombin receptors and thromboxane A2
receptors, also amplify platelet activation.
The Total Thrombus-Formation Analysis System (T-TAS; Fujimori Kogyo, Tokyo, Japan) is an automated microchip flow chamber system for the quantitative analysis of the thrombus formation process under blood flow conditions.12,13
This system allows evaluation of total platelet-derived thrombogenicity in a single run.13
Therefore, T-TAS may be suitable for evaluation of total platelet-derived thrombogenicity, even in STEMI patients who have been treated with various types of antithrombotic agents. The aim of the present study was to examine the time course and value of platelet-derived thrombogenicity measured by T-TAS in patients with STEMI undergoing PPCI compared with the VerifyNow system. We also investigated the association between T-TAS-based platelet-derived thrombogenicity during PPCI and enzymatic infarct size.
Methods
Patients
The present a prospective observational single-center study was designed to serially assess platelet function in Japanese patients with STEMI who underwent PPCI within 12 h of symptom onset. According to the fourth universal definition of myocardial infarction,14
STEMI was defined as the presence of chest discomfort or other ischemic symptoms with new ST-segment elevations at the J-point of >1 mm in 2 contiguous leads other than V2–V3, including newly diagnosed bundle branch block. Patients with any of the followings were excluded: cardiopulmonary arrest on admission, major bleeding events within 7 days prior to study enrollment, hematologic or malignant disease, renal dysfunction on hemodialysis, simultaneous occlusion of multiple coronary arteries, and the use of P2Y12
inhibitors within 7 days prior to admission.
The study protocol was approved by the Ethics Committee of Yokohama City University, and written comprehensive informed consent was obtained from all patients.
Antithrombotic Therapy and the PPCI Procedure
PPCI was performed after a Japanese standard loading dose of 20 mg prasugrel or 300 mg clopidogrel. The selection of a P2Y12
receptor inhibitor was left to the discretion of the attending cardiologist. A 200-mg loading dose of aspirin was administered to aspirin-naïve patients. All patients received unfractionated heparin in an intravenous bolus dose of 80 IU/kg at the time of presentation followed by an additional dose immediately before starting PPCI to maintain an activated clotting time of ≥250 s during the procedure. Access site and procedure technique, including stent type, were left to the discretion of the treating physicians. Argatroban and monteplase were also used as bailout therapy in patients with high thrombus burden and other thrombotic complications. The use of argatroban was restricted to individuals clinically suspected of having heparin-induced thrombocytopenia. At the time of the study, glycoprotein (GP) IIb/IIIa inhibitors were not approved in Japan for use in patients with acute coronary syndrome. After a loading dose of the antiplatelet drug, 3.75 mg/day prasugrel or 75 mg/day clopidogrel was administered, in addition to 100 mg/day aspirin as a maintenance dose.
Platelet Function Tests
Serial changes in platelet function were assessed during the acute phase of STEMI. Total platelet-derived thrombogenicity was measured by T-TAS before administration of antithrombotic agents, including unfractionated heparin (baseline) and 1 h (during PPCI), 24 h, and 2 weeks after loading of P2Y12
receptor inhibitors. Platelet reactivity was also determined with the VerifyNow system at the same time points. The attending physician was blinded to the results of platelet function tests.
T-TAS
T-TAS allows measurement of thrombus formation using 2 types of microchips: the PL-chip and AR-chip.12,13
The PL-chip contains 25 capillary channels (width 40 µm, depth 40 µm) coated with type I collagen and is specifically designed for quantitative analysis of platelet thrombus formation, including platelet adhesion and aggregation, granule secretion, and thrombus growth ‘in the absence of coagulation and fibrinolysis systems’. In measurements using the PL-chip, a blood sample collected in a hirudin-containing blood sampling tube (MP0600 [Verum Diagnostica]; final concentration 25 µg/mL) is applied to the analytical path of the PL-chip under constant flow. The platelet aggregates gradually increase in size and, in the process, occlude the capillary, resulting in an increase in flow pressure. In the present study, total platelet-derived thrombogenicity is expressed as the area under the flow-pressure curve for the first 10 min for the PL-chip tested at a flow rate of 18 µL/min (PL18-AUC10).
The AR-chip contains a single capillary channel (width 300 µm; depth 80 µm) coated with type I collagen and tissue thromboplastin, and is specifically designed for quantitative analysis of the white thrombus formation mediated by the activation of ‘both platelets and coagulation system’ under flow conditions. The blood sample (480 µL), collected into plastic tubes containing 3.2% sodium citrate, is mixed with 20 μL of 0.3 mol/L CaCl2
(VP-CA050K70; Venoject II; Terumo). The flow of blood through the analytical path of the AR-chip results in activation of the platelets and coagulation system on the surface of collagen and tissue thromboplastin, respectively. Thrombi consisting of activated platelets and fibrin fibers become larger, eventually occluding the capillary, which results in a gradual increase in flow pressure. Total thrombogenicity is expressed as the area under the flow-pressure curve for the first 30 min for the AR-chip tested at a flow rate of 10 µL/min (AR10-AUC30). Low PL18-AUC10
or AR10-AUC30
levels presumably reflect reduced thrombus growth and rapid breakdown of the thrombus.13
VerifyNow System
The VerifyNow P2Y12
test measures ADP-induced platelet aggregation. A blood sample is collected into a Greiner blood collection tube (GP-CD018) containing 3.2% sodium citrate. The whole blood citrate mixture is added to the VerifyNow P2Y12
cartridge, and the agglutination between the platelets and the fibrinogen-coated beads is recorded. The results are reported in PRU. In the present study, HTPR was defined as PRU >208.6
In a similar manner, the VerifyNow Aspirin Test contains arachidonic acid to activate the platelets and measure the antiplatelet effect of aspirin. The results of the VerifyNow Aspirin Test are reported as aspirin reaction units (ARU). In the present study, aspirin resistance was defined as ARU >550.15
Enzyme Infarct Size
Blood samples were obtained on admission and at 3-h intervals until the identification of peak levels of biomarkers of myocardial necrosis, and then daily until discharge. Peak levels of creatine kinase (CK) and CK-myocardial band (CK-MB), as well as areas under the curve for CK and CK-MB concentrations (AUCCK
and AUCCK-MB, respectively) over the initial 72 h, as calculated by the linear trapezoidal method,16
were derived.
Angiographic Analysis
Coronary angiography was performed with a frame rate of 15/s. Thrombolysis in Myocardial Infarction (TIMI) flow grade and TIMI thrombus grade were assessed on the initial coronary angiograms (prior to wire crossing), and TIMI flow grade and corrected TIMI frame count (CTFC) were evaluated on the final angiogram after PPCI, as described previously.17–19
A high thrombus burden was defined as TIMI thrombus grade 4 or 5. Slow-flow phenomenon was defined as TIMI flow grade of 1 or 2, and no-reflow phenomenon was defined as TIMI flow grade 0 in the absence of mechanical obstruction on the angiogram immediately after revascularization (balloon dilatation or stent deployment).
Statistical Analysis
The parameters of the T-TAS and VerifyNow systems are reported as median values (interquartile range) and were compared using the Mann-Whitney U-test. The Wilcoxon signed-rank test was used for comparisons of serial measurements of each parameter of the platelet function tests. Spearman’s rank correlation coefficients were used to investigate associations between enzymatic infarct size and each parameter of the T-TAS and VerifyNow systems. According to the strongest correlation factor (i.e., PL18-AUC10), patients were divided into 2 groups (High and Low PL18-AUC10).
Continuous variables are reported as the mean±SD and were compared using Student’s t-test. Categorical variables are reported as frequencies and percentages and were compared with the Chi-squared test. The association between slow-flow/no-reflow phenomenon and PL18-AUC10
level during PPCI was analyzed by multivariate logistic regression analysis, including initial TIMI grade 0 or 1 flow. Associations between enzymatic infarct size and PL18-AUC10, PRU, and various clinical features were analyzed by univariate and multivariate regression analyses. A multivariate regression model was designed to study independent predictors of AUCCK
and AUCCK-MB
using variables with P<0.10 in univariate analysis. P<0.05 was considered significant. Data were analyzed using JMP Pro12 (SAS Institute, Cary, NC, USA).
Results
Of 336 consecutive patients with STEMI undergoing PPCI between September 2014 and September 2018, 209 patients were excluded from the present study. The remaining 127 patients (104 men (82%); mean age 64.1 years) were included in this study (Figure 1). The door-to-device time was 58±25 min and the onset-to-device time was 184±139 min; 94% of patients received a loading dose of aspirin, whereas the remaining 6% were already on a maintenance dose of aspirin. All patients received a loading dose of either prasugrel (73%) or clopidogrel (27%). The rate of initial TIMI flow grade 0 was 56%. In approximately half the cases, the left anterior descending artery (LAD) was the infarct-related artery. Among 127 the patients undergoing PPCI, 9 received other intravenous drugs (argatroban in 6 patients, monteplase in 3 patients) during the procedure as bailout therapy for high thrombus burden and other thrombotic complications.
Serial Changes in Parameters of T-TAS and the VerifyNow System
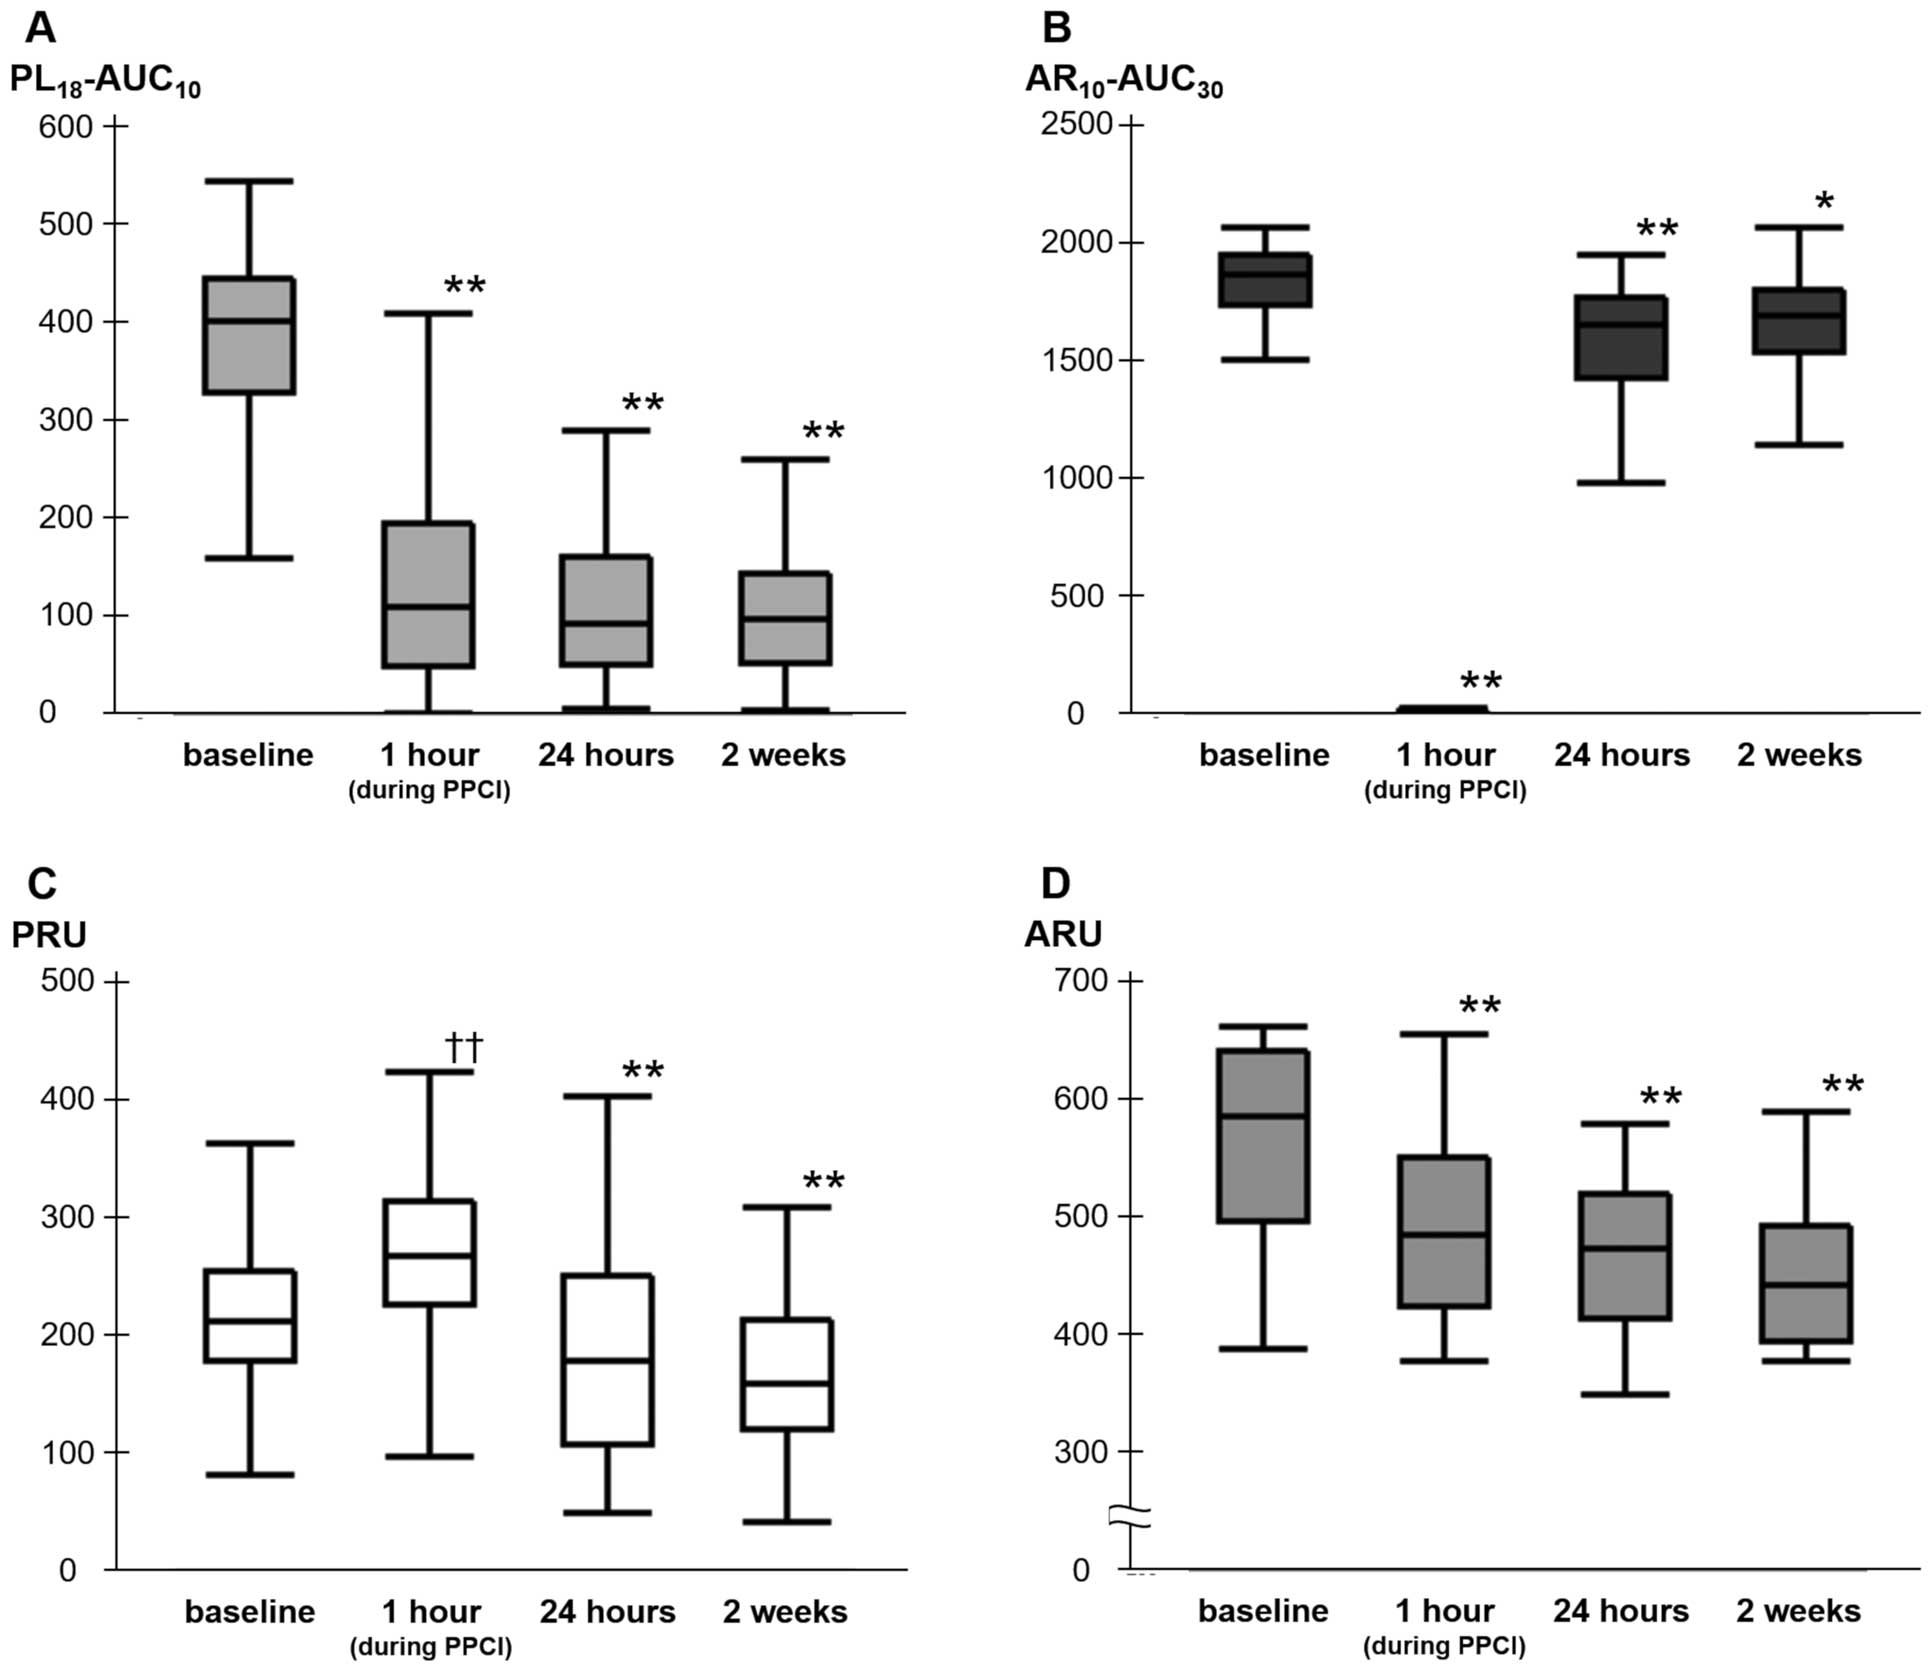
PL18-AUC10
levels decreased significantly from baseline to 1 h (during PPCI), 24 h, and 2 weeks after loading (402 [329–445] vs. 110 [49–195], 94 [50–161], and 97 [53–145], respectively; P<0.0001;
Figure 2A). Compared with baseline, AR10-AUC30
levels during PPCI were significantly lower (1,865 [1,737–1,952] vs. 10 [8–16]; P<0.0001). Although AR10-AUC30
levels increased after PPCI, the levels at 24 h and 2 weeks after loading were lower than those at baseline (1,865 [1,737–1,952] vs. 1,654 [1,427–1,770] and 1,690 [1,538–1,802], respectively; P<0.0001 and P=0.0027, respectively;
Figure 2B). Conversely, PRU levels were significantly higher during PPCI compared with baseline (266 [225–313] vs. 211 [177–254]; P<0.0001). The proportion of patients with HTPR during PPCI was extremely high (81%), although PRU levels during PPCI were lower in patients on prasugrel than clopidogrel therapy (258 [216–311] vs. 299 [257–320]; P=0.018). PRU levels at 24 h and 2 weeks after loading were significantly lower than at baseline (178 [106–249] and 158 [119–212] vs. 211 [177–254], respectively; P=0.0005 and P<0.0001, respectively;
Figure 2C). ARU levels were measured in 48 patients who had not used aspirin previously and had been hospitalized between February 2017 and September 2018. Unlike PRU levels, ARU levels decreased significantly from baseline to during PPCI (620 [555–648] vs. 491 [427–557]; P<0.0001;
Figure 2D). The proportion of patients with aspirin resistance during PPCI was 25%.
Investigations of associations between enzymatic infarct size and each parameter of the T-TAS and VerifyNow systems revealed that PL18-AUC10
levels during PPCI had the strongest positive correlation with the AUCCK
(r=0.27, P=0.0023;
Supplementary Figure). Therefore, patients were divided into 2 groups according to the median PL18-AUC10
level during PPCI: the High PL18-AUC10
group (PL18-AUC10
>110; n=64) and Low PL18-AUC10
group (PL18-AUC10
≤110; n=63), with median PL18-AUC10
values of 191 (143–259) and 49 (18–88), respectively (Figure 1). There were no significant differences between groups in clinical features at baseline (except for younger age and greater body weight in the High PL18-AUC10
group), medications on admission, initial TIMI flow grade, and infarct-related artery (Table 1). In addition, there were no significant differences in percutaneous coronary intervention (PCI) between the 2 groups (Table 1). PRU levels during PPCI were suboptimal and similar in the High and Low PL18-AUC10
groups (266 [231–311] vs. 272 [217–317], respectively; P=0.95). The percentage of final TIMI flow grade 3 was lower (75% vs. 90%, P=0.021), higher CTFC (31.3±2.5 vs. 21.0±2.6; P=0.005) and the incidence of slow-flow/no-reflow phenomenon higher (31% vs. 11%; P=0.0055) in the High compared with Low PL18-AUC10
group (Table 2). Multivariate logistic regression analysis identified a high PL18-AUC10
level during PPCI (PL18-AUC10
>110; odds ratio [OR] 3.75; 95% confidence interval [CI] 1.45–10.7; P=0.0058) as a significant and independent predictor of the slow-flow/no-reflow phenomenon, as well as initial TIMI grade 0 or 1 flow (OR 16.4; 95% CI 3.19–300; P=0.00011). There was no significant difference in the slow-flow/no-reflow phenomenon between the HTPR and non-HTPR groups (19% vs. 33%, respectively; P=0.13;
Table 3).
Table 1.
Baseline Demographics
| |
High PL18-AUC10
(n=64) |
Low PL18-AUC10
(n=63) |
P-value |
| Clinical |
| Age (years) |
61.3±1.5 |
66.9±1.6 |
0.013 |
| Male sex |
56 (88) |
48 (76) |
0.1 |
| Weight (kg) |
70.7±1.7 |
65.1±1.8 |
0.025 |
| BMI (kg/m2) |
25.4±0.5 |
24.3±0.5 |
0.13 |
| Hypertension |
35 (55) |
41 (65) |
0.23 |
| Diabetes |
28 (44) |
24 (38) |
0.52 |
| Dyslipidemia |
40 (63) |
34 (54) |
0.33 |
| Renal insufficiency |
18 (28) |
22 (35) |
0.41 |
| Current smoker |
34 (53) |
26 (41) |
0.18 |
| Prior MI |
3 (5) |
6 (10) |
0.29 |
| Atrial fibrillation |
2 (3) |
1 (2) |
0.57 |
| Medications on admission |
| Aspirin |
5 (8) |
6 (10) |
0.73 |
| Statin |
8 (13) |
13 (21) |
0.22 |
| ACEI/ARB |
17 (27) |
20 (32) |
0.52 |
| β-blocker |
1 (2) |
4 (6) |
0.17 |
| Antidiabetic drug |
11 (17) |
11 (17) |
0.97 |
| Oral anticoagulant |
1 (2) |
1 (2) |
0.99 |
| Killip Class ≥II |
8 (13) |
7 (11) |
0.81 |
| Treatment time (min) |
| Door-to-device time |
55.5±3.2 |
59.5±3.2 |
0.38 |
| Onset-to-device time |
173.3±17.6 |
194.1±17.6 |
0.4 |
| Loading of antiplatelet drugs |
| Aspirin |
61 (95) |
58 (92) |
0.45 |
| P2Y12 inhibitor |
|
|
0.96 |
| Prasugrel |
47 (73) |
46 (73) |
|
| Clopidogrel |
17 (27) |
17 (27) |
|
| Angiographic (pre-PCI) |
| Initial TIMI flow grade |
|
|
0.82 |
| Grade 0 |
39 (61) |
34 (54) |
|
| Grade 1 |
7 (11) |
8 (13) |
|
| Grade 2 |
15 (23) |
16 (25) |
|
| Grade 3 |
3 (5) |
5 (8) |
|
| TIMI thrombus grade |
|
|
0.18 |
| Grade 0 |
1 (2) |
3 (5) |
|
| Grade 1 |
4 (6) |
10 (16) |
|
| Grade 2 |
6 (9) |
7 (11) |
|
| Grade 3 |
12 (19) |
5 (8) |
|
| Grade 4 |
2 (3) |
4 (6) |
|
| Grade 5 |
39 (61) |
34 (54) |
|
| Infarct-related artery |
|
|
0.58 |
| LAD |
35 (55) |
31 (49) |
|
| LCX |
6 (9) |
4 (6) |
|
| RCA |
23 (36) |
27 (43) |
|
| LMT |
0 (0) |
1 (2) |
|
| PCI procedure |
| Intravenous agent |
| Heparin dose (units/kg) |
121.6±3.6 |
123.4±3.6 |
0.59 |
| Argatroban use |
3 (5) |
3 (5) |
0.98 |
| Monteplase use |
3 (5) |
0 (0) |
0.082 |
| Stent implantation |
|
|
0.49 |
| Not stented |
7 (11) |
7 (11) |
|
| BMS |
2 (3) |
5 (8) |
|
| DES |
55 (86) |
51 (81) |
|
| Total stent length (mm) |
24.7±1.1 |
24.7±1.2 |
0.96 |
| Mean stent size (mm) |
3.42±0.06 |
3.42±0.06 |
0.95 |
| Direct stenting |
15 (23) |
15 (24) |
0.96 |
| Thrombectomy |
43 (67) |
37 (59) |
0.32 |
| Distal filter protection |
2 (3) |
3 (5) |
0.64 |
| IABP |
4 (6) |
1 (2) |
0.18 |
| Morphine use |
12 (19) |
9 (14) |
0.5 |
Data are shown as the mean±SD or n (%). Renal insufficiency was defined as estimated glomerular filtration rate on admission ≤60 mL/min/1.73 m2. ACEI, angiotensin-converting enzyme inhibitor; ARB, angiotensin II receptor blocker; BMI, body mass index; BMS, bare-metal stent; DES, drug-eluting stent; IABP, intra-aortic balloon pump; LAD, left anterior descending artery; LCX, left circumflex artery; LMT, left main trunk; MI, myocardial infarction; PCI, percutaneous coronary intervention; PL18-AUC10, area under the flow-pressure curve for the first 10 min for the PL-chip tested at a flow rate of 18 μL/min; PPCI, primary percutaneous coronary intervention; RCA, right coronary artery.
Table 2.
Post-PCI Angiographic Findings and Enzymatic Infarct Size According to the PL
18-AUC
10 During Primary PCI
| |
High PL18-AUC10
(n=64) |
Low PL18-AUC10
(n=63) |
P-value |
| Angiographic (post-PCI) |
| Final TIMI flow grade |
|
|
0.021 |
| Grade 2 |
16 (25) |
6 (10) |
|
| Grade 3 |
48 (75) |
57 (90) |
|
| CTFC after PCI |
31.3±2.5 |
21.0±2.6 |
0.005 |
| Slow-flow/no-reflow |
20 (31) |
7 (11) |
0.0055 |
| Enzymatic infarct size |
| Peak CK (IU/L) |
3,456±294 |
2,041±296 |
0.0009 |
| Peak CK-MB (IU/L) |
298±27 |
214±27 |
0.027 |
| AUCCK (IU/L/h) |
95,231±7,275 |
62,239±7,333 |
0.0018 |
| AUCCK-MB (IU/L/h) |
6,735±523 |
5,029±527 |
0.023 |
Data are given as the mean±SD or n (%). AUCCK, area under the curve for creatine kinase (CK); AUCCK-MB, area under the curve for CK-myocardial band (CK-MB); CTFC, corrected Thrombolysis in Myocardial Infarction (TIMI) frame count; PCI, percutaneous coronary intervention; PL18-AUC10, area under the flow-pressure curve for the first 10 min for the PL-chip tested at a flow rate of 18 μL/min; PPCI, primary PCI.
Table 3.
Post-PCI Angiographic Findings and Enzymatic Infarct Size According to HTPR (PRU >208) During PPCI
| |
HTPR
(n=99) |
Non-HTPR
(n=24) |
P-value |
| Angiographic (post-PCI) |
| Final TIMI flow grade |
|
|
0.31 |
| Grade 2 |
16 (16) |
6 (25) |
|
| Grade 3 |
83 (84) |
18 (75) |
|
| CTFC after PCI |
26.7±2.1 |
26.5±4.3 |
0.96 |
| Slow-flow/no-reflow |
19 (19) |
8 (33) |
0.13 |
| Enzymatic infarct size |
| Peak CK (IU/L) |
2,731±249 |
2,951±506 |
0.7 |
| Peak CK-MB (IU/L) |
255±22 |
270±45 |
0.77 |
| AUCCK (IU/L/h) |
78,009±6,113 |
81,086±12,416 |
0.82 |
| AUCCK-MB (IU/L/h) |
5,905±434 |
6,052±880 |
0.88 |
Data are given as the mean±SD or n (%). HTPR, high on-treatment platelet reactivity; PRU, P2Y12 reaction units. Other abbreviations as in Table 2.
Enzymatic infarct size was higher in the High than Low PL18-AUC10
group (Table 2), whereas there was no significant difference in enzymatic infarct size between the HTPR and non-HTPR groups (Table 3). Multivariate regression analysis showed that a high PL18-AUC10
level during PPCI was a significant and independent factor affecting AUCCK, as well as initial TIMI flow grade 0 or 1 and TIMI thrombus grade 4 or 5 (Table 4). Multivariate regression analysis of determinants of the AUCCK-MB
indicated that a high PL18-AUC10 level during PPCI tended to be a predictor, but was not a significant and independent factor (Supplementary Table).
Table 4.
Results of Univariate and Multiple Regression Analysis for Determinants of the AUC
CK Levels
| Variable |
Univariate |
Multivariate (Model 1) |
Multivariate (Model 2) |
| r |
P-value |
β |
P-value |
β |
P-value |
| PL18-AUC10 during PPCIA |
0.26 |
0.0028 |
0.29 |
0.0006 |
0.27 |
0.0011 |
| PRU during PPCI |
−0.16 |
0.08 |
−0.061 |
0.47 |
−0.099 |
0.22 |
| Age |
−0.13 |
0.14 |
|
|
|
|
| Male sex |
0.10 |
0.26 |
|
|
|
|
| Hypertension |
−0.025 |
0.78 |
|
|
|
|
| Diabetes |
−0.040 |
0.67 |
|
|
|
|
| Dyslipidemia |
0.032 |
0.72 |
|
|
|
|
| Renal insufficiency |
−0.10 |
0.26 |
|
|
|
|
| Current smoker |
0.016 |
0.85 |
|
|
|
|
| Onset-to-device time |
−0.053 |
0.56 |
|
|
|
|
| LAD culprit lesion |
0.070 |
0.44 |
|
|
|
|
| Initial TIMI flow Grade 0 or 1 |
0.38 |
<0.0001 |
0.37 |
<0.0001 |
|
|
| TIMI thrombus Grade 4 or 5 |
0.40 |
<0.0001 |
|
|
0.38 |
<0.0001 |
AData for this parameter were divided into 2 groups according to the median value. Abbreviations as in Table 1–3.
Discussion
The unique aspect of the present study was the use of 2 systems to evaluate platelet function during the acute phase of STEMI. The serial changes in platelet function differed between the T-TAS and VerifyNow systems. Whereas PRU levels during PCI increased from baseline and were suboptimal (HTPR during PPCI: 81%), PL18-AUC10
levels measured by T-TAS were lower during PPCI compared with baseline. To the best of our knowledge, this is the first study to investigate the association between platelet-derived thrombogenicity during PPCI measured by T-TAS and infract size in patients with STEMI. Platelet aggregation in the acute phase of STEMI is extremely high despite antiplatelet treatment,20
and increased residual platelet aggregation is associated with a high risk of cardiovascular events after PPCI.21,22
However, few studies have focused on the effect of platelet-derived thrombogenicity during PPCI on the outcomes of STEMI. The results of this study show that high PL18-AUC10
during PPCI is associated with large enzymatic infarct size. These results suggest that PL18-AUC10
may be a suitable marker of platelet-derived thrombogenicity during PPCI in STEMI patients. T-TAS can allow for the evaluation of total platelet-derived thrombogenicity even during the acute phase of STEMI, a period characterized by a complex chain of events (e.g., hemodynamic instability, inflammation, sympathetic stimulation, and the use of various antithrombotic agents;
Figure 3). It has been reported previously that T-TAS is suitable for assessing platelet-derived thrombogenicity in patients with coronary artery disease on various forms of antiplatelet therapy.23,24

In the present study, a high PL18-AUC10
during PPCI was associated with impaired reperfusion, in addition to a large infarct size. A high PL18-AUC10
during PPCI may not merely represent high platelet-derived thrombogenicity, but may also reflect coronary microvascular obstruction, as represented by the slow-flow/no-reflow phenomenon. Although coronary microvascular obstruction is multifactorial, mechanical crushing and fragmentation of vulnerable plaques is an important factor for the no-reflow phenomenon because it can cause distal embolization and platelet aggregation in the microvasculature.25,26
Microvascular obstruction by platelet aggregation itself is an important factor for the no-reflow phenomenon.27
Plasma concentrations of thromboxane A2, a mediator of platelet activation and aggregation, measured on admission are an independent marker of the no-reflow phenomenon after PPCI in STEMI patients.28
In contrast, the results of the present study showed no significant differences in impaired reperfusion and infarct size between HTPR and non-HTPR patients during PPCI. A previous study in patients with STEMI demonstrated that pre-PCI HTPR at approximately 1 h after loading of P2Y12
receptor inhibitors is associated with lower pre-PCI coronary patency and worse post-PCI coronary reperfusion.29
This raises the question as to why PRU during PPCI was not associated with impaired reperfusion and infarct size in the present study. Although the present study did not directly investigate this issue, there are several possible reasons. First, the pathway through the ADP receptor is just one of many mechanisms of action on platelet activation and aggregation. PRU levels were determined to be suboptimal in both the High and Low PL18-AUC10
groups. Decreased levels of PL18-AUC10
during PPCI may be explained by the effect of adjunct therapy with fast-acting antithrombotic agents, including aspirin and unfractionated heparin. In the present study, in contrast with PRU, ARU during PPCI decreased. Extremely low levels of AR10-AUC30
during PPCI may primarily be due to unfractionated heparin because the AR-chip is designed for the assessment of thrombogenicity including the coagulation system. Second, the onset of action of P2Y12
inhibitors is delayed in the setting of STEMI, and the effect is insufficient at the time of PPCI.30,31
In the present study, prasugrel provided lower PRU levels during PPCI than clopidogrel; however, PRU levels during PPCI were suboptimal in both therapy groups. The blood sampling timing (i.e., at the time of PPCI) may be too early to detect the effect of the loading of oral prasugrel and clopidogrel. Third, the action of P2Y12
inhibitors may be influenced by complex conditions including elevated inflammation and sympathetic stimulation in the acute phase of STEMI. In response to sympathetic stimulation, platelet α2A-adrenergic receptors not only directly promote platelet aggregability, but also mutually amplify the aggregation response with P2Y12
receptors.32
In the present study, blood sampling 1 h after loading of P2Y12
receptor inhibitors was performed at the time of PPCI (just after stent implantation in 80.3% of cases), not before the PPCI. As a result, PCI procedure-related platelet activation may have affected the results of platelet function tests during PPCI.
In patients with a high PL18-AUC10
during PPCI, more potent antithrombotic therapy may be effective in reducing infarct size. In the setting of STEMI, abnormal muscular activity of the gastrointestinal tract, nausea, and vomiting are important factors delaying the onset of action of antiplatelet drugs.33
Therefore, intravenous agents may be a better therapeutic strategy to overcome heightened platelet reactivity during the several hours after the onset of STEMI. GP IIb/IIIa inhibitors can reduce infarct size in STEMI.34
Cangrelor has also been expected to improve clinical outcomes.35
It has been recently reported that cangrelor produces potent PRU-based P2Y12
inhibition even at the time of PPCI, although coronary microvascular function and infarct size are not improved.36
Moreover, crushed P2Y12
inhibitor tablets may be effective in reducing platelet-derived thrombogenicity during PPCI. The administration of crushed prasugrel or ticagrelor resulted in faster platelet inhibition compared with ingestion of the whole tablet in the setting of STEMI.30,37
However, it is unclear whether more potent antithrombotic therapy based on PL18-AUC10
levels leads to a reduction in infarct size. The pathological state of myocardial cell death may start to occur after disruption of microvessels, such as with the no-reflow phenomenon.38
In subjects in whom myocardial cell necrosis rapidly progresses after coronary artery occlusion, sufficient myocardial salvage may not be accomplished by T-TAS-based tailored antithrombotic therapy, even when applied during the golden hour (i.e., within the first 60 min after STEMI).
Regarding baseline characteristics, patients in the High PL18-AUC10
group were younger and heavier. Obese adipose tissue amplifies the secretion of proinflammatory cytokines and chemokines, leading to platelet activation.39
Intensive antithrombotic therapy may be effective for young patients with greater body weight; however, adjustment of drug doses based on body weight remains controversial with regard to bleeding risk due to overdose.39
Further detailed analysis is necessary to assess the factors affecting PL18-AUC10
during PPCI.
The present study has several limitations. First, the sample size was too small to evaluate clinical outcomes. Second, there was a lack of T-TAS data because there were no staff available to take measurements at night. Third, newer P2Y12
inhibitors, such as ticagrelor and cangrelor, were not used in the present study. In Japan, ticagrelor can be used only for patients with acute coronary syndrome only when there are problems administering the other P2Y12
inhibitors (i.e., clopidogrel or prasugrel) because of side effects. Therefore, no patients in the present study received ticagrelor. In addition, at the time of the study, cangrelor was not approved for use in Japan. Fourth, cardiac magnetic resonance imaging was not used to evaluate infarct size. Fifth, the present study was not designed to evaluate whether monitoring-guided antithrombotic therapy with T-TAS was beneficial. Further studies are needed to assess the effects of PL18-AUC10-guided strategies on clinical outcomes.
In conclusion, the serial changes in PL18-AUC10
measured by T-TAS were different from those of PRU measured by the VerifyNow System in STEMI patients undergoing PPCI. A high PL18-AUC10
during PPCI was associated with impaired reperfusion and large infarct size, but not PRU, during PPCI.
Acknowledgments
The authors express their gratitude to the physicians and paramedics who participated in this study, especially Takako Matsushita and Yuko Oda.
Sources of Funding
No funding supported the present work.
Conflict of Interest
The authors declare no conflicts of interest.
Supplementary Files
Please find supplementary file(s);
http://dx.doi.org/10.1253/circj.CJ-19-1043
References
- 1.
Ibanez B, James S, Agewall S, Antunes MJ, Bucciarelli-Ducci C, Bueno H, et al. 2017 ESC Guidelines for the management of acute myocardial infarction in patients presenting with ST-segment elevation: The Task Force for the management of acute myocardial infarction in patients presenting with ST-segment elevation of the European Society of Cardiology (ESC). Eur Heart J 2018; 39: 119–177.
- 2.
O’Gara PT, Kushner FG, Ascheim DD, Casey DE Jr, Chung MK, de Lemos JA, et al. 2013 ACCF/AHA guideline for the management of ST-elevation myocardial infarction: A report of the American College of Cardiology Foundation/American Heart Association Task Force on Practice Guidelines. Circulation 2013; 127: e362–e425.
- 3.
Franchi F, Rollini F, Angiolillo DJ. Antithrombotic therapy for patients with STEMI undergoing primary PCI. Nat Rev Cardiol 2017; 14: 361–379.
- 4.
Capodanno D, Alfonso F, Levine GN, Valgimigli M, Angiolillo DJ. ACC/AHA versus ESC guidelines on dual antiplatelet therapy: JACC guideline comparison. J Am Coll Cardiol 2018; 72: 2915–2931.
- 5.
Stone GW, Witzenbichler B, Weisz G, Rinaldi MJ, Neumann FJ, Metzger DC, et al. Platelet reactivity and clinical outcomes after coronary artery implantation of drug-eluting stents (ADAPT-DES): A prospective multicentre registry study. Lancet 2013; 382: 614–623.
- 6.
Price MJ, Angiolillo DJ, Teirstein PS, Lillie E, Manoukian SV, Berger PB, et al. Platelet reactivity and cardiovascular outcomes after percutaneous coronary intervention: A time-dependent analysis of the Gauging Responsiveness with a VerifyNow P2Y12 assay: Impact on Thrombosis and Safety (GRAVITAS) trial. Circulation 2011; 124: 1132–1137.
- 7.
Sibbing D, Aradi D, Alexopoulos D, Ten Berg J, Bhatt DL, Bonello L, et al. Updated expert consensus statement on platelet function and genetic testing for guiding P2Y12 receptor inhibitor treatment in percutaneous coronary intervention. JACC Cardiovasc Interv 2019; 12: 1521–1537.
- 8.
Price MJ, Berger PB, Teirstein PS, Tanguay JF, Angiolillo DJ, Spriggs D, et al. Standard- vs. high-dose clopidogrel based on platelet function testing after percutaneous coronary intervention: The GRAVITAS randomized trial. JAMA 2011; 305: 1097–1105.
- 9.
Trenk D, Stone GW, Gawaz M, Kastrati A, Angiolillo DJ, Muller U, et al. A randomized trial of prasugrel versus clopidogrel in patients with high platelet reactivity on clopidogrel after elective percutaneous coronary intervention with implantation of drug-eluting stents: Results of the TRIGGER-PCI (Testing Platelet Reactivity In Patients Undergoing Elective Stent Placement on Clopidogrel to Guide Alternative Therapy With Prasugrel) study. J Am Coll Cardiol 2012; 59: 2159–2164.
- 10.
Collet JP, Cuisset T, Range G, Cayla G, Elhadad S, Pouillot C, et al. Bedside monitoring to adjust antiplatelet therapy for coronary stenting. N Engl J Med 2012; 367: 2100–2109.
- 11.
Cayla G, Cuisset T, Silvain J, Leclercq F, Manzo-Silberman S, Saint-Etienne C, et al. Platelet function monitoring to adjust antiplatelet therapy in elderly patients stented for an acute coronary syndrome (ANTARCTIC): An open-label, blinded-endpoint, randomised controlled superiority trial. Lancet 2016; 388: 2015–2022.
- 12.
Hosokawa K, Ohnishi T, Kondo T, Fukasawa M, Koide T, Maruyama I, et al. A novel automated microchip flow-chamber system to quantitatively evaluate thrombus formation and antithrombotic agents under blood flow conditions. J Thromb Haemost 2011; 9: 2029–2037.
- 13.
Hosokawa K, Ohnishi T, Fukasawa M, Kondo T, Sameshima H, Koide T, et al. A microchip flow-chamber system for quantitative assessment of the platelet thrombus formation process. Microvasc Res 2012; 83: 154–161.
- 14.
Thygesen K, Alpert JS, Jaffe AS, Chaitman BR, Bax JJ, Morrow DA, et al. Fourth universal definition of myocardial infarction (2018). J Am Coll Cardiol 2018; 72: 2231–2264.
- 15.
Nielsen HL, Kristensen SD, Thygesen SS, Mortensen J, Pedersen SB, Grove EL, et al. Aspirin response evaluated by the VerifyNow Aspirin System and light transmission aggregometry. Thromb Res 2008; 123: 267–273.
- 16.
Vollmer RT, Christenson RH, Reimer K, Ohman EM. Temporal creatine kinase curves in acute myocardial infarction: Implications of a good empiric fit with the log-normal function. Am J Clin Pathol 1993; 100: 293–298.
- 17.
TIMI Study Group. The Thrombolysis in Myocardial Infarction (TIMI) trial: Phase I findings. N Engl J Med 1985; 312: 932–936.
- 18.
Gibson CM, de Lemos JA, Murphy SA, Marble SJ, McCabe CH, Cannon CP, et al. Combination therapy with abciximab reduces angiographically evident thrombus in acute myocardial infarction: A TIMI 14 substudy. Circulation 2001; 103: 2550–2554.
- 19.
Gibson CM, Cannon CP, Daley WL, Dodge JT Jr, Alexander B Jr, Marble SJ, et al. TIMI frame count: A quantitative method of assessing coronary artery flow. Circulation 1996; 93: 879–888.
- 20.
Funck-Jensen KL, Dalsgaard J, Grove EL, Hvas AM, Kristensen SD. Increased platelet aggregation and turnover in the acute phase of ST-elevation myocardial infarction. Platelets 2013; 24: 528–537.
- 21.
Krasopoulos G, Brister SJ, Beattie WS, Buchanan MR. Aspirin ‘resistance’ and risk of cardiovascular morbidity: Systematic review and meta-analysis. BMJ 2008; 336: 195–198.
- 22.
Brar SS, ten Berg J, Marcucci R, Price MJ, Valgimigli M, Kim HS, et al. Impact of platelet reactivity on clinical outcomes after percutaneous coronary intervention: A collaborative meta-analysis of individual participant data. J Am Coll Cardiol 2011; 58: 1945–1954.
- 23.
Arima Y, Kaikita K, Ishii M, Ito M, Sueta D, Oimatsu Y, et al. Assessment of platelet-derived thrombogenicity with the Total Thrombus-formation Analysis System in coronary artery disease patients receiving antiplatelet therapy. J Thromb Haemost 2016; 14: 850–859.
- 24.
Kaikita K, Hosokawa K, Dahlen JR, Tsujita K. Total Thrombus-Formation Analysis System (T-TAS): Clinical application of quantitative analysis of thrombus formation in cardiovascular disease. Thromb Haemost 2019; 19: 1554–1562.
- 25.
Topol EJ, Yadav JS. Recognition of the importance of embolization in atherosclerotic vascular disease. Circulation 2000; 101: 570–580.
- 26.
Endo M, Hibi K, Shimizu T, Komura N, Kusama I, Otsuka F, et al. Impact of ultrasound attenuation and plaque rupture as detected by intravascular ultrasound on the incidence of no-reflow phenomenon after percutaneous coronary intervention in ST-segment elevation myocardial infarction. JACC Cardiovasc Interv 2010; 3: 540–549.
- 27.
Heindl B, Zahler S, Welsch U, Becker BF. Disparate effects of adhesion and degranulation of platelets on myocardial and coronary function in postischaemic hearts. Cardiovasc Res 1998; 38: 383–394.
- 28.
Niccoli G, Giubilato S, Russo E, Spaziani C, Leo A, Porto I, et al. Plasma levels of thromboxane A2 on admission are associated with no-reflow after primary percutaneous coronary intervention. Eur Heart J 2008; 29: 1843–1850.
- 29.
Capranzano P, Capodanno D, Bucciarelli-Ducci C, Gargiulo G, Tamburino C, Francaviglia B, et al. Impact of residual platelet reactivity on reperfusion in patients with ST-segment elevation myocardial infarction undergoing primary percutaneous coronary intervention. Eur Heart J Acute Cardiovasc Care 2016; 5: 475–486.
- 30.
Rollini F, Franchi F, Hu J, Kureti M, Aggarwal N, Durairaj A, et al. Crushed prasugrel tablets in patients with STEMI undergoing primary percutaneous coronary intervention: The CRUSH Study. J Am Coll Cardiol 2016; 67: 1994–2004.
- 31.
Ichikawa S, Tsukahara K, Minamimoto Y, Kimura Y, Matsuzawa Y, Maejima N, et al. Pharmacodynamic assessment of platelet reactivity after a loading dose of prasugrel or clopidogrel in patients with ST-segment elevation myocardial infarction. Circ J 2016; 80: 2520–2527.
- 32.
Maayani S, Schwarz T, Craddock-Royal B, Tagliente TM. Activation of the alpha(2A)-adrenoceptor mediates deceleration of the deaggregation component of the response to ADP or 5-HT in human platelets in vitro. Platelets 2001; 12: 359–375.
- 33.
Heestermans AA, van Werkum JW, Taubert D, Seesing TH, von Beckerath N, Hackeng CM, et al. Impaired bioavailability of clopidogrel in patients with a ST-segment elevation myocardial infarction. Thromb Res 2008; 122: 776–781.
- 34.
Stone GW, Maehara A, Witzenbichler B, Godlewski J, Parise H, Dambrink JH, et al. Intracoronary abciximab and aspiration thrombectomy in patients with large anterior myocardial infarction: The INFUSE-AMI randomized trial. JAMA 2012; 307: 1817–1826.
- 35.
Franchi F, Rollini F, Rivas A, Wali M, Briceno M, Agarwal M, et al. Platelet inhibition with cangrelor and crushed ticagrelor in patients with ST-segment-elevation myocardial infarction undergoing primary percutaneous coronary intervention. Circulation 2019; 139: 1661–1670.
- 36.
Ubaid S, Ford TJ, Berry C, Murray HM, Wrigley B, Khan N, et al. Cangrelor versus ticagrelor in patients treated with primary percutaneous coronary intervention: Impact on platelet activity, myocardial microvascular function and infarct size: A randomized controlled trial. Thromb Haemost 2019; 119: 1171–1181.
- 37.
Parodi G, Xanthopoulou I, Bellandi B, Gkizas V, Valenti R, Karanikas S, et al. Ticagrelor crushed tablets administration in STEMI patients: The MOJITO study. J Am Coll Cardiol 2015; 65: 511–512.
- 38.
Kloner RA, Dai W. Glycoprotein IIb/IIIa inhibitors and no-reflow. J Am Coll Cardiol 2004; 43: 284–286.
- 39.
Rocca B, Fox KAA, Ajjan RA, Andreotti F, Baigent C, Collet JP, et al. Antithrombotic therapy and body mass: An expert position paper of the ESC Working Group on Thrombosis. Eur Heart J 2018; 39: 1672–1686f.


