Abstract
Background:
Plaque erosion (PE) has been considered a secondary pathogenesis of ST-segment elevated myocardial infarction (STEMI) following plaque rupture (PR). Previous studies demonstrated that they had different demographic and histology characteristics and need different treatment strategy. But there are few non-invasive plasma biomarkers for distinguishing them. The present study aimed to identify non-invasive predictive biomarkers for PE and PR in patients with STEMI.
Methods and Results:
A total 108 patients were recruited and grouped into a PE group (n=36), a PR group (n=36), and an unstable angina pectoris (UAP) (n=36) group for analysis. A 9-plex tandem mass tag (TMT)-based proteomics was used to compare plasma protein profiles of PE, PR, and UAP. In total, 36 significant differential proteins (DPs) were identified among groups, 10 of which were screened out using bio-information analysis and validated with enzyme-linked immunosorbent assay (ELISA). The relationship of angiography and optical coherence tomography (OCT) imaging data and the 10 target DPs was analyzed statistically. Logistic regression showed elevated collagen type VI α-2 chain (COL6A2) and insulin-like growth factor 1 (IGF1), and decreased fermitin family homolog 3 (FERMT3), were positively associated with PE. Multivariate analysis indicated IGF1, FERMT3, and COL6A2 had independent predictive ability for PE. IGF1 was inversely correlated with lumen stenosis and the lipid arc of the plaque.
Conclusions:
IGF1, COL6A2, and FERMT3 are potential predictive biomarkers of PE in STEMI patients. And IGF1 was negatively correlated with the developing of culprit plaque.
The incidence of coronary artery disease (CAD) remains high, representing a serious human health challenge.1
Acute myocardial infarction (AMI) is the primary factor responsible for CAD-related mortality. In recent decades, optical coherence tomography (OCT) has become a useful tool for identifying the coronary plaque that causes AMI in vivo, owing to its high resolution.2
Both in vitro pathology studies and in vivo OCT analyses have shown plaque erosion (PE) has been considered as a secondary pathogenesis of ST-segment elevated myocardial infarction (STEMI) following plaque rupture (PR).3–5
Moreover, accumulating evidence indicates the difference between PE and PR in many aspects, including pathological morphology6
that results in different treatments,7
as well as in the vulnerable population and predilection site,8
in addition to the associated inflammatory factors in the blood and coronary plaque.9,10
However, the mechanisms underlying the development of PR and PE from atherosclerosis remain unclear, and there is no standardised method for their identification in plasma. Moreover, as OCT is not always available, identification of non-invasive plasma biomarkers for distinguishing between PR and PE is important for appropriate intervention and risk stratification.
In the present study, we sought to identify PR- and PE-specific biomarkers using a high-throughput tandem mass tag (TMT)-based comparative proteomics profiling, a labelling technique that allows for the simultaneous precise, accurate and reproducible quantification of proteins across several samples,11
to compare the whole-protein spectrum of plasma samples from patients diagnosed with STEMI caused by PE or PR, and in patients with unstable angina pectoris (UAP). We further combined the results of TMT with those obtained by OCT to identify some main characteristic plasma biomarkers for differential diagnosis.
Methods
Participants and Study Groups
For this retrospective analysis, we collected some consecutive data from patients diagnosed with STEMI enrolled in the EROSION study.7
All patients who presented with chest pain and underwent first-time coronary angiography (CAG) for suspected UAP and STEMI were treated at the Second Affiliated Hospital of Harbin Medical University between June 2015 and March 2016. The original study was approved by the Ethics Committee of the Second Affiliated Hospital of Harbin Medical University (reference number KY2017-249), and the investigation conformed to the principles outlined in the Declaration of Helsinki; all patients provided written informed consent prior to inclusion in the study. Exclusion criteria included use of mechanical ventilation, cardiogenic shock, thrombus that could not be cleared, poor imaging, and severe liver or kidney dysfunction. Using previously established diagnostic criteria,3,7,12
all STEMI patients for analysis, including 36 with PE and 36 with PR, were consecutively recruited from the cohort investigated in the EROSION study. And 36 patients hospitalized for chest pain and diagnosed with UAP according to CAG imaging and other clinical data in our hospital were consecutively recruited to be a control group during the same period.
Blood Samples for Proteomics
Pre-operative blood samples were collected by using an arterial sheath at the start of percutaneous coronary intervention. Blood samples were collected in ethylenediaminetetraacetic acid tubes, and the separated plasma was stored at −80℃ until required for TMT-based comparative proteomic profiling and subsequent enzyme-linked immunoassay (ELISA) validation. TMT-based comparative proteomic profiling and pooled samples were applied in this experiment in order to save resources and ensure the consistency of experimental conditions.13
For TMT-based comparative proteomic profiling, 3 pooled plasma samples were prepared from each group (STEMI with PE, STEMI with PR, and UAP), per 12 plasmas was mixed into one pooled sample, for a total of 9 samples.
Clinical and Imaging Data
Baseline demographics, patient characteristics, laboratory data, and CAG data were recorded for all 108 patients. OCT data were recorded for the 72 patients with STEMI using the C7-XR OCT intravascular imaging system (OCT C7 Dragonfly; St. Jude Medical, St. Paul, MN, USA). Quantitative and qualitative analyses of underlying plaques were performed by 2 independent operators, as described in a previous study.8
Any discordance was resolved by consensus with a third reviewer.
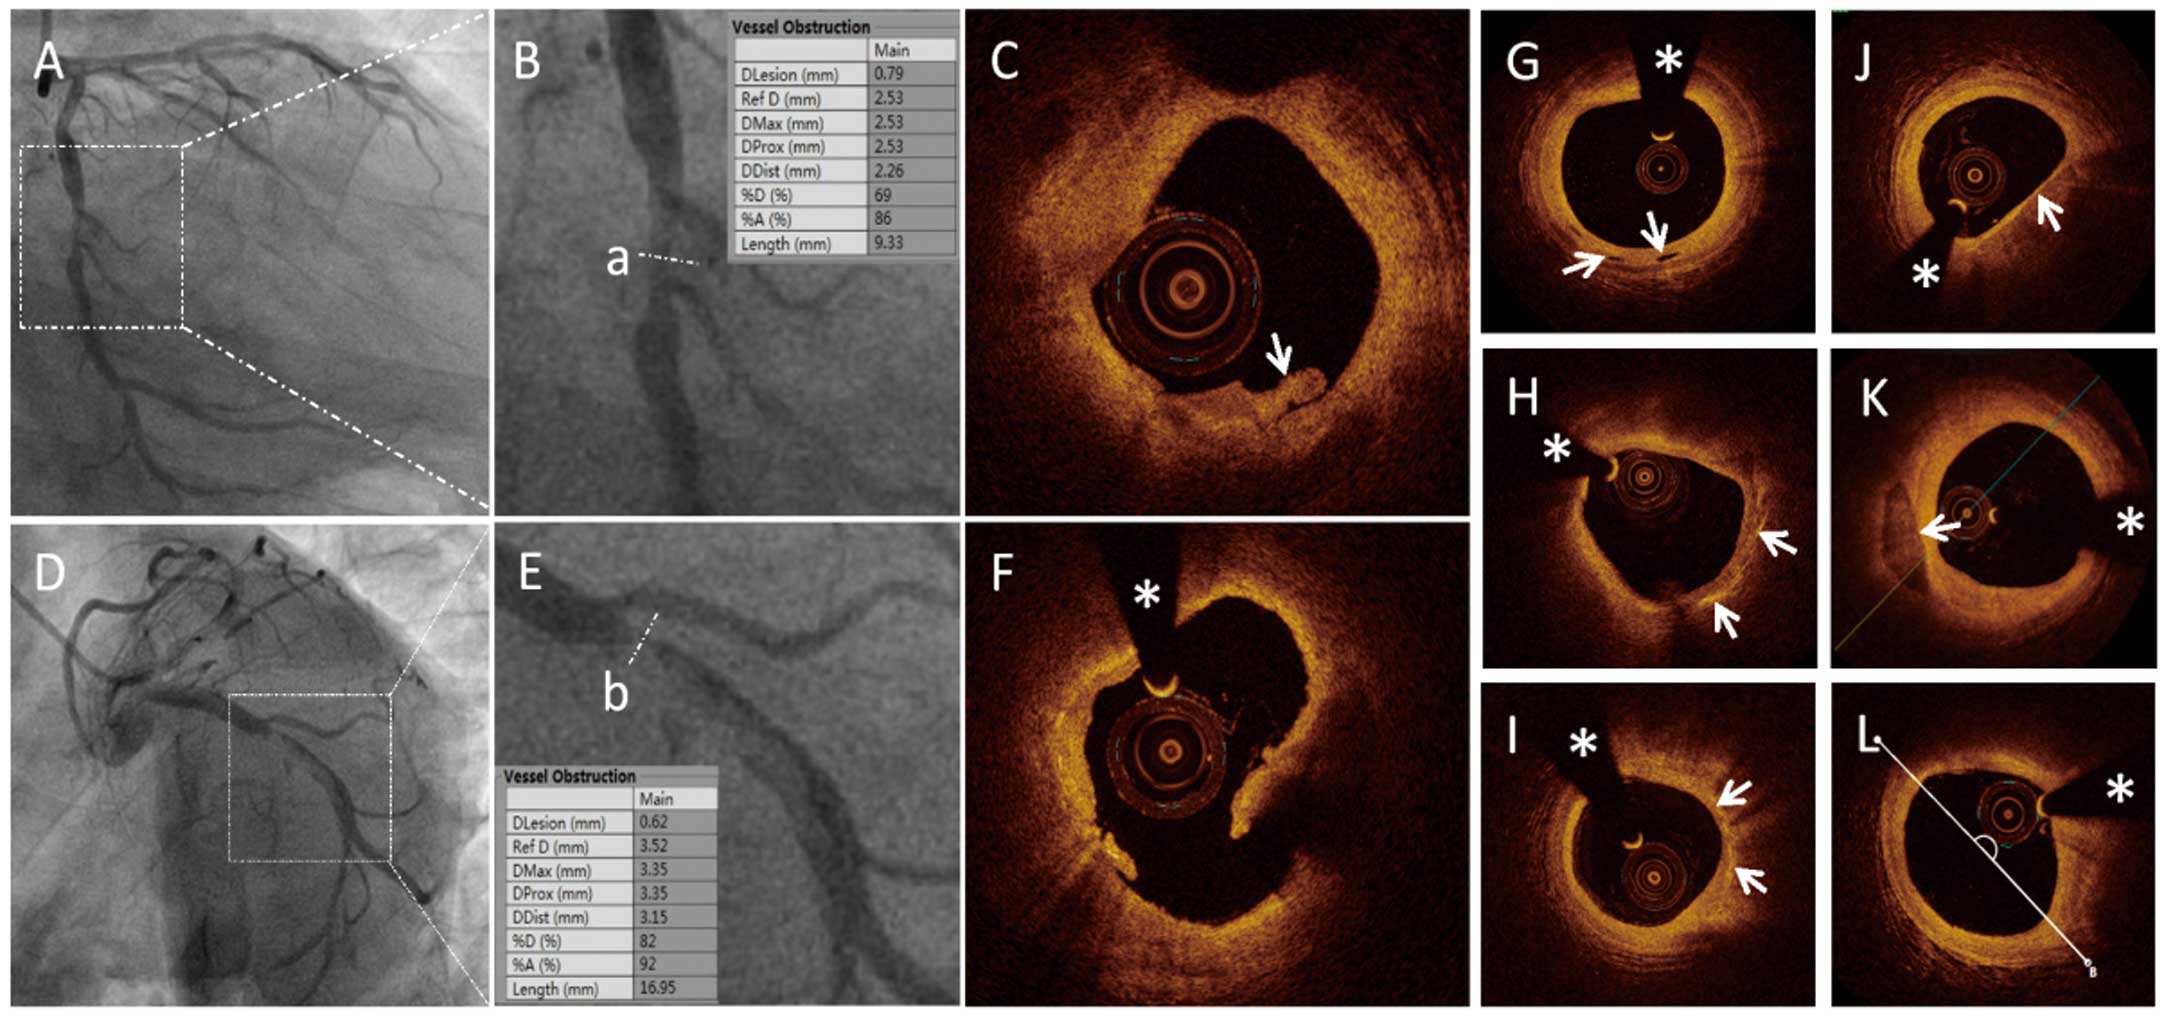
All patients underwent angiography examination. Quantitative coronary angiography (QCA) was performed using the Cardiovascular Angiography Analysis System (CAAS 5.10; Pie Medical Imaging B.V., Maastricht, the Netherlands). Culprit vessels and lesion sites were identified, and the length of the culprit lesions (LL), reference vessel diameter (RVD), minimal lesion diameter (MLD), and degree of diameter stenosis (DS%) were measured (Figure 1A,B,D,E).
The plaque and thrombus type were identified based on established OCT diagnostic criteria (Figure 1C,F), along with identification of microchannels, cholesterol crystals, thin-cap fibroatheroma (TCFA), macrophages, and spotty calcification (Figure 1G–K).3
The LL, minimal lumen area (MLA), minimal thickness of the fibrotic cap (FCT), length of the residual thrombus (TL), length of the lipid core (LCL), largest arc of the lipid core (LLA), and average arc of the lipid core (ALA) were measured, as described previously.14–16
(Figure 1L).
TMT Comparative Proteomic Profiling
After the protein content of each of the 9 pooled and high-abundance protein-depleted plasma samples was confirmed to be equal before trypsin digestion, a 9-plex TMT comparative proteomic profiling was processed (details in
Supplementary File) and further bioinformation analysis was performed. The Kyoto Encyclopedia of Genes and Genomes (KEGG) database was used to annotate the protein pathways. Subcellular localization was predicted using Wolfpsort (an updated version of PSORT/PSORT II for the prediction of eukaryotic sequences). For each category, a 2-tailed Fisher’s exact test was used to test the enrichment of the differentially expressed proteins (DPs) against all identified proteins. GO terms with a corrected P-value <0.05 were considered to be significantly enriched. The STRING database (version 11.0) was applied to determine the protein-protein interaction (PPI) network of the DPs.
ELISA
The target DPs with significantly more PPIs that were associated with a higher number of KEGG pathways related to atherogenesis were selected for further validation using ELISA kits (Cusabio, Wuhan, China) based on the double-antibody sandwich method according to the manufacturer’s instructions.
Statistical Analysis
Statistical analysis was performed with EmpowerStats and R software (www.empowerstats.com). Categorical data are presented as counts (proportions), whereas continuous variables are presented as mean±standard deviation or median values with the interquartile range (IQR). Inter-group baseline characteristics and clinical data were compared using the chi-squared test, Fisher’s exact test, and the one-way analysis of variance (ANOVA), with repeated measurements and Dunnett’s multiple comparison test or Student’s t-test or Kruskal-Wallis U test, as appropriate. Associations between plaque classification and candidate biomarkers validated by ELISA were evaluated using a logistic regression model. The area under the receiver operating characteristic (ROC) curve (AUC) was compared as a measure of diagnostic accuracy in the detection of plaque characteristics for candidate proteins. The least absolute shrinkage and selection operator (LASSO) method was used to identify the most useful predictive biomarkers among the candidates, and combined models were built along with traditional risk factors. The predictive ability was evaluated according to the ROC curve, calibration curve, and decision curve analysis (DCA). Spearman’s correlation coefficient was calculated to determine the correlation between candidate DPs and plaque morphological characteristics.
Results
Patient Characteristics
Baseline and clinical characteristic data for the enrolled participants are summarized in
Supplementary Table 1, and the CAG and OCT data are presented in
Supplementary Tables 2
and
3. The baseline and clinical characteristics of each group were consistent with our previous experimental results.8
Overall, the patients with PE were significantly different with those with PR in terms of age, gender, current smoker history of diabetes mellitus, hypertension, and dyslipidaemia.
TMT Comparative Proteomic Profiling and ELISA Validation
The TMT-based proteomics profile of the 3 groups identified a total of 749 proteins, 610 of which contained quantitative information and 376 showed prominent differential expressions. A total of 36 DPs were identified via pairwise comparison between groups under the criteria of a 1.2-fold change and Student’s t-test P-value <0.05 (Figure 2A). Among the 36 DPs, 5 were upregulated in the PE group compared to those with PR (Supplementary Figure 1A,B).
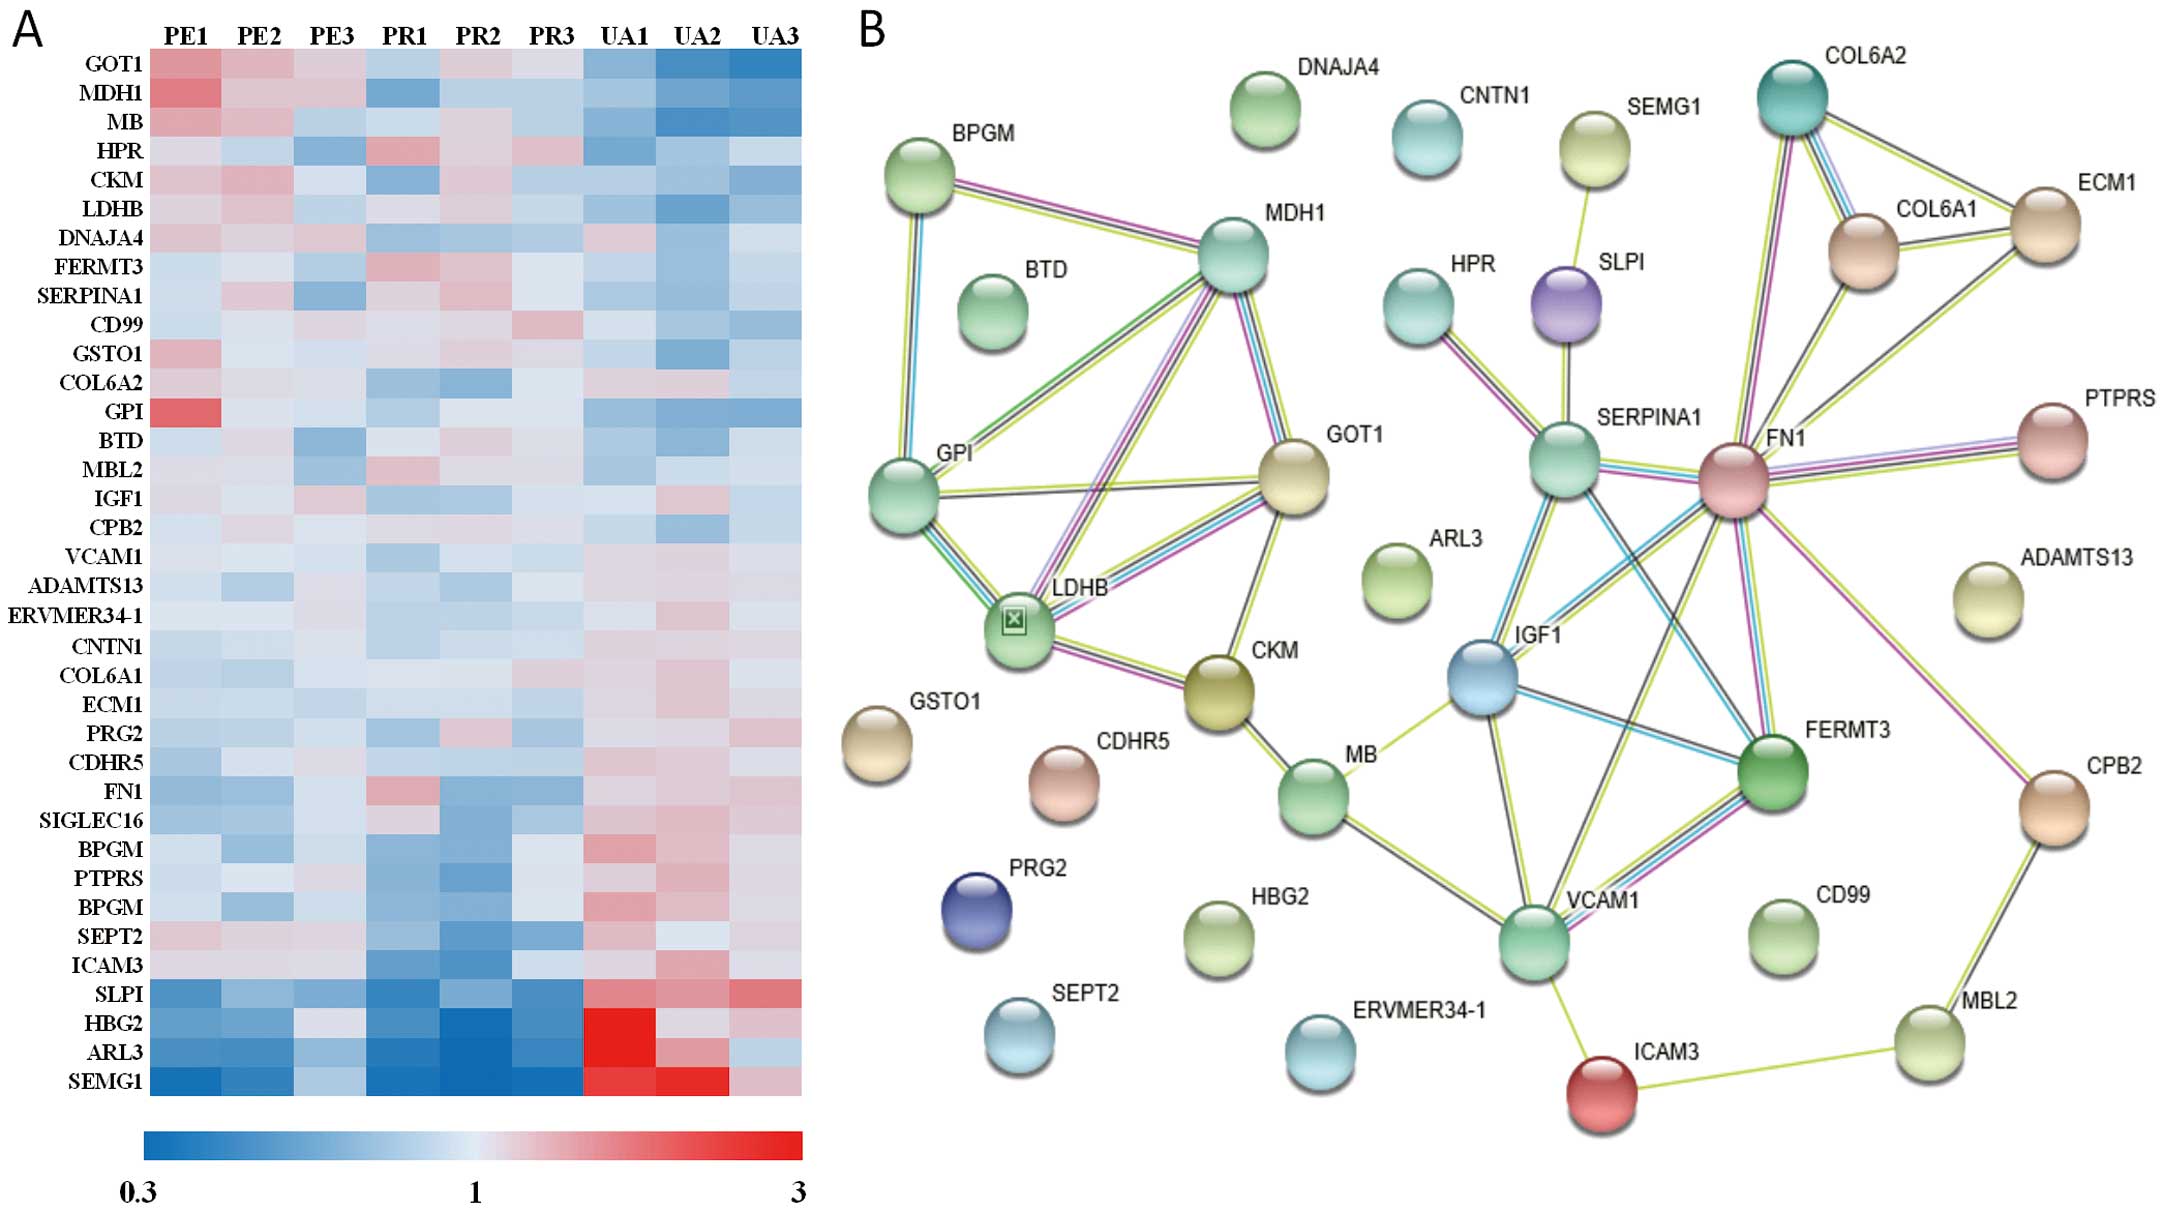
Go analysis presented changes of molecular function existed in catalytic activity, binding, and molecular function regulator. Subcellular location of the targeted DPs focused on cytoplasm and extracellular. KEGG analysis indicated that the major pathways accounting for the intergroup differences involved metabolism, PI3K-AKT signalling, focal adhesion, and extracellular matrix-receptor interaction (Supplementary Figure 1C). Further, STRING analysis indicated that the major intergroup differences involved the processes of cardiac metabolism, thrombosis, and cell matrix interactions (Figure 2B). Based on STRING and KEGG analysis, 13 candidate DPs were selected for further ELISA validation, 10 of which were found to be expressed at significantly different levels across the groups. Preliminary statistical analysis revealed the expression levels of insulin-like growth factor 1 (IGF1) and Fermitin family homolog 3 (FERMT3, kindlin-3) were significantly different between the PE and PR groups (Table 1).
Table 1.
Validated Differential Proteins by Enzyme-Linked Immunosorbent Assay (ELISA) Tests
| DPs |
PR
(n=36) |
PE
(n=36) |
UAP
(n=36) |
P value
(PE/PR) |
| IGF1 (ng/mL)‡ |
68.258±32.438 |
103.940±48.635 |
89.029±36.759 |
<0.001 |
| FERMT3 (ng/mL)‡ |
3,016.17 (1,837.60–5,447.89) |
2,013.15 (1,365.36–2,984.15) |
2,864.17 (1,714.15–3,445.08) |
0.026 |
| SEPT2 (pg/mL)* |
735.37 (515.13–1,016.40) |
654.63 (562.49–937.54) |
468.32 (382.77–606.24) |
0.582 |
| GOT1 (mU/mL)* |
43.58 (28.84–79.15) |
60.75 (52.21–100.26) |
39.93 (33.11–51.71) |
0.075 |
| MDH1 (mU/mL)* |
106.63 (66.47–145.58) |
87.57 (64.38–136.87) |
45.75 (37.31–62.30) |
0.783 |
| MB (ng/mL)* |
1,297.78 (257.11–2,252.48) |
785.28 (333.70–1,659.98) |
78.00 (78.00–78.00) |
0.606 |
| SERPINA1 (uIU/mL)* |
572.655±280.943 |
598.897±312.523 |
808.318±443.237 |
0.709 |
| FN1 (ug/mL) |
254.85 (250.36–263.87) |
260.71 (254.04–268.76) |
261.28 (247.80–267.82) |
0.422 |
| SLPI (ng/mL) |
148.31 (118.52–189.21) |
155.05 (123.17–200.71) |
157.26 (141.08–191.22) |
0.375 |
| COL6A2 (ng/mL) |
13.17 (10.36–16.47) |
16.89 (11.57–24.41) |
18.83 (12.22–24.76) |
0.061 |
Values are presented as mean±SD or Median (Q1–Q3). *P<0.05 when PE or PR compared with UAP; ‡P<0.05 when PE or PR compared with UAP. COL6A2, collagen-type IV α-2 chain; DP, differential protein; FERMT3, Fermitin family homolog 3; FN1, fibronectin 1; GOT1, Glutamic-oxaloacetic transaminase 1; IGF1, insulin-like growth factor 1; MB, myoglobin; MDH1, malate dehydrogenase; PE, plaque erosion; PR, plaque rupture; SEPT2, septin 2; SERPINA1, serpin family A member 1; SLPI, secretory leukocyte peptidase inhibitor; UAP, unstable angina pectoris.
Multivariate logistic regression showed that in the crude (unadjusted) model, continuous IGF1 expression was significantly and positively associated with PE, whereas continuous FERMT3 expression was significantly and negatively associated with PE. Dichotomous glutamic-oxaloacetic transaminase 1 (GOT1) expression was significantly and positively associated with PE. After adjusting for confounding factors, including age, sex, smoking status, diabetes mellitus, high-density lipoprotein cholesterol (HDL-C), and admission creatinine level, IGF1 and collagen, type VI, α-2 chain (COL6A2) were independently and positively associated with PE, and FERMT3 was independently and negatively associated with PE. Neither continuous nor dichotomous GOT1 expression was significantly associated with PE (Supplementary Figure 2,
Table 2). Therefore, IGF1 and FERMT3 were found to be more valuable markers in the independent prediction of plaque type.
Table 2.
Predictive Models for Plaque Erosion With Candidate Biomarkers by Logistics Regression Analysis
| Variables |
Crude model |
Adjusted model* |
| OR (95% CI) |
P value |
OR (95% CI) |
P value |
| IGF1 |
| Z score |
2.94 (1.51, 5.73) |
0.001 |
3.68 (1.55, 8.72) |
0.003 |
| Dichotomous |
4.55 (1.69, 12.25) |
0.003 |
5.23 (1.51, 18.15) |
0.009 |
| FERMT3 |
| Z score |
0.54 (0.30, 0.97) |
0.04 |
0.51 (0.26, 0.99) |
0.045 |
| Dichotomous |
0.36 (0.14, 0.93) |
0.035 |
0.24 (0.07, 0.81) |
0.022 |
| SEPT2 |
| Z score |
0.88 (0.57, 1.36) |
0.578 |
1.00 (0.59, 1.70) |
0.994 |
| Dichotomous |
0.89 (0.34, 2.31) |
0.808 |
0.76 (0.22, 2.59) |
0.658 |
| GOT1 |
| Z score |
1.52 (0.95, 2.42) |
0.081 |
1.29 (0.75, 2.21) |
0.354 |
| Dichotomous |
4.37 (1.57, 12.19) |
0.005 |
2.92 (0.85, 10.05) |
0.09 |
| MDH1 |
| Z score |
0.94 (0.63, 1.42) |
0.78 |
0.97 (0.60, 1.56) |
0.885 |
| Dichotomous |
0.88 (0.34, 2.34) |
0.805 |
0.75 (0.22, 2.54) |
0.643 |
| MB |
| Z score |
0.90 (0.59, 1.36) |
0.604 |
0.84 (0.45, 1.57) |
0.589 |
| Dichotomous |
1.35 (0.46, 3.93) |
0.587 |
1.31 (0.35, 4.91) |
0.691 |
| SERPINA1 |
| Z score |
1.12 (0.63, 1.99) |
0.705 |
0.95 (0.45, 2.02) |
0.9 |
| Dichotomous |
1.12 (0.44, 2.83) |
0.813 |
0.92 (0.29, 2.91) |
0.881 |
| FN1 |
| Z score |
1.24 (0.73, 2.11) |
0.423 |
0.91 (0.50, 1.66) |
0.763 |
| Dichotomous |
1.96 (0.77, 5.02) |
0.159 |
1.52 (0.46, 5.02) |
0.494 |
| SLPI |
| Z score |
1.23 (0.78, 1.94) |
0.371 |
1.58 (0.89, 2.79) |
0.115 |
| Dichotomous |
1.12 (0.44, 2.82) |
0.814 |
0.93 (0.30, 2.84) |
0.897 |
| COL6A2 |
| Z score |
2.00 (0.94, 4.25) |
0.073 |
2.64 (1.07, 6.49) |
0.035 |
| Dichotomous |
2.21 (0.86, 5.69) |
0.1 |
2.77 (0.81, 9.48) |
0.105 |
Data are presented as OR (95% CI) and P value. *Adjust model adjusted for: age, gender, current smoker, diabetes mellitus, high-density lipoprotein (HDL)-C level and admission creatinine level. CI, confidence interval; OR, odds ratio. See Table 1 for all other abbreviations.
Subsequently, we quantified the diagnostic accuracy of the identified DPs for PE using the ROC curve. Preliminary analysis of ROC curves indicated that the AUC values of single DPs were not sufficient, with the exception of the AUC value for IGF1, which reached 0.7 (Supplementary Figure 3A–J). Further, DCA was performed for the continuous predictors to evaluate the best threshold for predicting PE (Supplementary Figure 3K). The models established with IGF1, FERMT3, COL6A2, and GOT1 showed curves with better prediction compared to the “treat none” and “treat all” strategies. Therefore, we selected these four DPs for further analysis, along with traditional risk factors of age, sex, smoking status, diabetes mellitus, HDL-C, and admission creatinine level. The ROC curves with separate and combined traditional factors above to predict PE were depicted as well to show their predictive value (Figure 3A). To clarify the incremental diagnostic value of the biomarkers above, their ROC curves of different combinations with patient characteristics (age, gender, current smoker, diabetes, HDL-C, and creatinine) were also depicted, compared to the ROC curve with the abovementioned patient characteristics. And the AUCs were presented to show how AUC improved by combining models. As the association factors increased, so did the AUC (Figure 3B). The predictive value of each biomarker combined with the traditional factors was analyzed too. As a result, IGF1 presented the largest AUC among the 4 candidates, whereas FERMT3 exhibited the highest efficiency and accuracy (Supplementary Table 4). Thus, IGF1, FERMT3, and COL6A2 exhibited better diagnostic value for predicting plaque morphology when combined with traditional risk factors.

For better prediction of PE in STEMI, we investigated whether the potential biomarkers can be combined to identify PE (Supplementary Table 4). Considering the texture features, 10 candidates were reduced to 3 potential predictors using LASSO regression analysis (Figure 3C,D). Based on the results of logistic regression analysis, IGF1 alone, IGF1 together with FERMT3, IGF1 together with FERMT3 and COL6A2, and IGF1 and FERMT3 together with COL6A2 and GOT1 were combined with the above risk factors (age, gender, smoking status, diabetes mellitus, and HDL-C) to establish combined predictive models. The predictive efficiency and accuracy of all combinations increased significantly compared to single-factor values (Supplementary Figure 4A–D). Calibration curve analysis indicated that the combination of IGF1, FERMT3, and COL6A2 with traditional risk factors had the best fit (Supplementary Figure 4E–H), which was selected as the final multivariate predictive model for PE (Figure 3E,F). The resulting smoothing curves further confirmed the predictive values of IGF1, FERMT3, and COL6A2 for plaque type (Figure 3G–J).
Correlation of DPs With Plaque Morphological Characteristics
The correlations between the 10 candidate DPs and QCA results of angiography and OCT data were analysed using Spearman’s correlation (Table 3). IGF1 was determined to be inversely correlated with the size of lipid core and was weakly correlated with lesion length. IGF1 was also positively correlated with DRA and was weakly positively correlated with the minimum FCT. COL6A2 was positively correlated with the referential lumen area. FERMT3 merely presented a weak positive correlation with some plaque morphological characteristics.
Table 3.
Correlation of Candidate Differential Proteins and Plaque Morphologic Characteristics by Spearman’s Correlation
| Parameters |
IGF1 |
FERMT3 |
SEPT2 |
GOT1 |
MDH1 |
MB |
SERPINA1 |
FN1 |
SLPI |
COL6A2 |
| QCA |
| LL |
−0.07 |
0.0521 |
0.0207 |
0.1708 |
0.2087 |
0.1852 |
−0.1587 |
−0.0825 |
0.0482 |
−0.0203 |
| CLS |
0.0368 |
−0.1252 |
−0.0057 |
−0.0319 |
0.0314 |
0.1226 |
−0.0762 |
−0.1419 |
0.0372 |
−0.0481 |
| RVD |
0.0437 |
0.0414 |
−0.3472 |
−0.0321 |
−0.089 |
−0.2745 |
0.1125 |
−0.0218 |
−0.0073 |
0.1872 |
| MLD |
0.0774 |
−0.0349 |
−0.1774 |
0.028 |
−0.0849 |
−0.0849 |
−0.0912 |
0.0044 |
0.1194 |
0.0633 |
| DS |
−0.0608 |
−0.1369 |
0.3776 |
0.1055 |
0.0786 |
0.2973 |
−0.2584 |
0.0121 |
0.013 |
−0.1968 |
| OCT |
| LL |
−0.126 |
0.083 |
−0.1906 |
−0.1647 |
−0.0174 |
−0.1368 |
0.253 |
−0.0348 |
−0.0362 |
0.0336 |
| PRA |
0.0438 |
0.0953 |
−0.2246 |
0.0528 |
−0.0138 |
−0.0372 |
0.1817 |
0.0291 |
0.1323 |
0.3614 |
| DRA |
0.2897 |
−0.0526 |
−0.2043 |
0.2309 |
0.1066 |
0.1155 |
0.1359 |
−0.0307 |
0.3144 |
0.3865 |
| MLA |
0.0973 |
−0.0914 |
−0.2513 |
−0.0802 |
−0.0145 |
−0.1778 |
−0.0018 |
0.0285 |
0.1045 |
0.1549 |
| LCL |
−0.2077 |
0.0902 |
0.0227 |
−0.2874 |
−0.1973 |
−0.0466 |
0.145 |
−0.1992 |
−0.1132 |
−0.0423 |
| LLA |
−0.3143 |
0.0659 |
0.017 |
−0.2633 |
−0.161 |
−0.1624 |
−0.0079 |
−0.2316 |
−0.1345 |
−0.0635 |
| ALA |
−0.2493 |
−0.133 |
−0.0716 |
−0.1308 |
−0.1029 |
−0.0782 |
−0.0358 |
−0.2525 |
−0.174 |
0.0253 |
| FCT |
0.2152 |
−0.0878 |
−0.0039 |
−0.0322 |
−0.0978 |
−0.0687 |
0.0761 |
−0.2426 |
0.1368 |
0.146 |
| TL |
−0.0132 |
0.1437 |
−0.0961 |
−0.1338 |
−0.0022 |
0.0138 |
−0.0289 |
−0.1889 |
0.1831 |
−0.1041 |
Data are presented as Spearman correlation coefficient (r). ALA, average arc of lipid core; CLS, culprit lesion site; DRA, distal reference lumen area; DS, diameter stenosis rate; FCT, minimum thickness of fibrotic cap; LCL, lipid core length; LL, culprit lesion length; LLA, largest arc of lipid core; MLA, minimum lumen area; MLD, minimum vessel diameter; OCT, optical coherence tomography; PRA, proximal reference lumen area; RVD, reference vessel diameter; QCA, quantitative coronary angiography; TL, thrombus length. See Table 1 for all other abbreviations.
Discussion
In the present study, we compared the entire plasma protein profile of patients with STEMI caused by PE or PR. We demonstrated elevated plasma IGF1 and COL6A2 levels and decreased FERMT3 plasma levels associated with STEMI caused by PE. In addition, IGF1 was negatively correlated with the maximal lipid arc of the plaque, and COL6A2 was positively correlated with the lumen area of the culprit artery by quantitative compare of OCT images.
Present study first appeared that a higher level of COL6A2 in plasma in STEMI patients with PE than those with PR, and it was positively correlated with the referential lumen area of a culprit vessel on OCT images. Collagen VI is a widely distributed extracellular matrix protein. In early-stage atherosclerosis, type VI collagen protein increased in the deep layer, and macrophages were predominant in lesions during the progression of atherosclerosis.17
The primary function of type VI collagen secreted abundantly by macrophages appears to be modulation of cell-cell and cell-matrix interactions. It is a marker for a non-destructive, matrix-conserving macrophage phenotype (M2). Macrophages secrete type VI collagen protein depending on their mode of activation, stage of differentiation, and cell density.18
Macrophages play an important role in the intermediate stage of atherosclerosis.19
They are derived from human blood monocytes to perform different tasks related to tissue injury and repair. Local delivery of collagen VI increased the recruitment of macrophages and their polarization toward the pro-healing (M2) phenotype.20
Further, macrophage recruitment and M2 polarization are impaired in COL6A1(−/−) macrophages and COL6A1(−/−) mice. The study also demonstrated that COL6A1 might promote macrophage migration and polarization via AKT and PKA pathways.21
We suspect that as the COL6A2 of the same family, there may be the same effect on macrophage migration and polarization. The exact roles and their mechanisms need to be confirmed by further studies.
IGF1 is a major autocrine/paracrine growth factor that promotes cell proliferation, migration, and survival. Numerous studies have reported an association between IGF1 and CAD, with a general focus on its protective effect.22
The IGF1 level is not only associated with the presence of coronary atherosclerosis,23
but it is also associated with the severity of atherosclerosis and cardiovascular events.24,25
Furthermore, a low serum IGF1 level was found to be associated with an increased risk of ischemic heart disease.26
IGF1 also plays a role in the proliferation of vascular smooth muscle cells (VSMCs).27
The proliferating VSMCs migrate to the intima and differentiate to form the fibrotic cap of the plaque.28
Apoptosis of VSMCs was considered as a possible mechanism of atherosclerotic plaque instability and rupture,29
because IGF1 could protect the differentiated VSMCs from oxidative stress-induced apoptosis30
and increase collagen fibrillogenesis in atherosclerotic plaque.31
The present study showed that IGF1 was negatively correlated with lipid content in plaques in an OCT image comparison, which provided further clinical evidence of the protective effect of IGF1. Detection of higher levels of both type VI collagen protein and IGF1 in the plasma of STEMI patients with PE than with PR hinted that pro-healing factors might occupy a more dominant position in PE than in PR. It helps explain why less risk factors, such as male gender, older age, history of diabetes mellitus, hyperlipemia and hypertension, appear in PEs compared with PRs.8
It also calls on more studies on type VI collagen protein and IGF1 to determine their clinical role and mechanisms in the process of atherosclerosis.
FERMT3 is a member of the kindlin family, with expression restricted to hematopoietic cells, and it is particularly abundant in megakaryocytes and platelets.32
FERMT3 is an essential element for platelet integrin activation in hemostasis and thrombosis,32
and plays a vital role in platelet fibrinogen receptor αIIbβ3 activation,33
subsequent aggregation,34
atheroprogression,35
and cardiovascular events.36
Deficiency of FERMT3 leads to leukocyte adhesion deficiency and severe bleeding due to impairment of integrin activation and platelet agglutination integrin function.33
Significantly elevated FERMT3 levels were detected in the plasma from patients with PR compared to those with PE in the current study. It is in accordance with the thrombus promotion effect of FERMT3 and supports the detrimental role it plays in AMI. However, FERMT3 presented a weak correlation with some plaque morphological characteristics on OCT images in the present study. And a previous study demonstrated that FERMT3 expression was upregulated in human atherosclerotic plaques and it was detected in phenotype M2 macrophages, which are thought to play a pro-healing and anti-inflammation role in the progression of atherosclerosis.37
Thus, we speculate that FERMT3 might regulate macrophage activation in different aspects in atherosclerotic plaques, although it has the effect of promoting thrombus aggregation on platelets, just as the thromboxane A2 receptor did in another study.38
Considering that kindlins are also essential molecules for modifying integrin function and activation,39
FERMT3 might play an important role in integrin-mediated atherogenesis, including the adhesion of leucocytes, transmigration into the vessel wall,40
differentiation of monocytes to macrophages,41
and promotion of foam cell formation. However, whether FERMT3 benefit or harm in the progress of atheromatous plaques needs to be further studied and confirmed.
Unstable angina is one of the clinical presentations of acute coronary syndrome (ACS) that is mainly caused by PR or PE. Thus, the pattern of proteomic profiling should be similar to that of PR or PE; however, the proteomic profiling in this study shows an apparently different pattern from that of PR or PE. We analysed the proteomic differences in the present study and found that PE involved less upregulated damage factors and downregulated protective and repair factors than PR. Accordingly, we proposed a damage-repair imbalance theory of PR and PE. We speculate that there exists a loss of equilibrium between repair and damage in the diseased vascular. If a moderate repair processed, the diseased vascular rehabilitate to be stable plaques, otherwise, march to ACS. If the damaged vascular repaired excess and continued, and developed lumen occlusion caused by some inducements, it would advance into PE. And if the repaired insufficient and the damage continued to form a rupture and lumen occlusion, the damaged vascular would evolve into PR conversely. But if the damage ceased and the abnormal repair rectified, the proceeding of PR or PE may be prevented. Of course, this hypothesis needs to be testified by further studies.
Several limitations of the study should be mentioned. First, although a TMT-based differential proteomic approach provides a homogeneous experimental environment, the sample size is limited, even when using mixed samples; therefore, further clinical validation is recommended on a larger and more diverse patient population. Second, the mixed samples applied to TMT showed common intragroup characteristics; however, certain effects may have been masked by the abnormal extreme expression of specific individual samples. In addition, being limited by the upper limit of sample number permitted in the labelling comparative proteomic tech TMT, even using mixed samples, numbers of erosion and PR were recruited to be the highest and equal rather than what is consistent with the proportion used in the total cohort of the EROSION study.
Conclusions
Overall, our study indicated that elevated plasma IGF1 and COL6A2 levels and reduced plasma FERMT3 levels are typical characteristics of patients with STEMI and PE compared to those in patients with STEMI and PR. Both IGF1 and COL6A2 were correlated with the characteristics of culprit plaque. IGF1, FERMT3, COL6A2 and traditional risk factors might build predictive model for PE in patients with STEMI.
Funding
This work was supported by the National Key R&D Program of China (Grant NO. 2016YFC1301100; awarded to B.Y.) and the Key Laboratory of Myocardial Ischemia, Chinese Ministry of Education, Harbin, Heilongjiang Province, China (Grant NO. KF201808; awarded to J.L.).
Disclosures
B.Y. is a member of
Circulation Journal
’s International Associate Editorial Team. All other authors declare that no conflicts of interest.
Supplementary Files
Please find supplementary file(s);
http://dx.doi.org/10.1253/circj.CJ-19-1206
References
- 1.
GBD 2016 Disease and Injury Incidence and Prevalence Collaborators. Global, regional, and national incidence, prevalence, and years lived with disability for 328 diseases and injuries for 195 countries, 1990–2016: A systematic analysis for the Global Burden of Disease Study 2016. Lancet 2017; 390: 1211–1259.
- 2.
Yabushita H, Bouma BE, Houser SL, Aretz HT, Jang IK, Schlendorf KH, et al. Characterization of human atherosclerosis by optical coherence tomography. Circulation 2002; 106: 1640–1645.
- 3.
Jia H, Abtahian F, Aguirre AD, Lee S, Chia S, Lowe H, et al. In vivo diagnosis of plaque erosion and calcified nodule in patients with acute coronary syndrome by intravascular optical coherence tomography. J Am Coll Cardiol 2013; 62: 1748–1758.
- 4.
Kajander OA, Pinilla-Echeverri N, Jolly SS, Bhindi R, Huhtala H, Niemela K, et al. Culprit plaque morphology in stemi - an optical coherence tomography study: Insights from the total-oct substudy. EuroIntervention 2016; 12: 716–723.
- 5.
Virmani R, Burke AP, Farb A, Kolodgie FD. Pathology of the vulnerable plaque. J Am Coll Cardiol 2006; 47: C13–C18.
- 6.
Virmani R, Burke AP, Kolodgie FD, Farb A. Vulnerable plaque: The pathology of unstable coronary lesions. J Interv Cardiol 2002; 15: 439–446.
- 7.
Jia H, Dai J, Hou J, Xing L, Ma L, Liu H, et al. Effective anti-thrombotic therapy without stenting: Intravascular optical coherence tomography-based management in plaque erosion (the erosion study). Eur Heart J 2017; 38: 792–800.
- 8.
Dai J, Xing L, Jia H, Zhu Y, Zhang S, Hu S, et al. In vivo predictors of plaque erosion in patients with ST-segment elevation myocardial infarction: A clinical, angiographical, and intravascular optical coherence tomography study. Eur Heart J 2018; 39: 2077–2085.
- 9.
Chandran S, Watkins J, Abdul-Aziz A, Shafat M, Calvert PA, Bowles KM, et al. Inflammatory differences in plaque erosion and rupture in patients with ST-segment elevation myocardial infarction. J Am Heart Assoc 2017; 6: pii: e005868.
- 10.
Falk E, Nakano M, Bentzon JF, Finn AV, Virmani R. Update on acute coronary syndromes: The pathologists’ view. Eur Heart J 2013; 34: 719–728.
- 11.
Ross PL, Huang YN, Marchese JN, Williamson B, Parker K, Hattan S, et al. Multiplexed protein quantitation in Saccharomyces cerevisiae using amine-reactive isobaric tagging reagents. Mol Cell Proteomics 2004; 3: 1154–1169.
- 12.
Prati F, Regar E, Mintz GS, Arbustini E, Di Mario C, Jang IK, et al. Expert review document on methodology, terminology, and clinical applications of optical coherence tomography: Physical principles, methodology of image acquisition, and clinical application for assessment of coronary arteries and atherosclerosis. Eur Heart J 2010; 31: 401–415.
- 13.
Jenkinson C, Elliott VL, Evans A, Oldfield L, Jenkins RE, O’Brien DP, et al. Decreased serum thrombospondin-1 levels in pancreatic cancer patients up to 24 months prior to clinical diagnosis: Association with diabetes mellitus. Clin Cancer Res 2016; 22: 1734–1743.
- 14.
Liu X, Sun C, Gu X, Liu X, Wang X, Wang X, et al. Intraplaque neovascularization attenuated statin benefit on atherosclerotic plaque in CAD patients: A follow-up study with combined imaging modalities. Atherosclerosis 2019; 287: 134–139.
- 15.
Sun R, Hu S, Guagliumi G, Jia H, Tian J, Li L, et al. Pre-infarction angina and culprit lesion morphologies in patients with a first ST-segment elevation acute myocardial infarction: Insights from in vivo optical coherence tomography. EuroIntervention 2019; 14: 1768–1775.
- 16.
Tearney GJ, Regar E, Akasaka T, Adriaenssens T, Barlis P, Bezerra HG, et al. Consensus standards for acquisition, measurement, and reporting of intravascular optical coherence tomography studies: A report from the international working group for intravascular optical coherence tomography standardization and validation. J Am Coll Cardiol 2012; 59: 1058–1072.
- 17.
Ohtani H, Shingu T, Chayama K, Hayashi K. Different role of macrophages and vascular smooth muscle cells in atherosclerotic lesions of Watanabe heritable hyperlipidemic (WHHL) rabbit between aorta and coronary artery. Hiroshima J Med Sci 2008; 57: 53–60.
- 18.
Schnoor M, Cullen P, Lorkowski J, Stolle K, Robenek H, Troyer D, et al. Production of type VI collagen by human macrophages: A new dimension in macrophage functional heterogeneity. J Immunol 2008; 180: 5707–5719.
- 19.
Stary HC, Chandler AB, Dinsmore RE, Fuster V, Glagov S, Insull W, et al. A definition of advanced types of atherosclerotic lesions and a histological classification of atherosclerosis: A report from the Committee on Vascular Lesions of the Council on Arteriosclerosis, American Heart Association. Circulation 1995; 92: 1355–1374.
- 20.
Lv D, Zhou L, Zheng X, Hu Y. Sustained release of collagen VI potentiates sciatic nerve regeneration by modulating macrophage phenotype. Eur J Neurosci 2017; 45: 1258–1267.
- 21.
Chen P, Cescon M, Zuccolotto G, Nobbio L, Colombelli C, Filaferro M, et al. Collagen VI regulates peripheral nerve regeneration by modulating macrophage recruitment and polarization. Acta Neuropathol 2015; 129: 97–113.
- 22.
Higashi Y, Gautam S, Delafontaine P, Sukhanov S. IGF-1 and cardiovascular disease. Growth Horm IGF Res 2019; 45: 6–16.
- 23.
Akturk IF, Yalcin AA, Biyik I, Caglar NT, Isiksacan N, Sarikamis C, et al. The role of insulin-like growth factor-1 in development of coronary no-reflow and severity of coronary artery disease in patients with acute myocardial infarction. Postep Kardiol Inter 2014; 10: 12–17.
- 24.
van Bunderen CC, van Nieuwpoort IC, van Schoor NM, Deeg DJ, Lips P, Drent ML. The association of serum insulin-like growth factor-I with mortality, cardiovascular disease, and cancer in the elderly: A population-based study. J Clin Endocr Metab 2010; 95: 4616–4624.
- 25.
Osadnik T, Strzelczyk JK, Lekston A, Regula R, Bujak K, Fronczek M, et al. The association of functional polymorphisms in genes encoding growth factors for endothelial cells and smooth muscle cells with the severity of coronary artery disease. BMC Cardiovasc Disor 2016; 16: 218.
- 26.
Juul A, Scheike T, Davidsen M, Gyllenborg J, Jorgensen T. Low serum insulin-like growth factor I is associated with increased risk of ischemic heart disease: A population-based case-control study. Circulation 2002; 106: 939–944.
- 27.
Arnqvist HJ. The role of IGF-system in vascular insulin resistance. Horm Metab Res 2008; 40: 588–592.
- 28.
Sun Y, Chen D, Cao L, Zhang R, Zhou J, Chen H, et al. Mir-490-3p modulates the proliferation of vascular smooth muscle cells induced by ox-LDL through targeting PAPP-A. Cardiovasc Res 2013; 100: 272–279.
- 29.
Bauriedel G, Hutter R, Welsch U, Bach R, Sievert H, Luderitz B. Role of smooth muscle cell death in advanced coronary primary lesions: Implications for plaque instability. Cardiovasc Res 1999; 41: 480–488.
- 30.
Allard D, Figg N, Bennett MR, Littlewood TD. Akt regulates the survival of vascular smooth muscle cells via inhibition of FoxO3a and GSK3. Biol Chem 2008; 283: 19739–19747.
- 31.
Shai SY, Sukhanov S, Higashi Y, Vaughn C, Kelly J, Delafontaine P. Smooth muscle cell-specific insulin-like growth factor-1 overexpression in Apoe−/− mice does not alter atherosclerotic plaque burden but increases features of plaque stability. Arterioscl Throm Vasc Biol 2010; 30: 1916–1924.
- 32.
Moser M, Nieswandt B, Ussar S, Pozgajova M, Fassler R. Kindlin-3 is essential for integrin activation and platelet aggregation. Nat Med 2008; 14: 325–330.
- 33.
Meller J, Malinin NL, Panigrahi S, Kerr BA, Patil A, Ma Y, et al. Novel aspects of Kindlin-3 function in humans based on a new case of leukocyte adhesion deficiency III. J Thromb Haemost 2012; 10: 1397–1408.
- 34.
Xu Z, Chen X, Zhi H, Gao J, Bialkowska K, Byzova TV, et al. Direct interaction of kindlin-3 with integrin alphaIIbbeta3 in platelets is required for supporting arterial thrombosis in mice. Arterioscl Throm Vasc Biol 2014; 34: 1961–1967.
- 35.
Massberg S, Schurzinger K, Lorenz M, Konrad I, Schulz C, Plesnila N, et al. Platelet adhesion via glycoprotein IIb integrin is critical for atheroprogression and focal cerebral ischemia: An in vivo study in mice lacking glycoprotein IIb. Circulation 2005; 112: 1180–1188.
- 36.
Kunicki TJ, Ruggeri ZM. Platelet collagen receptors and risk prediction in stroke and coronary artery disease. Circulation 2001; 104: 1451–1453.
- 37.
Oksala N, Parssinen J, Seppala I, Klopp N, Illig T, Laaksonen R, et al. Kindlin 3 (FERMT3) is associated with unstable atherosclerotic plaques, anti-inflammatory type II macrophages and upregulation of beta-2 integrins in all major arterial beds. Atherosclerosis 2015; 242: 145–154.
- 38.
Pierre S, Linke B, Suo J, Tarighi N, Del Turco D, Thomas D, et al. GPVI and thromboxane receptor on platelets promote proinflammatory macrophage phenotypes during cutaneous inflammation. J Invest Dermatol 2017; 137: 686–695.
- 39.
Moser M, Legate KR, Zent R, Fassler R. The tail of integrins, talin, and kindlins. Science 2009; 324: 895–899.
- 40.
Massberg S, Brand K, Gruner S, Page S, Muller E, Muller I, et al. A critical role of platelet adhesion in the initiation of atherosclerotic lesion formation. J Exp Med 2002; 196: 887–896.
- 41.
Prieto J, Eklund A, Patarroyo M. Regulated expression of integrins and other adhesion molecules during differentiation of monocytes into macrophages. Cell Immunol 1994; 156: 191–211.