Abstract
Background:
The excessive volume of contrast needed is a significant limitation of optical coherence tomography (OCT)-guided percutaneous coronary intervention (PCI). Low-molecular-weight dextran (LMWD) has been used for OCT image acquisition instead of contrast media. This study compared the effects of OCT-guided PCI using LMWD on renal function and clinical outcomes to those of intravascular ultrasound (IVUS)-guided PCI.
Methods and Results:
In all, 1,183 consecutive patients who underwent intracoronary imaging-guided PCI were enrolled in this single-center, retrospective, observational study. After propensity score matching, 133 pairs of patients were assigned to undergo either OCT-guided PCI using LMWD or IVUS-guided PCI. There was no significant change from baseline in the primary endpoint, serum creatinine concentrations, after the procedure in either group. There were no significant differences between the OCT and IVUS groups in the volume of contrast medium, the incidence of contrast-induced nephropathy (1.5% vs. 2.3%; P=0.65), and major adverse cardiovascular events (MACE) at 30 days (2.3% vs. 6.0%; P=0.12) and 12 months (2.3% vs. 3.0%; P=0.70) after the procedure. Kaplan-Meier analysis at the 12-month follow-up revealed no significant difference in the incidence of MACE between the 2 groups (P=0.75).
Conclusions:
OCT-guided PCI using LMWD did not negatively affect renal function and achieved similar short- and long-term clinical outcomes to IVUS-guided PCI.
Optical coherence tomography (OCT) is an emerging intravascular imaging modality that uses near-infrared light reflectivity. Its axial resolution is approximately 10-fold higher than that of intravascular ultrasound (IVUS), allowing precise characterization of plaque morphology and lumen geometry.1
Previous trials have demonstrated the non-inferiority of OCT- to IVUS-guided percutaneous coronary intervention (PCI) in terms of both acute and long-term clinical outcomes.2,3
However, OCT requires contrast medium to flush blood cells before image acquisition, increasing the total amount used. The volume of contrast is closely related to the development of contrast-induced nephropathy (CIN),4–6
which is associated with increased in-hospital time and long-term morbidity and mortality.7–9
Ozaki et al reported that OCT image acquisition with low-molecular-weight dextran (LMWD) achieved the same image quality and quantitative assessment value of OCT with contrast medium.10
Furthermore, OCT-guided PCI using LMWD in patients with chronic kidney disease (CKD) has been reported.11–13
Although LMWD has been increasingly used for OCT, few studies have investigated the safety and feasibility of OCT-guided PCI using LMWD. Conversely, anuric acute renal failure after the administration of LMWD has been reported,14,15
and the effect of LMWD on renal function remains unclear.
The aims of the present study were to: (1) investigate the effects of LMWD administration during OCT-guided PCI in patients with both normal and impaired renal function; and (2) compare the clinical outcomes of OCT-guided PCI using LMWD with those of IVUS-guided PCI.
Methods
Study Design
The present study was a single-center, retrospective, observational study. Patients were eligible for inclusion if they were >20 years old and had undergone PCI for effort and unstable angina at Miyazaki Prefectural Nobeoka Hospital between December 2015 and June 2019. Patients with acute myocardial infarction (MI), both ST-elevation MI [STEMI] and non-STEMI [NSTEMI]), and New York Heart Association Classes III and IV heart failure were excluded from the study. Further, lesion-specific exclusion criteria were aorto-ostium lesions, chronic total occlusion, and bypass graft stenosis.
Procedures
PCI was performed via the radial, femoral, or brachial artery approach using 6- or 7-Fr guiding catheters. Patients received intravenous unfractionated heparin. In addition, patients received aspirin 100 mg daily and were loaded with 300 mg clopidogrel or 20 mg prasugrel if not already on a maintenance dose. Dual antiplatelet therapy with aspirin and an ADP receptor antagonist (clopidogrel or prasugrel) was continued for 6–12 months. PCI was performed with the standard technique using OCT or IVUS at the discretion of the physician.
All OCT imaging was obtained using an intravascular catheter system (ILUMIEN OCT Imaging system; Abbott Vascular, Santa Clara, CA, USA) and the Dragonfly OPTIS Imaging Catheter (Abbott Vascular). For OCT image acquisition, 10–20 mL (1–2 g) Dextran 40 and lactated Ringer’s solution (Low Molecular Dextran L Injection; Otsuka Pharmaceutical Factory, Tokushima, Japan) was injected manually.
Stent size and length were determined depending on the use of OCT or IVUS. For OCT-guided PCI, a stent diameter up to 0.25 mm larger than the distal reference diameter was used. In the IVUS-guided group, the stent diameter was the same as the distal reference diameter. Stent length was determined as the distance from the distal to proximal reference site in both groups. Intravascular imaging was performed after stent implantation. If incomplete stent expansion or incomplete stent apposition was detected, additional procedures were performed to optimize stent implantation. The decision regarding whether to perform additional interventions was left to the discretion of the operator.
Patients with pre-existing chronic renal failure with an estimated glomerular filtration rate (eGFR) <60 mL/min/1.73 m2
received hydration therapy using physiologic (0.9%) saline infused at a rate of 1 mL·kg−1·h−1
at 12 h before and after the procedure. In patients with impaired renal function, minimizing the contrast volume was attempted by using intravascular imaging. This approach involved staged PCI after diagnostic coronary angiography had been performed on a different day. A guidewire was advanced, without contrast, with reference to previous angiographic images. When determining the stent position, angiographic coregistered OCT or IVUS marking was used. After evaluation of stent expansion and apposition by OCT or IVUS, angiography was performed to assess the final results. Procedural success was defined as a final angiographic stenosis <50% and no complications during and after the procedure.
After discharge, patients underwent an outpatient follow-up visit or telephone interview by a physician or trained nurse at 6–12 months.
Endpoints
The primary endpoint was the change in serum creatinine concentrations within 72 h after the procedure. Secondary endpoints were changes in eGFR and the development of major adverse cardiovascular events (MACE; composite of cardiac death, MI, ischemia-driven target vessel revascularization, and stent thrombosis) at 12 months. In addition, we evaluated procedural MACE (dissection, perforation, thrombus, procedural MI, and acute closure) at 30 days. Baseline renal function was assessed on admission (before PCI) and within 72 h after PCI. In addition, we evaluated the incidence of CIN after the procedure, defined as an increase in creatinine concentrations ≥0.5 mg/dL or ≥25% within 72 h. Absolute and percentage changes in serum creatinine concentrations and eGFR within the 72 h after the procedure relative to baseline were also evaluated.
Statistical Analysis
To control for the effects of procedure selection bias and possible confounders between the groups, propensity score matching was performed. The predicted probability of using OCT or IVUS was calculated by fitting a logistic regression model using clinically relevant variables,16
such as age, sex, serum creatinine concentration, comorbidity (diabetes and heart failure), and lesion characteristics (left main trunk, American Heart Association Type B2, or C lesion). For the logistic regression model to estimate propensity scores, the Hosmer-Lemeshow goodness of fit χ2
was 4.589 with a P-value of 0.800, and the area under the curve of the receiver operating characteristic curve was 0.686. One patient on OCT was matched to 1 patient on IVUS using nearest-neighbor matching within a caliper width of 0.01 without replacement.
Continuous variables are expressed as the median with interquartile range (IQR). Categorical data are shown as frequencies and percentages. The significance of differences between 2 groups was tested using the χ2
test or Fisher’s exact test for categorical variables. The significance of differences in continuous variables was analyzed by the Mann-Whitney U test or the Wilcoxon signed-rank test as appropriate.
Survival curves were generated with the Kaplan-Meier method, and statistical assessments among the 2 groups were performed using the log-rank test. Cox regression proportional hazard analysis was used to assess hazard ratios (HRs) with 95% confidence intervals (CIs) for comparing OCT-guided PCI to IVUS-guided PCI.
A post hoc power analysis was performed to confirm the required sample size per group for detecting relevant changes in the level of creatinine using a 2-sided α of 5% in a paired t-test. The relevant changes were defined as a 25% change from baseline creatinine concentration. The analysis showed a power of >0.99 with the present sample size. All statistical analyses were conducted using SPSS version 20 (IBM Corp, Armonk, NY, USA) and SAS version 9.4 (SAS Institute, Cary, NC, USA).
Ethics Statement
This study was conducted in accordance with the Declaration of Helsinki established by the World Medical Association and the “Ethical Principles in Clinical Studies” published by the Ministry of Health, Labour and Welfare of Japan. This study was approved by the Institutional Review Board of Miyazaki Prefectural Nobeoka Hospital.
Results
Baseline Patient and Procedural Characteristics
Figure 1
shows a flow chart of the patient recruitment process. Of 1,719 consecutive patients, 536 were excluded (324 with STEMI, 108 with NSTEMI, 64 with chronic total occlusion, and 40 with aorto-ostial lesions), leaving 1,183 consecutive patients in the present study. After propensity score matching, 133 matched pairs of patients were identified.
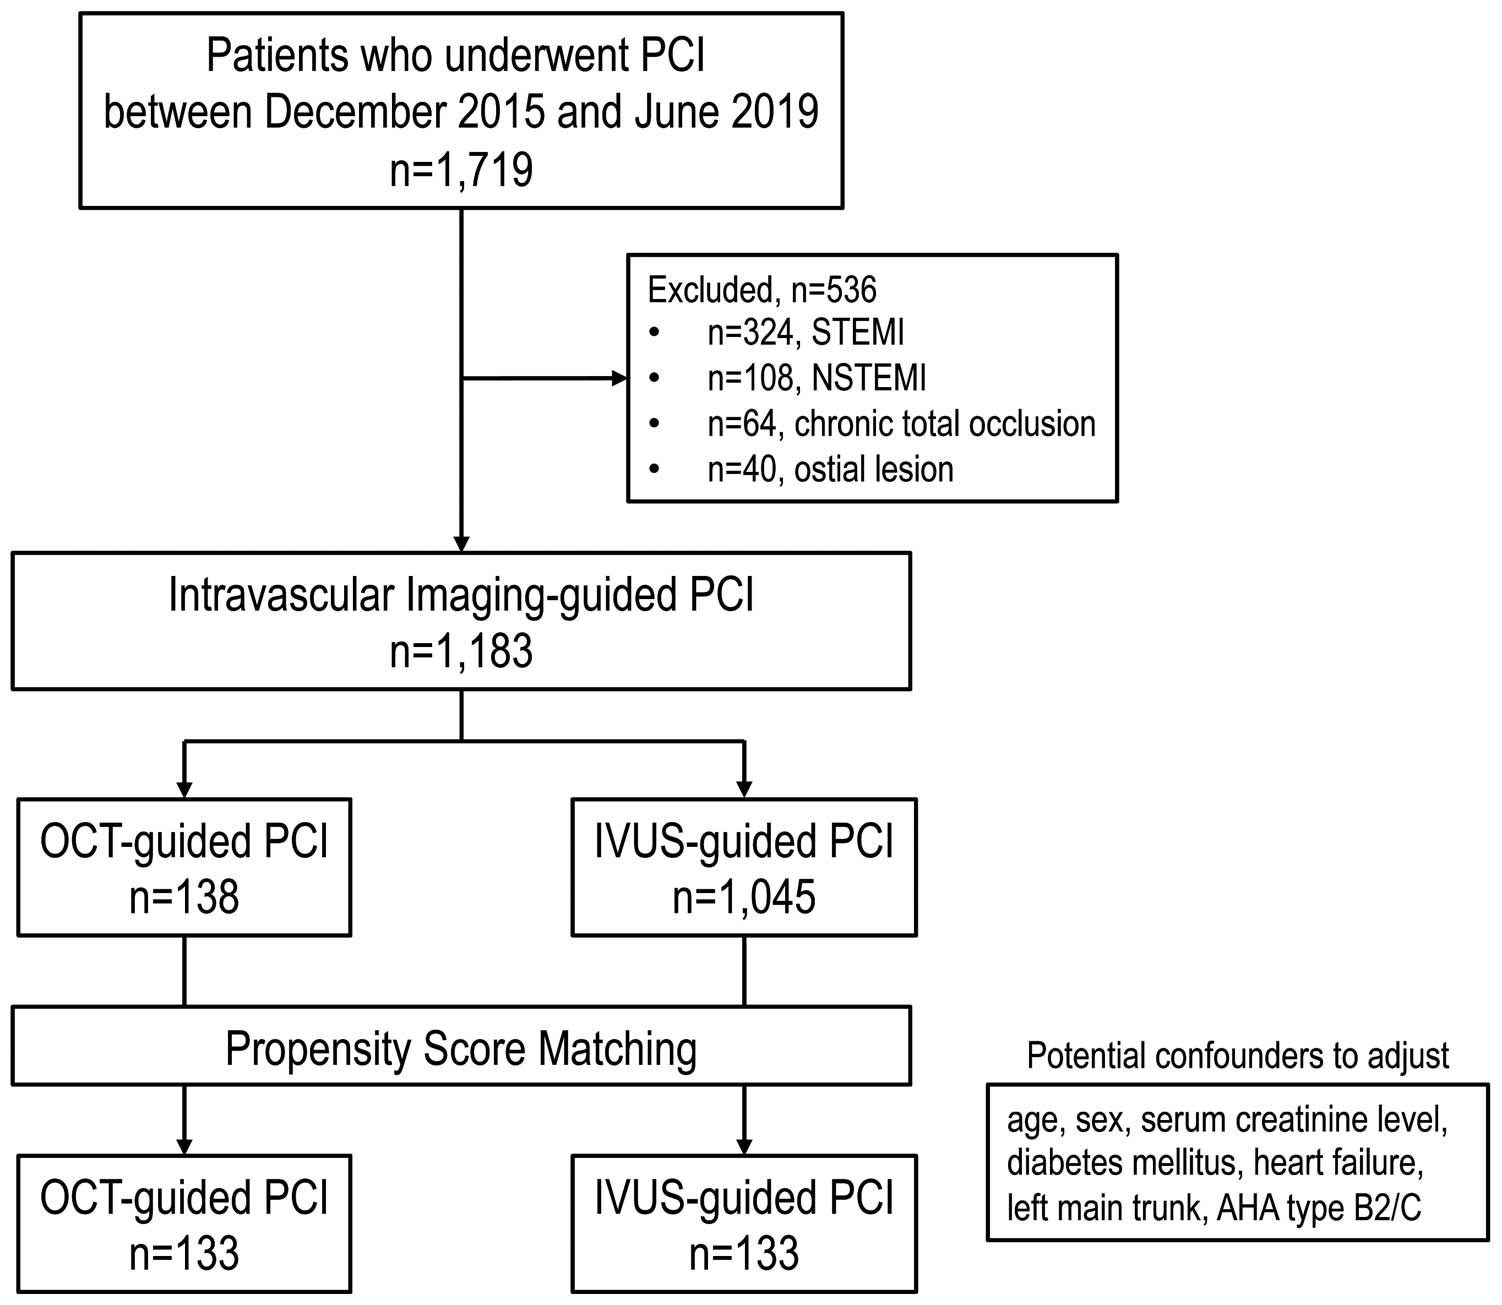
Table 1
summarizes the baseline characteristics of the patients, with no significant differences found between the OCT- and IVUS-guided groups. The procedural success rate was 100% in each group (Table 2). Bifurcation lesions were significantly more frequent in the OCT than IVUS group (36.1% vs. 23.3%; P=0.023). The number of OCT/IVUS pullbacks per procedure was also greater in the OCT group (median 4 [IQR 3–6] vs. 3 [IQR] 3–4; P=0.007). Of all 549 pullbacks in the OCT-guided PCI group, 97 (17.7%) were associated with insufficient image quality and additional pullbacks were needed. Image quality and quantitative assessment were comparable when using LMWD and contrast media (data not shown).
Table 1.
Baseline Characteristics of Patients Undergoing IVUS- or OCT-Guided PCI
| |
OCT-guided PCI
(n=133) |
IVUS-guided PCI
(n=133) |
P-value |
| Age (years) |
70 [65–76] |
70 [64–78] |
0.66 |
| Male sex |
107 (80.5) |
104 (78.2) |
0.65 |
| Stable angina |
113 (85.0) |
106 (79.7) |
0.26 |
| Unstable angina |
20 (15.0) |
27 (20.3) |
0.26 |
| Hypertension |
101 (75.9) |
109 (82.0) |
0.23 |
| Diabetes |
56 (42.1) |
47 (35.5) |
0.26 |
| Dyslipidemia |
94 (70.7) |
102 (77.0) |
0.27 |
| Smoker |
59 (44.4) |
66 (49.6) |
0.39 |
| Family history of CAD |
16 (12.0) |
12 (9.0) |
0.42 |
| History of PCI |
89 (66.9) |
78 (58.6) |
0.16 |
| History of MI |
41 (30.8) |
41 (30.8) |
1.00 |
| History of CABG |
5 (3.8) |
4 (3.0) |
0.74 |
| History of CHF |
13 (9.8) |
15 (11.3) |
0.69 |
| Medication |
| Aspirin |
127 (95.5) |
126 (94.7) |
0.78 |
| ADP antagonist |
127 (95.5) |
124 (93.2) |
0.43 |
| Warfarin |
3 (2.3) |
3 (2.3) |
1.00 |
| DOAC |
6 (4.5) |
7 (5.3) |
0.78 |
| Statin |
116 (87.2) |
115 (86.5) |
0.86 |
| Ezetimibe |
27 (20.3) |
28 (21.1) |
0.88 |
| ACEI/ARB |
81 (60.9) |
85 (63.9) |
0.61 |
| Calcium channel blocker |
68 (51.1) |
57 (42.9) |
0.18 |
| β-blocker |
37 (27.8) |
50 (37.6) |
0.09 |
| Diuretics |
16 (12.0) |
20 (15.0) |
0.47 |
| Insulin |
3 (2.3) |
3 (2.3) |
1.00 |
Unless indicated otherwise, data are expressed as the median [interquartile range] or number of patients (%). ACEI, angiotensin-converting enzyme inhibitor; ARB, angiotensin II receptor blocker; CABG, coronary artery bypass grafting; CAD, coronary artery disease; CHF, congestive heart failure; DOAC, direct oral anticoagulants; IVUS, intravascular ultrasound; MI, myocardial infarction; PCI, percutaneous coronary intervention; OCT, optical coherence tomography.
Table 2.
Procedural Characteristics for Patients Undergoing IVUS- or OCT-Guided PCI
| |
OCT-guided PCI
(n=133) |
IVUS-guided PCI
(n=133) |
P-value |
| Procedural success |
133 (100) |
133 (100) |
– |
| Ad hoc |
73 (54.9) |
75 (56.4) |
0.81 |
| Radial artery approach |
117 (88.0) |
111 (83.5) |
0.29 |
| LAD |
68 (51.1) |
62 (46.6) |
0.46 |
| LMT |
18 (13.5) |
18 (13.5) |
1.00 |
| Bifurcation |
48 (36.1) |
31 (23.3) |
0.023 |
| Moderate or heavy calcification |
41 (30.8) |
46 (34.6) |
0.49 |
| ACC/AHA Type B2/C lesion |
106 (79.7) |
106 (79.7) |
1.00 |
| DES usage |
105 (78.9) |
113 (85.0) |
0.20 |
| Stent diameter (mm) |
3.0 [2.5–3.5] |
3.0 [2.5–3.5] |
0.21 |
| Total stent length (mm) |
26.0 [20.0–38.0] |
28 [18.5–38.0] |
0.37 |
| Predilatation |
116 (87.2) |
115 (86.5) |
0.86 |
| Maximum balloon size (mm) |
3.0 [3.0–4.0] |
3.0 [3.0–4.0] |
0.22 |
| No. OCT/IVUS pullbacks |
4 [3–6] |
3 [3–4] |
0.007 |
| Procedure time (mm) |
52 [40–87] |
57 [42–86] |
0.39 |
| Contrast volume (mL) |
99 [74.5–123] |
100 [73–127] |
0.82 |
| Contrast volume/eGFR ratio |
1.53 [1.26–1.94] |
1.64 [1.20–2.18] |
0.53 |
| Dextran volume (mm) |
64 [48–98] |
– |
– |
Unless indicated otherwise, data are expressed as the median [interquartile range] or number of patients (%). ACC, American College of Cardiology; AHA, American Heart Association; DES, drug-eluting stent; eGFR, estimated glomerular filtration rate; LAD, left anterior descending artery; LMT, left main trunk. Other abbreviations as in Table 1.
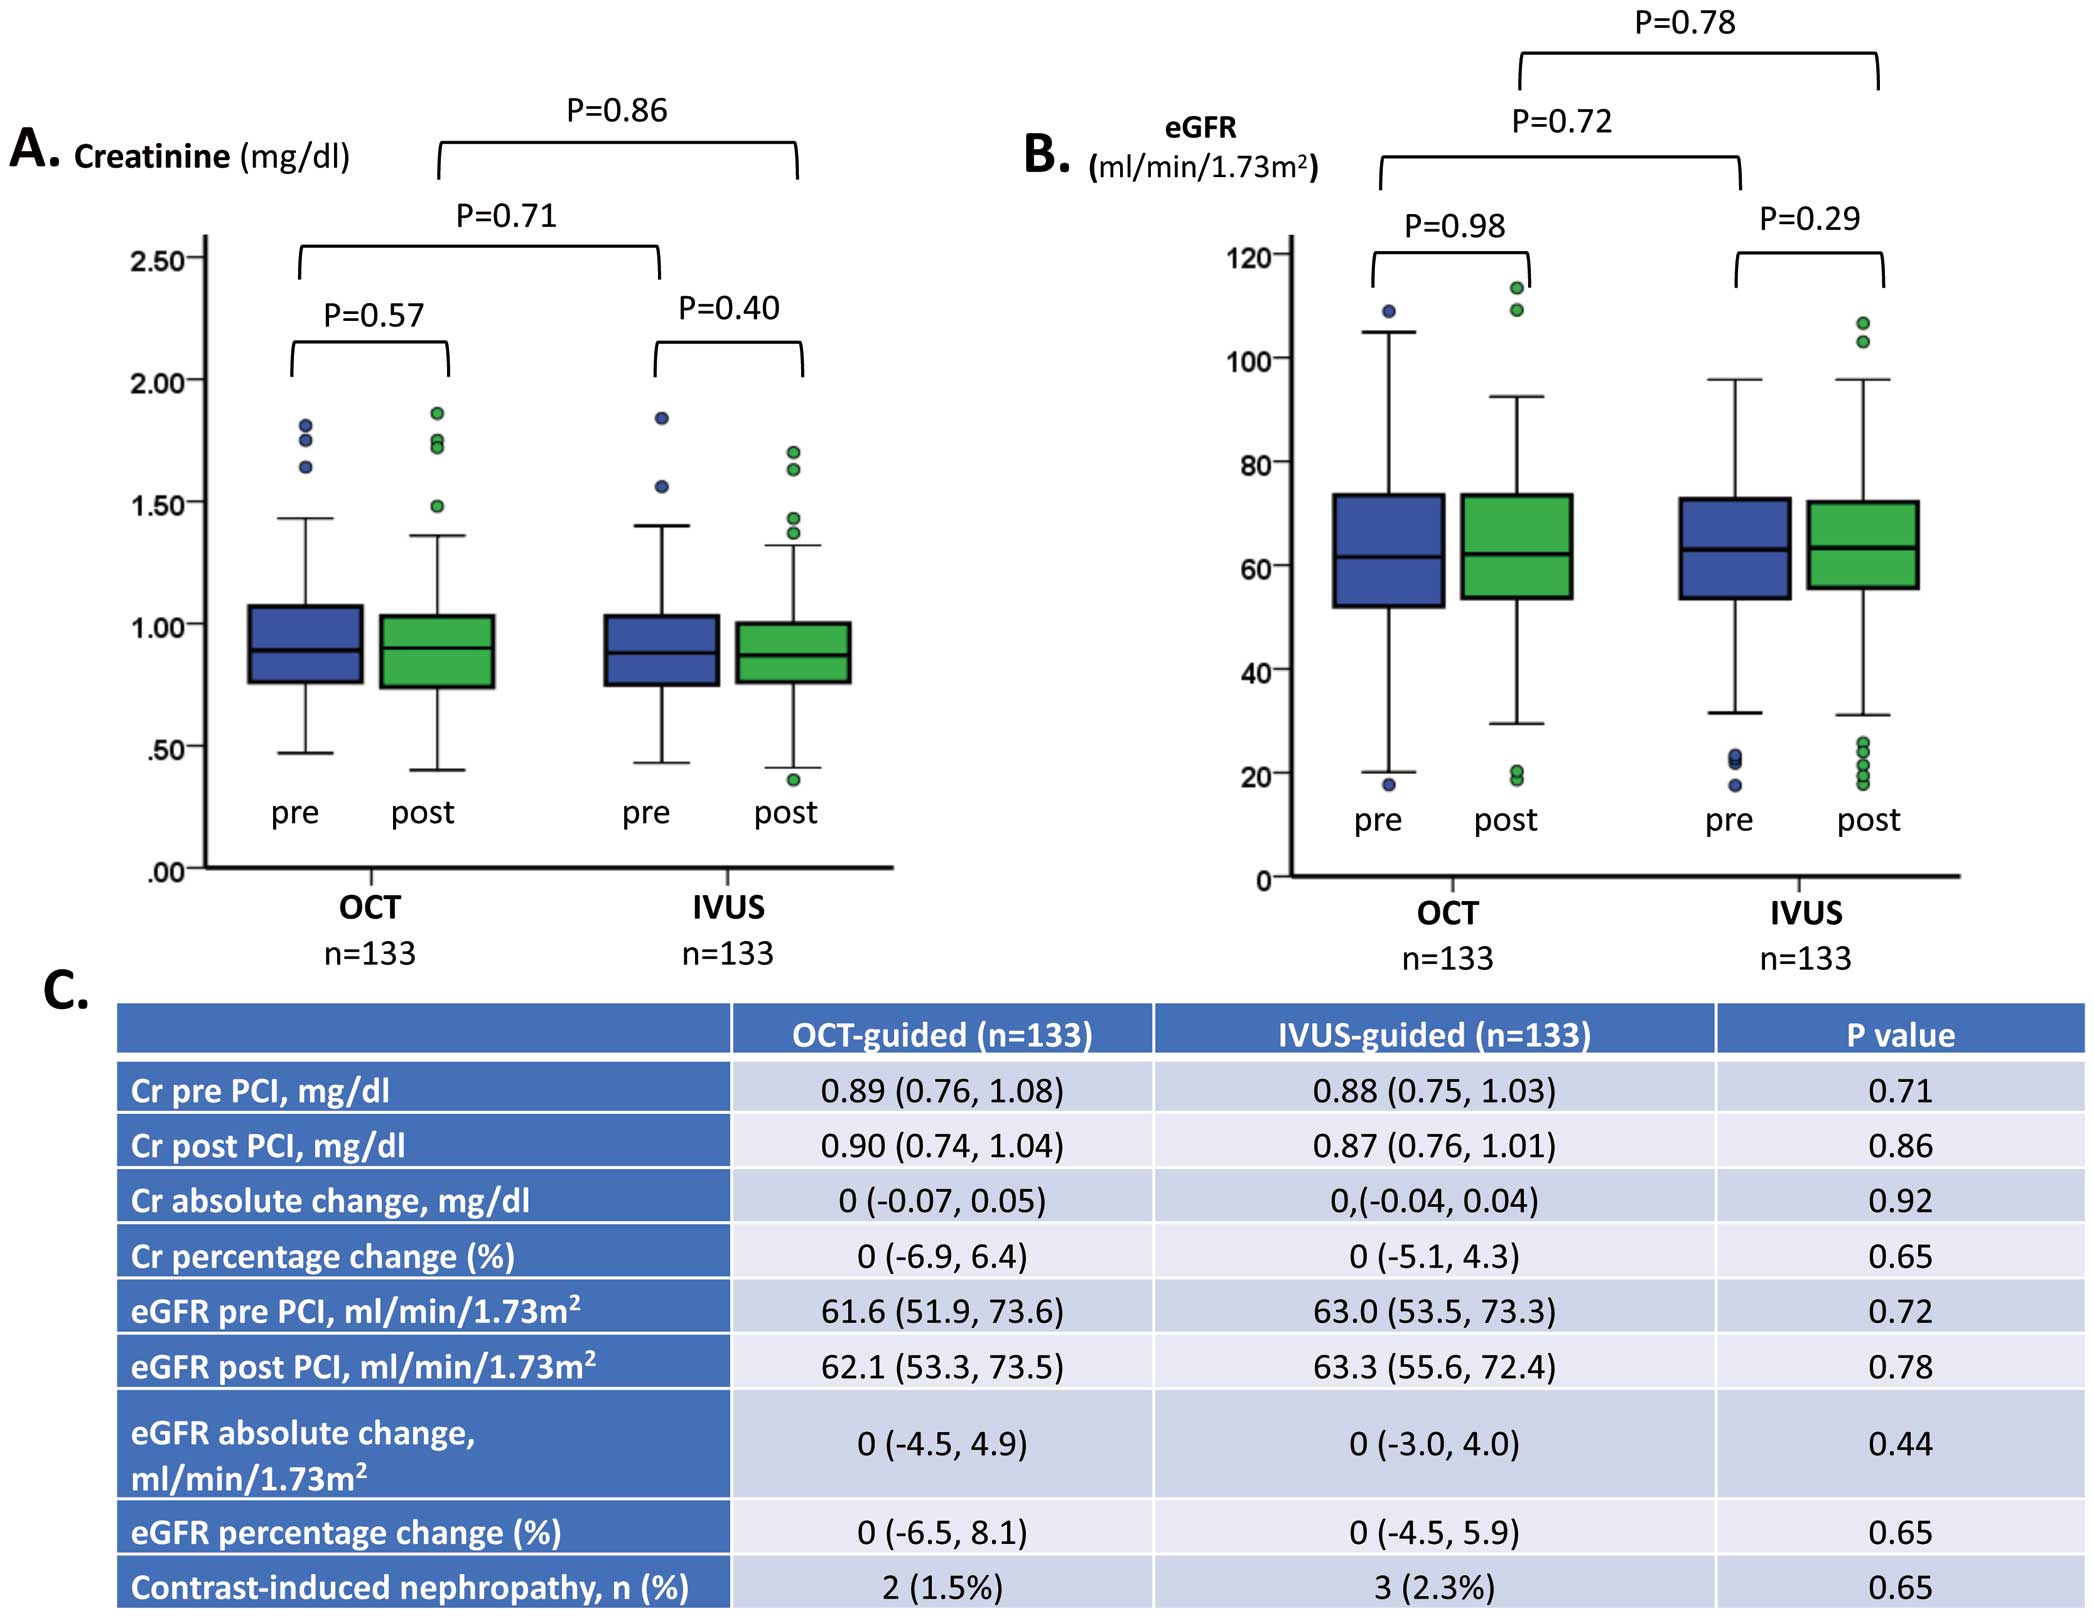
With regard to the primary endpoint, serum creatinine concentrations did not change significantly after the procedure in either group (Figure 2A), nor did eGFR (Figure 2B). Absolute and percentage changes in creatinine concentrations and eGFR did not differ significantly between the 2 groups, and nor did the incidence of CIN (1.5% vs. 2.3% in the OCT and IVUS groups, respectively; P=0.65;
Figure 2C). No anaphylactic reactions occurred in either group.
We also evaluated the changes in serum creatinine concentrations and eGFR according to CKD stage (eGFR ≥60 mL/min/1.73 m2; 60 mL/min/1.73 m2
> eGFR ≥ 45 mL/min/1.73 m2; 45 mL/min/1.73 m2
> eGFR). For each CKD stage, there were no significant differences between the OCT and IVUS groups in the percentage and absolute changes in serum creatinine concentrations and eGFR. Moreover, there were no significant differences in the incidence of CIN between the 2 groups for each CKD stage (Table 3).
Table 3.
Chronic Kidney Disease Stage and Change in Renal Function in Patients Undergoing IVUS- or OCT-Guided PCI
| |
OCT-guided PCI |
IVUS-guided PCI |
P-value |
| eGFR ≥60 mL/min/1.73 m2 |
| No. patients |
69 |
74 |
|
| Cr (mg/dL) |
| Pre-PCI |
0.76 [0.67, 0.87] |
0.80 [0.70, 0.88] |
0.37 |
| Post-PCI |
0.75 [0.69, 0.88] |
0.80 [0.71, 0.90] |
0.28 |
| Absolute change |
0.03 [−0.02, 0.06] |
0.01 [−0.03, 0.05] |
0.39 |
| % Change |
3.3 [−3.2, 9.6] |
1.4 [−3.9, 6.5] |
0.25 |
| eGFR (mL/min/1.73 m2) |
| Pre-PCI |
73.4 [66.1, 82.0] |
71.7 [65.4, 80.0] |
0.46 |
| Post-PCI |
73.4 [64.2, 83.5] |
70.5 [64.0, 78.6] |
0.48 |
| Absolute change |
−2.6 [−6.9 2.8] |
−1.0 [−4.7, 3.4] |
0.18 |
| % Change |
−3.5 [−9.6, 3.6] |
−1.5 [−6.6, 4.5] |
0.25 |
| CIN |
1 (1.4) |
3 (4.1) |
0.35 |
| 60 mL/min/1.73 m2> eGFR ≥ 45 mL/min/1.73 m2 |
| No. patients |
50 |
45 |
|
| Cr (mg/dL) |
| Pre-PCI |
1.04 [0.96, 1.14] |
1.00 [0.88, 1.10] |
0.26 |
| Post-PCI |
1.00 [0.90, 1.12] |
0.99 [0.85, 1.08] |
0.38 |
| Absolute change |
−0.04 [−0.10, 0.01] |
−0.03 [−0.09, 0.0] |
0.68 |
| % Change |
−3.8 [−10.3, 1.0] |
−3.1 [−8.5, 0.0] |
0.84 |
| eGFR (mL/min/1.73 m2) |
| Pre-PCI |
53.6 [50.2, 57.1] |
54.5 [50.6, 57.8] |
0.40 |
| Post-PCI |
56.3 [51.4, 60.4] |
57.6 [51.3, 61.2] |
0.54 |
| Absolute change |
2.1 [−0.6, 6.5] |
1.9 [0.0, 5.6] |
0.88 |
| % Change |
4.4 [−1.1, 12.2] |
3.5 [0.0, 10.2] |
0.84 |
| CIN |
1 (2.0) |
0 (0.0) |
0.34 |
| 45 mL/min/1.73 m2> eGFR |
| No. patients |
14 |
14 |
|
| Cr (mg/dL) |
| Pre-PCI |
1.38 [1.26, 1.76] |
1.31 [1.26, 1.92] |
0.87 |
| Post-PCI |
1.34 [1.23, 1.78] |
1.40 [1.23, 1.91] |
0.84 |
| Absolute change |
0.0 [−8.5, 8.8] |
0.03 [−0.05, 0.08] |
0.91 |
| % Change |
0.0 [−5.0, 9.4] |
1.6 [−4.6, 5.7] |
>0.99 |
| eGFR (mL/min/1.73 m2) |
| Pre-PCI |
39.4 [28.8, 42.4] |
37.1 [23.2, 43.7] |
0.91 |
| Post-PCI |
36.3 [29.5, 42.3] |
35.3 [23.3, 45.1] |
0.87 |
| Absolute change |
0.0 [−4.1, 1.5] |
−0.6 [−2.3, 1.8] |
0.87 |
| % Change |
0.0 [−9.3, 5.8] |
−1.7 [−5.8, 5.4] |
>0.99 |
| CIN |
0 (0.0) |
0 (0.0) |
– |
Unless indicated otherwise, data are expressed as the median [interquartile range] or number of patients (%). CIN, contrast-induced nephropathy; Cr, creatinine. Other abbreviations as in Tables 1,2.
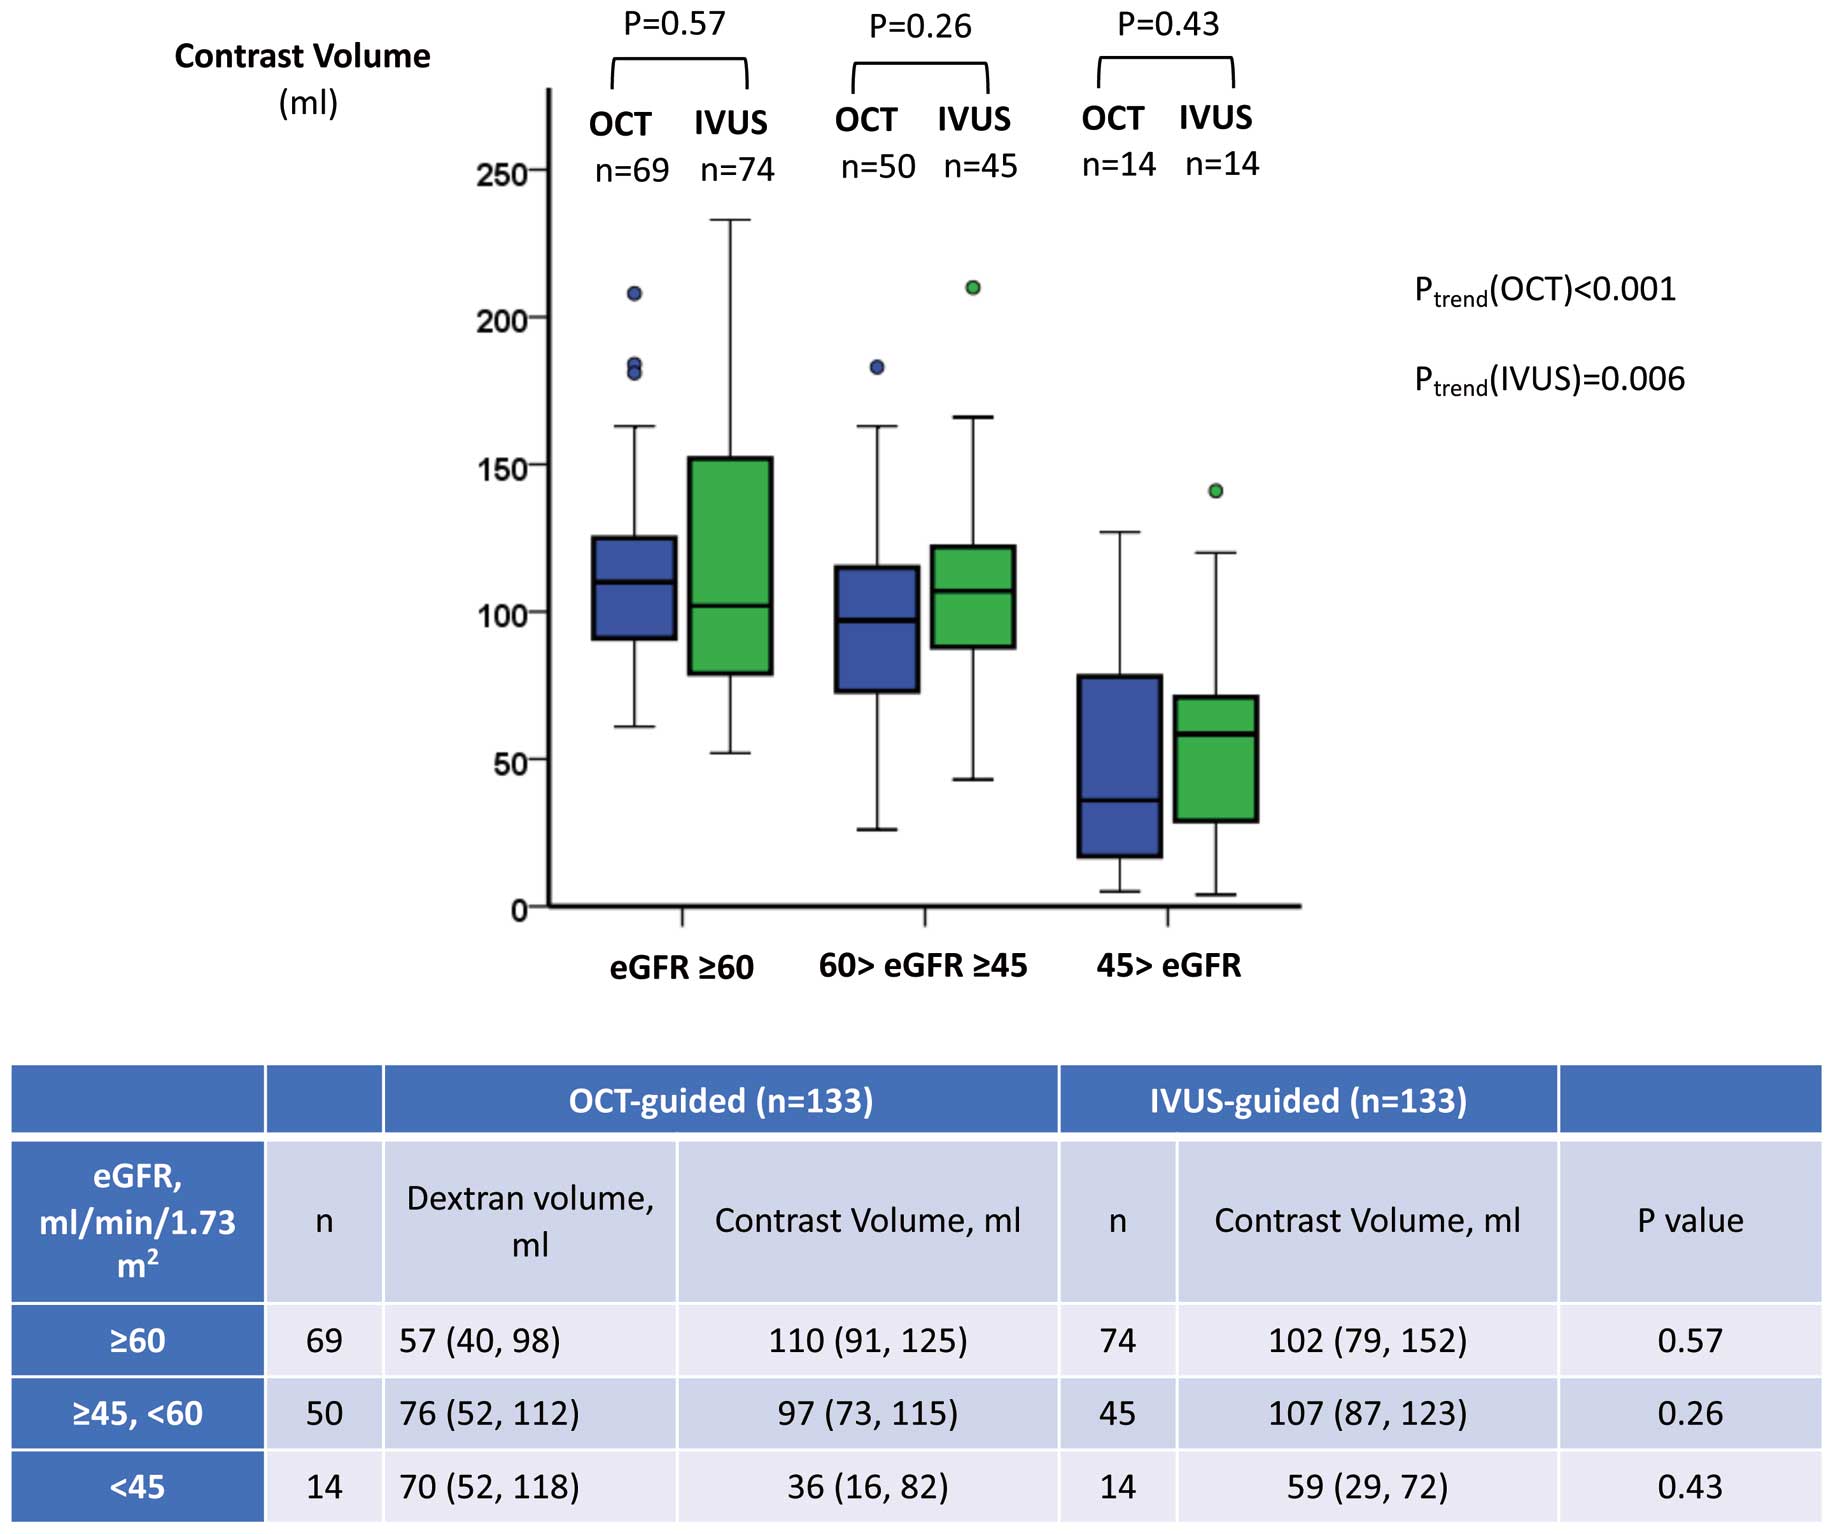
Figure 3
shows the relationship between contrast volume and CKD stage. For each stage, there was no significant difference in contrast volume between the OCT and IVUS groups. The CKD stage was significantly associated with the total amount of contrast volume in both groups (OCT, Ptrend<0.001; IVUS, Ptrend=0.006).
Periprocedural MACE and Long-Term Clinical Outcomes
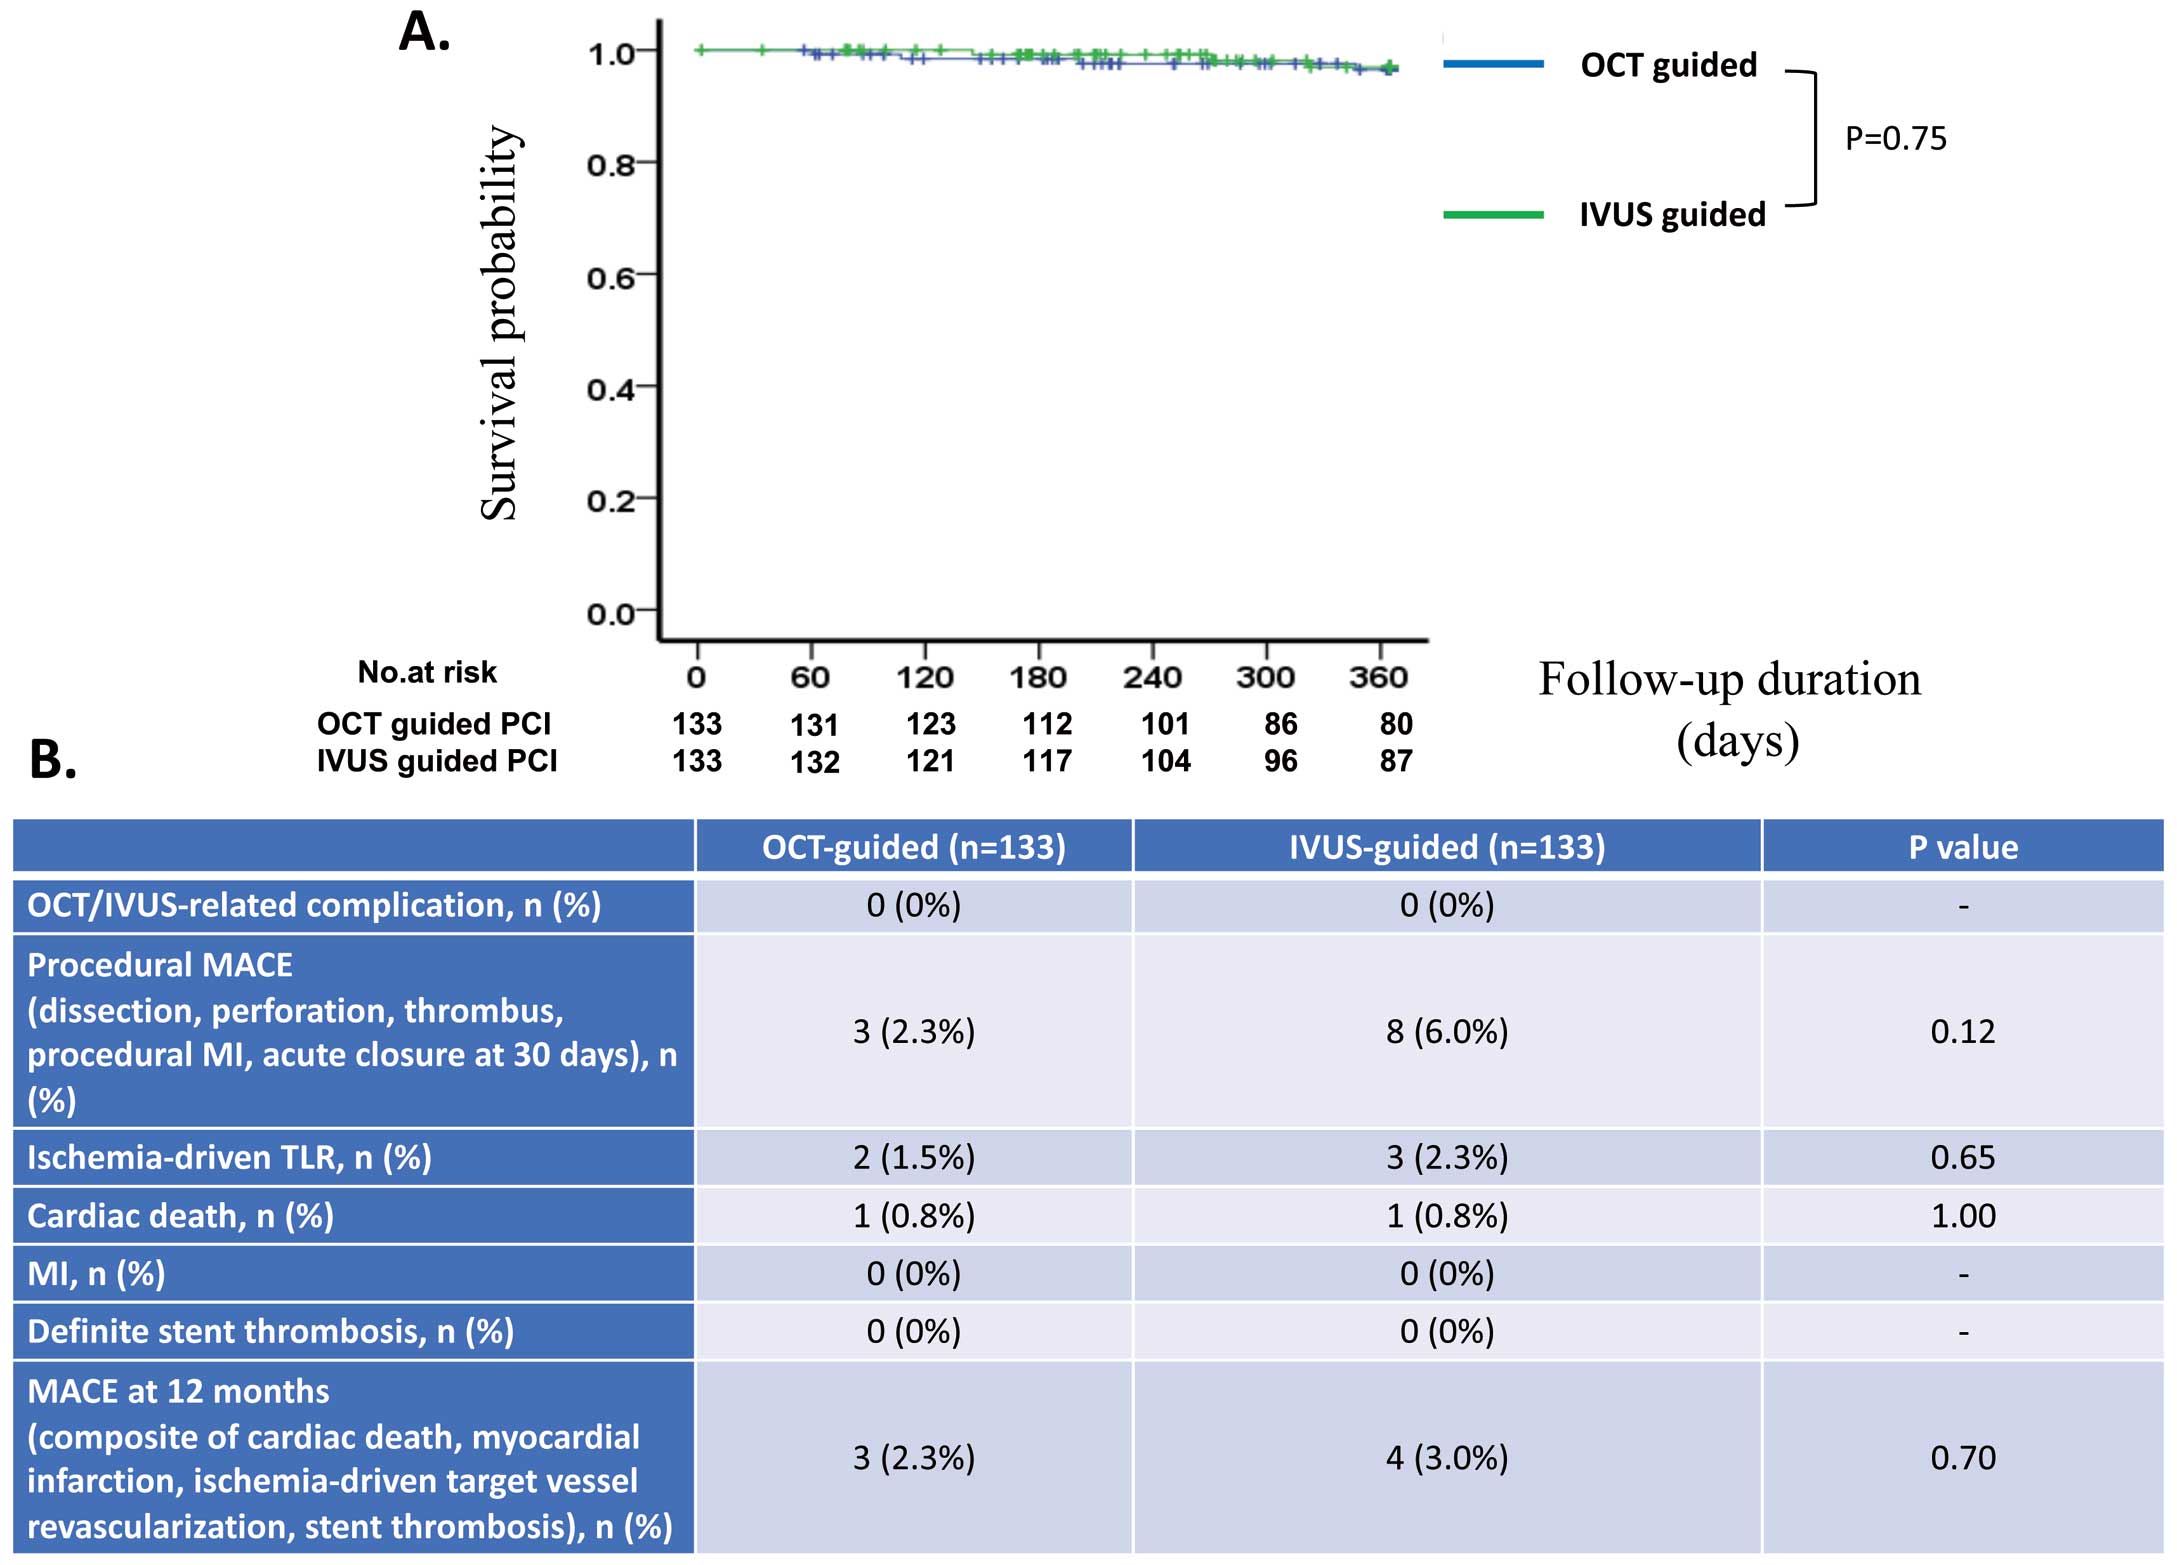
The median follow-up period was 365 days (IQR 250–365 days) in the OCT group and 365 days (IQR 267–365 days) in the IVUS group (P=0.38). We observed no complications related to the OCT or IVUS procedure. The incidence rate of periprocedural MACE did not differ significantly between the 2 groups. The cardiac death, target vessel failure, and MACE rates at 12 months also did not differ significantly between the 2 groups (Figure 4B). Kaplan-Meier analysis at the 12-month follow-up revealed no significant differences in the incidence of MACE between the 2 groups (P=0.75;
Figure 4A). Univariate Cox proportional hazard regression analysis showed that the risk of MACE was equivalent in the 2 groups (HR 0.78; 95% CI 0.18–3.50; P=0.78).
No cases of anaphylaxis, circulatory shock, fatal arrhythmia, and volume overload were observed in patients who underwent OCT-guided PCI using LMWD.
Discussion
This was a study of the safety of dextran OCT in patients with normal renal function and in those with CKD. This study demonstrated that LMWD did not negatively affect the renal function of patients who underwent OCT-guided PCI compared with those who underwent IVUS-guided PCI. To the best of our knowledge, the present study is the first to demonstrate the safety and feasibility of OCT-guided PCI using LMWD in daily practice.
PCI under OCT guidance has the potential benefits of higher resolution, faster pullback speed, improved evaluation of calcium thickness, and superior visualization of stent malapposition and stent edge dissection compared with IVUS guidance.17
In addition, its non-inferiority to IVUS-guided PCI in terms of acute and long-term clinical outcomes has been demonstrated.2,3
However, OCT requires contrast medium to flush blood cells before intracoronary image acquisition, requiring 17–70 mL more than IVUS or angiographic guidance.2,3,18–20
The increase in the volume of contrast medium may lead to CIN, which is associated with increased in-hospital stay and long-term morbidity and mortality.7,8
Several studies have attempted to determine the volumes at which contrast media can be safely used. Laskey et al reported that the contrast volume : creatinine clearance ratio was associated with CIN in patients after elective PCI, with a ratio >3.7 being an independent predictor of CIN.21
Celik et al reported that a contrast volume : eGFR ratio >2 was significantly associated with CIN after primary PCI.22
Moreover, we reported previously that persistent renal dysfunction after primary PCI was independently associated with long-term mortality, and a contrast volume : baseline eGFR ratio >3.45 was an independent predictor of persistent renal dysfunction.23
Previous studies excluded patients with advanced CKD and used contrast media for OCT image acquisition.2,3
The excessive volume of contrast medium required may be a significant limitation of OCT-guided PCI. Hence, an alternative flushing medium is needed.
LMWD is widely used as a plasma substitute because of its beneficial effect on the microcirculation24
and its antithrombogenic properties.25
OCT with LMWD reportedly results in image quality and quantitative assessments equivalent to those obtained using contrast media. In addition, OCT with LMWD has the potential to reduce the total amount of contrast medium used.10,26
OCT image acquisition with LMWD has been used in clinical practice, especially in patients with CKD.11–13
In this study we found no significant difference in the amount of contrast medium used between the 2 groups for each CKD stage. Compared with previous reports,2,3
the total amount of contrast medium used in the present study was relatively small, which could be due to LMWD. Although 17.7% of all pullbacks resulted in insufficient image quality in the OCT-guided PCI with LMWD arm, we were able to acquire optimal OCT images in another pullback with LMWD without increasing contrast volume.
We also found a significant association between CKD stage and the total amount of contrast medium used in both groups. IVUS-guided PCI with minimum contrast medium volume reportedly reduced both CIN and the requirement for renal replacement therapy at 1 year in patients with advanced CKD compared with angiography-guided PCI.6
In the present study, the total amount of contrast medium used was not significantly different between the groups, despite the number of OCT/IVUS pullbacks per patient being greater in the OCT group. Moreover, the total contrast volume used in patients with an eGFR <45 mL/min/1.73 m2
did not differ between the 2 groups. Therefore, LMWD was able to minimize the volume of contrast medium used with respect to eGFR stage, which could help prevent CIN. The results of the present study suggest that, in patients with advanced CKD, a contrast-sparing approach similar to that used during IVUS-guided PCI would be feasible during OCT-guided PCI using LMWD.
However, the effect of LMWD on renal function remains unclear. Anuric acute renal failure after the administration of LMWD has been reported.14,15
It has been speculated that dextran-induced acute renal failure may be caused by an increase in plasma oncotic pressure, which decreases filtration pressure and, consequently, the glomerular filtration rate.14
Moreover, coadministration of dextran and contrast medium may predispose patients to acute renal failure, especially those with pre-existing renal dysfunction.27
However, Seeliger et al reported that the LMWD itself was not nephrotoxic.28
Moreover, an experimental study showed that LMWD protects against ischemia-reperfusion injury of the kidney.29
In previous case reports, the total amount of dextran administered in patients who subsequently developed acute renal failure varied from 50 to 1,000 g,30
whereas a median of 6.4 g was used in the present study. It may be speculated that a relatively low dose of dextran would not affect renal function. Moreover, periprocedural hydration therapy may play a role in preventing acute renal failure. Although we observed no cases of anuria following the use of dextran, close monitoring of urine output and renal function is mandatory after these procedures.
There are different types of clinically available LMWD, with lactate or glucose added. Low Molecular Dextran L Injection consists of LMWD 40 and lactate and sodium (130 mmol/L), chloride (109 mmol/L), and potassium (4 mmol/L). Conversely, LMWD with added glucose contains no electrolytes. In the present study, we observed no fatal cardiac arrhythmia during OCT image acquisition. It could be speculated that because Low Molecular Dextran L contains potassium, it could contribute to the prevention of cardiac arrhythmias during coronary injection. In a previous study, the incidence rate of anaphylactic reactions to LMWD was reported to be 0.6%.31
Although we observed no case of anaphylaxis, circulatory shock, or volume overload in the LMWD-guided OCT group, we should be attentive to possible side effects when using LMWD for OCT image acquisition.
Study Limitations
Several study limitations need to be considered. First, the present study was a single-center, retrospective, observational study. The primary endpoint of the study was the change in serum creatinine concentration, and analysis showed that this study had a power >0.99 with the present sample size. However, we found no significant differences in the incidence of CIN and clinical outcomes between the OCT and IVUS groups, which may be because the study was underpowered. This study may stimulate the design and planning of further large randomized controlled trials to definitively determine the effectiveness of OCT guidance with LMWD, which may be a promising therapeutic option in patients with renal impairment.
The cause-effect relationship between imaging modality and outcome could not be assessed fully in this study because the imaging approach was selected at the discretion of the physician. However, the use of propensity score matching reduced the effect of modality selection bias and possible confounders. Nevertheless, other confounding factors that were not investigated could have affected the outcomes, and thus overestimation of the effect of OCT-guided PCI due to the limited number of events cannot be ruled out. A larger controlled, prospective, multicenter trial is required to confirm our findings.
Second, we used LMWD with contrast medium for OCT-guided PCI and only contrast medium for IVUS-guided PCI. Although the total volume of the contrast medium used in each group did not differ significantly, its use may have masked the effect of LMWD on renal function.
Conclusions
The present study is the first to demonstrate that a small amount of LMWD administered for OCT image acquisition does not negatively affect renal function. Using LMWD, OCT-guided PCI could be feasible in patients with CKD.
Acknowledgments
The authors are grateful to all the investigators and data management administrators for their contributions to the study, and to Mutsumi Tanaka (Department of Cardiovascular Medicine, Miyazaki Prefecture Nobeoka Hospital, Miyazaki, Japan).
Sources of Funding
This work received no support from any funding agency in the public, commercial, or not-for-profit sectors.
Disclosures
K. Tsujita has received honoraria from Bayer Yakuhin, Ltd., Daiichi Sankyo Co., Ltd., Kowa Pharmaceutical Co., Ltd., MSD K.K., Sanofi K.K., and Takeda Pharmaceutical Co., Ltd.; trust research/joint research funds from AstraZeneca K.K., Sugi Bee Garden, and Japan Medical Device Technology Co., Ltd.; and grants from ITI Co., Ltd., Astellas Pharma Inc, Abbott Vascular Japan Co., Ltd., Otsuka Pharmaceutical Co., Ltd., Kaneka Medix Co., Ltd., Goodman Co., Ltd., GM Medical Co., Ltd., Daiichi Sankyo Co., Ltd., Takeda Pharmaceutical Co., Ltd., Mitsubishi Tanabe Pharma, Chugai Pharmaceutical Co., Ltd., TERUMO Co., Ltd., Boehringer Ingelheim Japan, Medtronic Japan Co., Ltd., Japan Lifeline Co., Ltd., Novartis Pharma KK., Fides-One, Inc., Bristol-Myers K.K., Boston Scientific Japan K.K., Cardinal Health Japan, and MSD K.K. K. Sakamoto has received trust research/joint research funds from Daiichi Sankyo. The other authors have nothing to disclose.
Data Availability
The data supporting the findings of this study are available from the corresponding author upon reasonable request.
References
- 1.
Bezerra HG, Costa MA, Guagliumi G, Rollins AM, Simon DI. Intracoronary optical coherence tomography: A comprehensive review: Clinical and research applications. JACC Cardiovasc Interv 2009; 2: 1035–1046.
- 2.
Ali ZA, Maehara A, Généreux P, Shlofmitz RA, Fabbiocchi F, Nazif TM, et al. Optical coherence tomography compared with intravascular ultrasound and with angiography to guide coronary stent implantation (ILUMIEN III: OPTIMIZE PCI): A randomised controlled trial. Lancet 2016; 388: 2618–2628.
- 3.
Kubo T, Shinke T, Okamura T, Hibi K, Nakazawa G, Morino Y, et al. Optical frequency domain imaging vs. intravascular ultrasound in percutaneous coronary intervention (OPINION trial): One-year angiographic and clinical results. Eur Heart J 2017; 38: 3139–3147.
- 4.
Senoo T, Motohiro M, Kamihata H, Yamamoto S, Isono T, Manabe K, et al. Contrast-induced nephropathy in patients undergoing emergency percutaneous coronary intervention for acute coronary syndrome. Am J Cardiol 2010; 105: 624–628.
- 5.
Sgura FA, Bertelli L, Monopoli D, Leuzzi C, Guerri E, Spartà I, et al. Mehran contrast-induced nephropathy risk score predicts short- and long-term clinical outcomes in patients with ST-elevation-myocardial infarction. Circ Cardiovasc Interv 2010; 3: 491–498.
- 6.
Sakai K, Ikari Y, Nanasato M, Umetsu H, Okutsu M, Takikawa T, et al. Impact of intravascular ultrasound-guided minimum-contrast coronary intervention on 1-year clinical outcomes in patients with Stage 4 or 5 advanced chronic kidney disease. Cardiovasc Interv Ther 2019; 34: 234–241.
- 7.
McCullough PA, Wolyn R, Rocher LL, Levin RN, O’Neill WW. Acute renal failure after coronary intervention: Incidence, risk factors, and relationship to mortality. Am J Med 1997; 103: 368–375.
- 8.
Rihal CS, Textor SC, Grill DE, Berger PB, Ting HH, Best PJ, et al. Incidence and prognostic importance of acute renal failure after percutaneous coronary intervention. Circulation 2002; 105: 2259–2264.
- 9.
Kuji S, Kosuge M, Kimura K, Nakao K, Ozaki Y, Ako J, et al. Impact of acute kidney injury on in-hospital outcomes of patients with acute myocardial infarction: Results from the Japanese Registry of Acute Myocardial Infarction Diagnosed by Universal Definition (J-MINUET) substudy. Circ J 2017; 81: 733–739.
- 10.
Ozaki Y, Kitabata H, Tsujioka H, Hosokawa S, Kashiwagi M, Ishibashi K, et al. Comparison of contrast media and low-molecular-weight dextran for frequency-domain optical coherence tomography. Circ J 2012; 76: 922–927.
- 11.
Azzalini L, Mitomo S, Hachinohe D, Regazzoli D, Colombo A. Zero-contrast percutaneous coronary intervention guided by dextran-based optical coherence tomography. Can J Cardiol 2018; 34: 342.e1–342.e3.
- 12.
Galougahi KK, Zalewski A, Leon MB, Karmpaliotis D, Ali ZA. Optical coherence tomography-guided percutaneous coronary intervention in pre-terminal chronic kidney disease with no radio-contrast administration. Eur Heart J 2016; 37: 1059.
- 13.
Vasu N, Subban V, Ajit Mullasari S. Zero contrast optical coherence tomography-guided percutaneous coronary intervention for in-stent restenosis of the saphenous vein graft using a non-contrast flush medium. Indian Heart J 2018; 70(Suppl 3): S492–S495.
- 14.
Ferraboli R, Malheiro PS, Abdulkader RCRM, Yu L, Sabbaga E, Burdmann EA. Arturic acute renal failure caused by dextran 40 administration. Ren Fail 1997; 19: 303–306.
- 15.
Morgan TO, Little JM, Evans WA. Renal failure associated with low-molecular-weight dextran infusion. Br Med J 1966; 2: 737–739.
- 16.
Kubo T, Shinke T, Okamura T, Hibi K, Nakazawa G, Morino Y, et al. Optical frequency domain imaging vs. intravascular ultrasound in percutaneous coronary intervention (OPINION trial): Study protocol for a randomized controlled trial. J Cardiol 2016; 68: 455–460.
- 17.
Maehara A, Matsumura M, Ali ZA, Mintz GS, Stone GW. IVUS-guided versus OCT-guided coronary stent implantation: A critical appraisal. JACC Cardiovasc Imaging 2017; 10: 1487–1503.
- 18.
Habara M, Nasu K, Terashima M, Kaneda H, Yokota D, Ko E, et al. Impact of frequency-domain optical coherence tomography guidance for optimal coronary stent implantation in comparison with intravascular ultrasound guidance. Circ Cardiovasc Interv 2012; 5: 193–201.
- 19.
Prati F, Di Vito L, Biondi-Zoccai G, Occhipinti M, La Manna A, Tamburino C, et al. Angiography alone versus angiography plus optical coherence tomography to guide decision-making during percutaneous coronary intervention: The Centro per la Lotta contro l’Infarto-Optimisation of Percutaneous Coronary Intervention (CLI-OPCI) study. EuroIntervention 2012; 8: 823–829.
- 20.
Meneveau N, Souteyrand G, Motreff P, Caussin C, Amabile N, Ohlmann P, et al. Optical coherence tomography to optimize results of percutaneous coronary intervention in patients with non-ST-elevation acute coronary syndrome. Circulation 2016; 134: 906–917.
- 21.
Laskey WK, Jenkins C, Selzer F, Marroquin OC, Wilensky RL, Glaser R, et al. Volume-to-creatinine clearance ratio. A pharmacokinetically based risk factor for prediction of early creatinine increase after percutaneous coronary intervention. J Am Coll Cardiol 2007; 50: 584–590.
- 22.
Celik O, Ozturk D, Akin F, Ayca B, Yalcln AA, Erturk M, et al. Association between contrast media volume-glomerular filtration rate ratio and contrast-induced acute kidney injury after primary percutaneous coronary intervention. Angiology 2015; 66: 519–524.
- 23.
Kurogi K, Ishii M, Sakamoto K, Komaki S, Marume K, Kusaka H, et al. Persistent renal dysfunction in patients undergoing primary percutaneous coronary intervention for acute myocardial infarction. J Am Heart Assoc 2019; 8: e014096.
- 24.
Klar E, Herfarth C, Messmer K. Therapeutic effect of isovolemic hemodilution with dextran 60 on the impairment of pancreatic microcirculation in acute biliary pancreatitis. Ann Surg 1990; 211: 346–353.
- 25.
Gruber UF. Dextran and the prevention of postoperative thromboembolic complications. Surg Clin North Am 1975; 55: 679–696.
- 26.
Frick K, Michael TT, Alomar M, Mohammed A, Rangan BV, Abdullah S, et al. Low molecular weight dextran provides similar optical coherence tomography coronary imaging compared to radiographic contrast media. Catheter Cardiovasc Interv 2014; 84: 727–731.
- 27.
Kato A, Yonemura K, Matsushima H, Ikegaya N, Hishida A. Complication of oliguric acute renal failure in patients treated with low-molecular weight dextran. Ren Fail 2001; 23: 679–684.
- 28.
Seeliger E, Flemming B, Wronski T, Ladwig M, Arakelyan K, Godes M, et al. Viscosity of contrast media perturbs renal hemodynamics. J Am Soc Nephrol 2007; 18: 2912–2920.
- 29.
Semercioz A, Temiz MZ, Erbarut I, Izol U, Aykan S, Tuken M, et al. Intravenous dextran 70 infusion has protective effects on ischemia reperfusion injury of kidney: An experimental study. Minerva Urol Nefrol 2018; 70: 202–210.
- 30.
Feest TG. Low molecular weight dextran: A continuing cause of acute renal failure. Br Med J 1976; 2: 1300.
- 31.
Brown RIG, Aldridge HE, Schwartz L, Henderson M, Brooks E, Coutanche M. The use of dextran-40 during percutaneous transluminal coronary angioplasty: A report of three cases of anaphylactoid reactions – one near fatal. Cathet Cardiovasc Diagn 1985; 11: 591–595.