Cardiac Rehabilitation
Relevance of Physical Fitness and Cardiovascular Disease Risk
2021 年 85 巻 5 号 p. 623-630

詳細
2021 年 85 巻 5 号 p. 623-630
Background: This study explored the relationship between fitness performance, in terms of muscular endurance and cardiorespiratory fitness (CRF), and cardiovascular disease (CVD) risk.
Methods and Results: The study was performed on 51,500 eligible participants from the Republic of China Armed Forces. Participants were divided into 4 groups (obese or non-obese males and females). Correlations between the Framingham risk score of coronary artery disease (FRS-CAD) and physical fitness (evaluated using 2-min push-ups, 2-min sit-ups, and 3,000-m non-weight-bearing running tests) were calculated using univariate and multivariate linear regression, as well as an extended model that adjusted for covariates. In males, regardless of obesity status, there were significant negative correlations between quartiles of fitness performance and the FRS-CAD (P<0.001) in the unadjusted and adjusted models, except for the sit-up test in the model adjusted for age, serum uric acid, hemoglobin, creatinine, current drinking, betel nut chewing, and running test speed. FRS-CAD was lower for higher quartiles of physical fitness (P for trend <0.001) in male participants. However, no significant relationship between fitness performance and FRS-CAD was observed in females, regardless of obesity status.
Conclusions: The findings highlighted a substantial association between fitness performance and FRS-CAD, especially in adult males. Muscular endurance and CRF may be a convenient risk evaluation tool for future CVD risk in the general, healthy, young to middle-aged male population in Taiwan.
Cardiovascular disease (CVD) remains a leading cause of mortality in adults worldwide.1 Assessment of future risk of CVD had been recognized a major issue for a long time. Numerous investigations have revealed that the risk of CVD is closely related to traditional risk factors, such as age, male sex, body weight, high blood pressure, hyperglycemia, hyperlipidemia, cigarette smoking, and a family history of premature atherosclerotic CVD.2–4 Among the different methods established to predict the risk of CVD, the Framingham risk score of coronary artery disease (FRS-CAD) is a simple way to predict the future risk of coronary artery disease (CAD).5 In recent studies, the future risk of CVD had also been shown to be inversely associated with cardiorespiratory fitness (CRF) and muscular strength, which are components of physical fitness.6–8
Physical fitness is one of the strongest predictors of individual future health status.2 The health-related components of physical fitness include cardiorespiratory endurance, muscular endurance, muscular strength, body composition, and flexibility.6 Considerable effort has been focused on the association between physical fitness and cause-specific mortality, including CVD.9,10 The muscular strength, endurance, and power in youth and adolescents have been shown to be inversely associated with clustered CVD risk.2,11 In a cohort study to determine the interactive effects of fitness and body mass index (BMI), poor fitness and obesity were independently associated with a higher risk of heart failure at the age of 18 years.12 From the Aerobics Center Longitudinal Study, a low fitness level in men with diabetes was associated with an increased risk of CVD mortality within the normal weight and overweight groups.13 However, the roles of sex and obesity in the association between fitness and CVD risk have not been explored in great detail.
However, studies focusing on the independent effect of muscular endurance on the CVD risk in generally healthy adults are limited.14 The sit-up test can be used to estimate the extent of muscular endurance, but may not be the most optimal approach.6,15 A higher push-up capacity is associated with a lower risk of CVD events in active adult males.16 However, to the best of our knowledge, thus far no study has assessed future CVD risk using both the push-up and sit-up tests. Given that only limited studies have investigated the risk of future CVD in a healthy population by assessing CRF and muscle endurance, it is important to explore these 2 aspects of physical fitness for future CVD risk in a general healthy population. Thus, in the present study we investigated the association between muscular endurance and future CVD risk using data collected from general healthy participants in 2015.
The present retrospective cross-sectional survey was conducted on a nationally representative sample, with demographic, clinical, behavioral, and laboratory data regarding the health and nutritional status collected for individuals in the Republic of China Armed Forces. The study protocol was approved by the Institutional Review Board (IRB) of Tri-Service General Hospital in Taiwan in accordance with the Declaration of Helsinki. The IRB granted a waiver for the need for informed consent for the study because the study used deidentified past records of physical fitness performance and pertinent information.
ParticipantsData were obtained for adults aged ≥20 years from the Republic of China Armed Forces during 2015. Participants with missing information, such as demographic and laboratory data for the Framingham score of cardiovascular risk, and those with severe chronic medical disorders or documented disabilities were excluded from the study. Thus, data from 51,500 participants was analyzed.
Assessment of Physical FitnessPhysical fitness was assessed using 3 tests that were conducted in a single day, namely the 2-minute push-up, 2-minute sit-up, and endurance 3,000-m non-weight-bearing running exercise tests. The first 2 tests were performed on a soft mat, and all 3 tests were simultaneously recorded and supervised by military personnel with infrared sensors (PROVIEW Global, Taipei, Taiwan). The maximum number of sit-ups and push-ups performed in 2 min was used to represent muscle endurance. The starting position for the sit-up test is sitting on a mat with knees bent and feet flat on the mat. Participants were asked to place both their hands over their ears. During the sit-up test, participants had to touch their elbows to their thighs which, to which artificial sensors had been attached. Complete sit-ups were only counted when a participant’s shoulders returned to the initial resting set level, keeping hips and buttocks flat on the ground.
For the push-up test, participants were asked to start in an initial position facing the mat with their shoulders, buttocks, and legs in a line, their arms straight and their hands placed flat on the mat shoulder-width apart, or a little bit wider. Then, participants lowered themselves by bending their elbows to a level where their chin was approximately 20 cm above the mat. A completed push-up was counted when the participants returned back to their initial level/starting position. Of note, the push-up test was stopped at once, before the end of the 2-min period, if any other part of the body touched the mat. The push-up test data were collected using an infrared sensor (PROVIEW Global). There was a recovery period of at least 10 min between the sit-up and push-up tests.
CRF was assessed by the endurance 3,000-m non-weight-bearing running exercise test. These tests were conducted on the flat playground of military physical training centers in the afternoon, and the whole course was video recorded.
Assessment of CVD RiskThe FRS-CAD was derived from the Framingham Heart Study. The FRS-CAD score was derived using the following variables: age, hypertension (systolic blood pressure ≥140 mmHg, diastolic blood pressure ≥90 mmHg, or the use of antihypertensive medication), smoking, diabetes, elevated cholesterol, and high-density lipoprotein cholesterol (HDL-C). These risk factors were evaluated using a score sheet to determine a point value that could be summed and interpreted as an overall 10-year risk of CAD.
Measurement of CovariatesBlood samples were obtained after at least an 8-h fast. BMI was calculated as body weight (kg) divided by height squared (m2). According to the Taiwan’s Health Promotion Administration, Ministry of Health and Welfare,17 BMI ≥27 kg/m2 is considered obese, and so we chose this value as a cut-off point for obesity and non-obesity. Information regarding cigarette smoking, alcohol drinking, and betel nut chewing was obtained using questionnaires. Correlation tables were constructed including all critical variables. Factors of interest, like demographic information, cigarette use, and medical histories, were assessed using questionnaires. Based on the correlations and previous evidence, we used directed acyclic graph (DAG) analysis to evaluate the causal inferences of the variables listed in Table 1, reducing the degree of bias for the effect estimate (Figure).18 A causal DAG is one in which the arrows can be interpreted as causal relationships. DAGs have been used in epidemiology as a structured way to present an overview of the causal research question and its context.18,19
| Males | Females | Total (n=51,500) |
P value | |||
|---|---|---|---|---|---|---|
| Non-obese (n=38,115) |
Obese (n=10,453) |
Non-obese (n=2,679) |
Obese (n=253) |
|||
| Continuous variables | ||||||
| Age (years) | 24.0 [7.0] | 27.0 [10.0] | 39.0 [4.0] | 37.0 [2.0] | 24.0 [8.0] | <0.001 |
| Serum UA (mg/dL) | 6.40 [2.00] | 7.10 [2.00] | 4.40 [1.00] | 5.30 [1.00] | 6.40 [2.00] | <0.001 |
| Serum Hb (mg/dL) | 15.30 [1.00] | 15.40 [1.00] | 13.10 [2.00] | 13.20 [2.00] | 15.30 [1.00] | <0.001 |
| Serum Cr (mg/dL) | 0.92 [0] | 0.94 [0] | 0.70 [1.17] | 0.71 [0] | 0.92 [0] | <0.001 |
| No. push-ups | 51.0 [16.0] | 43.0 [25.0] | 26.0 [11.0] | 27.0 [6.0] | 50.00 [20.0] | <0.001 |
| No. sit-ups | 45.0 [8.0] | 44.0 [7.0] | 30.0 [6.0] | 30.0 [4.0] | 45.0 [8.0] | <0.001 |
| Time to run 3 km (s) | 846 [96.0] | 909.0 [151.0] | 1,090.0 [127.0] | 1,118.0 [135.0] | 853.0 [108.0] | <0.001 |
| Categorical variables (%) | ||||||
| Ever had hypertension | 0.4 | 1.8 | 0.4 | 1.6 | 0.7 | <0.001 |
| Current smoker | 27.5 | 29.5 | 3.2 | 3.2 | 26.6 | <0.001 |
| Current drinker | 23.1 | 28.7 | 5.2 | 5.5 | 23.2 | <0.001 |
| Betel nut chewing | 4.6 | 7.1 | 0.1 | 0.8 | 4.9 | <0.001 |
A body mass index (BMI) of 27 kg/m2 was used to divide male and female participants into obese (≥27 kg/m2) and non-obese (BMI <27 kg/m2) groups. Continuous variables are given as the median [interquartile range]. Cr, creatinine; Hb, hemoglobin; UA, uric acid.
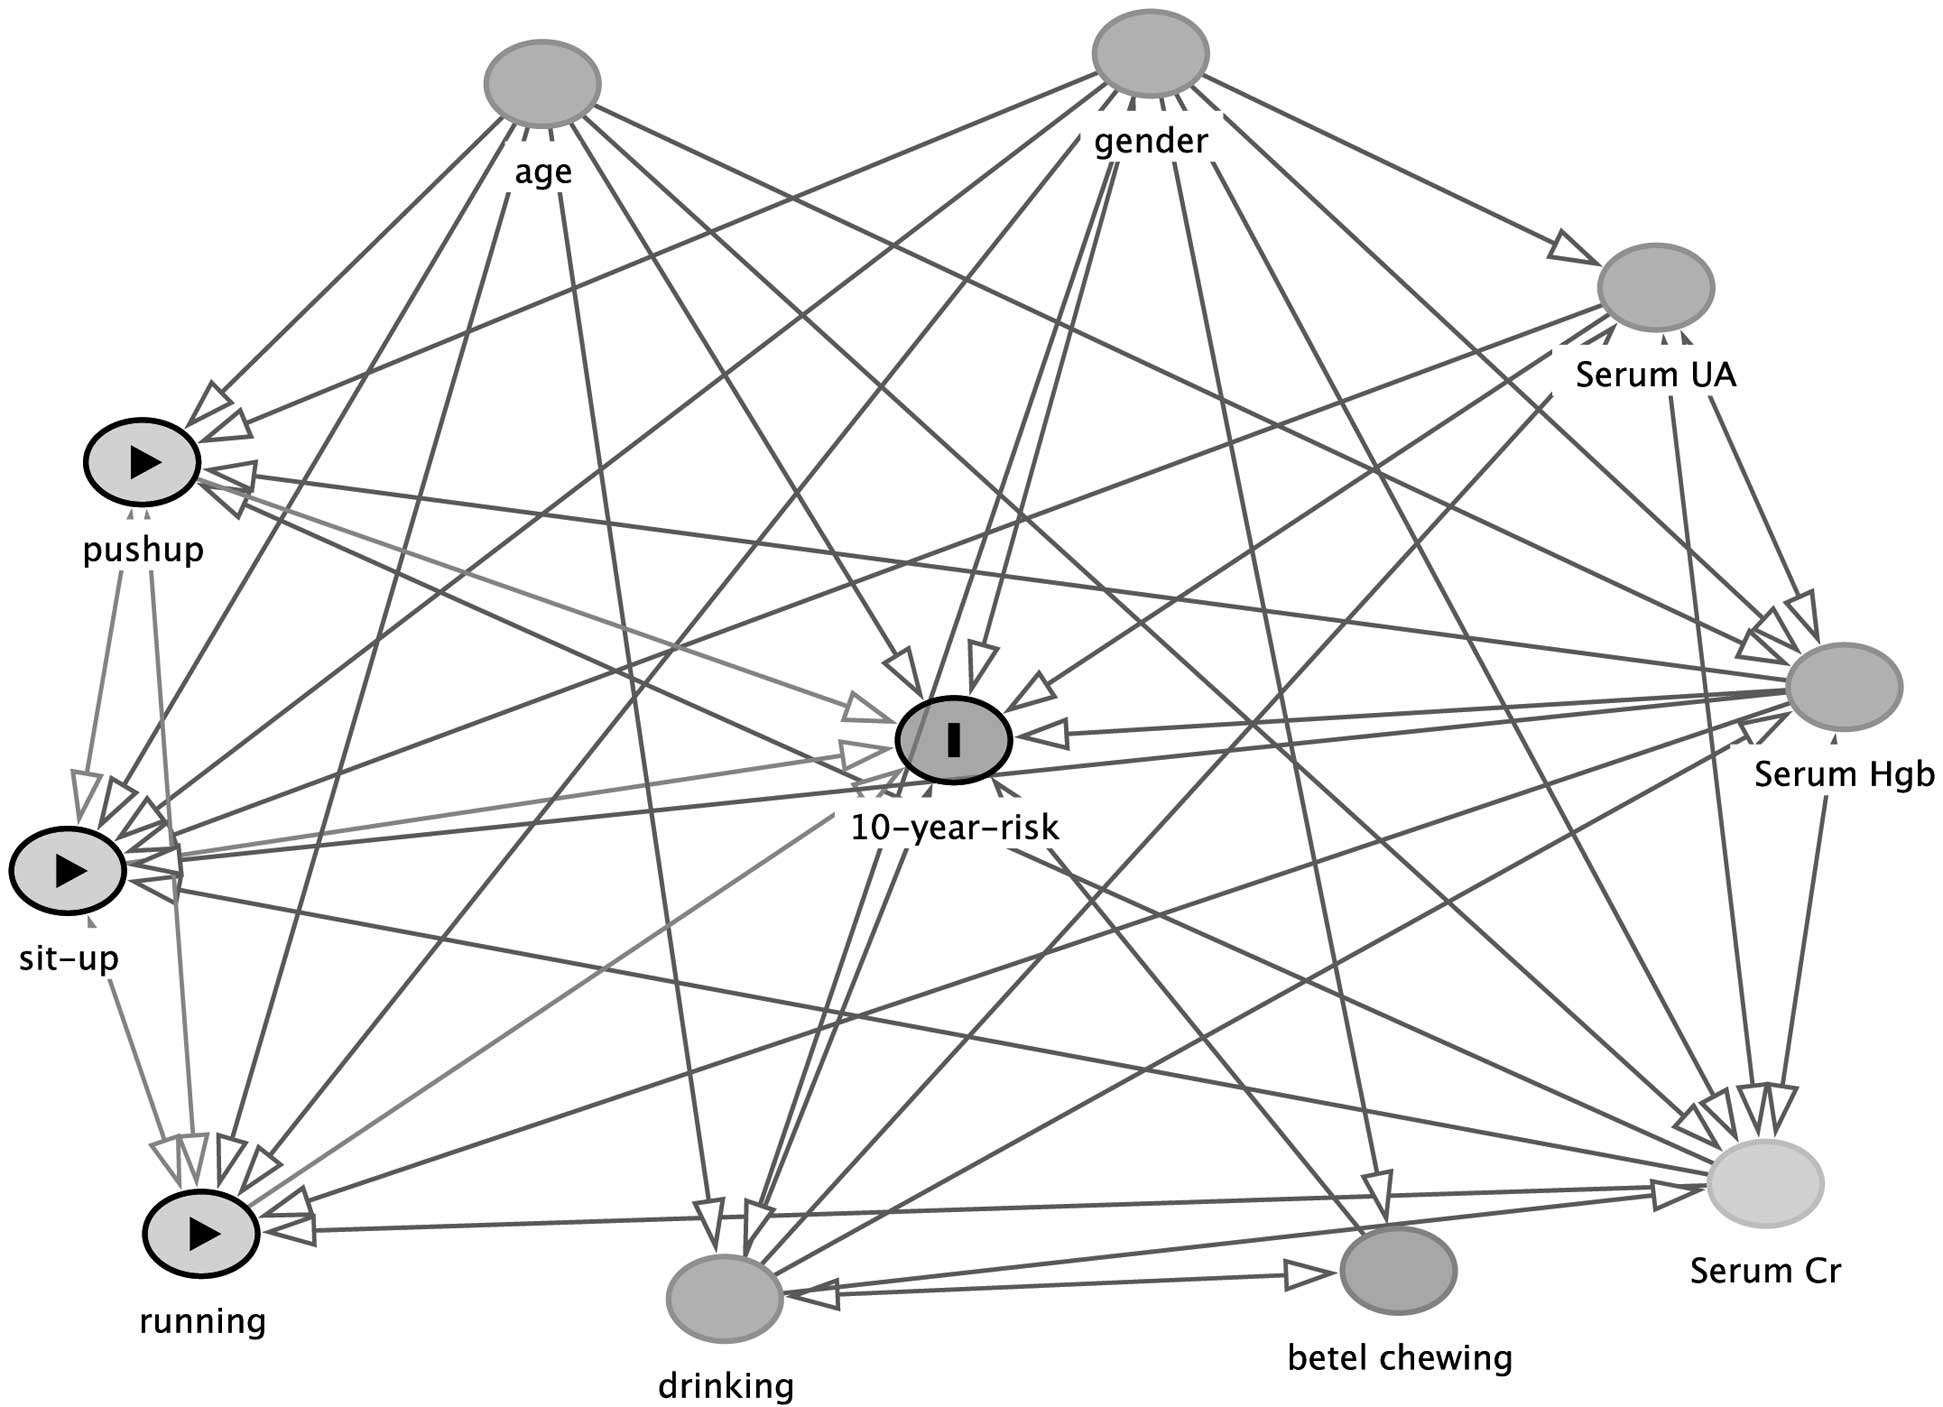
Directed acyclic graph. Cr, creatinine; Hb, hemoglobin; UA, uric acid.
Associations between physical fitness and the 10-year CVD risk in the 4 groups (male and female obese and non-obese individuals) were evaluated using multivariable linear regression models (Tables 2–5). Model 1 was unadjusted, Model 2 was adjusted for age, and Model 3 was further adjusted for serum uric acid, serum hemoglobin, and serum creatinine concentrations, current drinking, betel nut chewing status, and speed in the running test (m/s). All analyses in the present study were conducted using the SPSS version 22.0 for Windows (SPSS Inc., Chicago, IL, USA). Two-sided P≤0.05 was considered significant.
| Push-ups | Sit-ups | 3-km running test | ||||
|---|---|---|---|---|---|---|
| β (95% CI) | P value | β (95% CI) | P value | β (95% CI) | P value | |
| Model 1 | ||||||
| Q2 vs. Q1 | −0.107 (−0.154, −0.060) | <0.001 | −0.309 (−0.363, −0.254) | <0.001 | −0.195 (−0.244, −0.147) | <0.001 |
| Q3 vs. Q1 | −0.565 (−0.619, −0.511) | <0.001 | −0.316 (−0.372, −0.259) | <0.001 | −0.503 (−0.551, −0.454) | <0.001 |
| Q4 vs. Q1 | −0.505 (−0.552, −0.457) | <0.001 | −0.340 (−0.397, −0.284) | <0.001 | −0.608 (−0.656, −0.559) | <0.001 |
| P for trend | <0.001 | <0.001 | <0.001 | |||
| Model 2 | ||||||
| Q2 vs. Q1 | −0.265 (−0.311, −0.220) | <0.001 | −0.157 (−0.210, −0.104) | <0.001 | −0.218 (−0.265, −0.171) | <0.001 |
| Q3 vs. Q1 | −0.228 (−0.282, −0.175) | <0.001 | −0.176 (−0.231, −0.121) | <0.001 | −0.311 (−0.359, −0.263) | <0.001 |
| Q4 vs. Q1 | −0.331 (−0.377, −0.284) | <0.001 | −0.177 (−0.233, −0.121) | <0.001 | −0.315 (−0.363, −0.267) | <0.001 |
| P for trend | <0.001 | <0.001 | <0.001 | |||
| Model 3 | ||||||
| Q2 vs. Q1 | −0.226 (−0.271, −0.181) | <0.001 | −0.135 (−0.188, −0.081) | <0.001 | −0.213 (−0.259, −0.166) | <0.001 |
| Q3 vs. Q1 | −0.151 (−0.204, −0.097) | <0.001 | −0.140 (−0.196, −0.083) | <0.001 | −0.300 (−0.347, −0.253) | <0.001 |
| Q4 vs. Q1 | −0.205 (−0.254, −0.156) | <0.001 | −0.124 (−0.183, −0.064) | <0.001 | −0.290 (−0.338, −0.243) | <0.001 |
| P for trend | <0.001 | <0.001 | <0.001 | |||
Model 1 was unadjusted; Model 2 was adjusted for age. For push-ups and sit-ups, Model 3 was adjusted for age, serum uric acid, serum hemoglobin, serum creatinine, current drinker, betel nut chewing status, and running speed (m/s); for the 3-km running test, Model 3 was adjusted for age, serum uric acid, serum hemoglobin, serum creatinine, current drinker, and betel nut chewing status. The β coefficients were interpreted as the change in cardiovascular disease risk for each quartile increase in the physical fitness tests. CI, confidence interval; Q1, first quartile; Q2, second quartile; Q3, third quartile; Q4, fourth quartile.
| Push-ups | Sit-ups | 3-km running test | ||||
|---|---|---|---|---|---|---|
| β (95% CI) | P value | β (95% CI) | P value | β (95% CI) | P value | |
| Model 1 | ||||||
| Q2 vs. Q1 | 0.571 (0.424, 0.717) | <0.001 | −0.075 (−0.294, 0.144) | 0.502 | −0.097 (−0.242, 0.048) | 0.189 |
| Q3 vs. Q1 | −0.164 (−0.308, −0.020) | 0.026 | −0.403 (−0.618, −0.188) | <0.001 | −0.281 (−0.428, −0.135) | <0.001 |
| Q4 vs. Q1 | −0.510 (−0.664, −0.356) | <0.001 | −0.411 (−0.626, −0.195) | <0.001 | −0.634 (−0.779, −0.489) | <0.001 |
| P for trend | <0.001 | <0.001 | <0.001 | |||
| Model 2 | ||||||
| Q2 vs. Q1 | 0.170 (0.025, 0.314) | 0.022 | −0.146 (−0.359, 0.068) | 0.181 | −0.261 (−0.401, −0.121) | <0.001 |
| Q3 vs. Q1 | −0.364 (−0.504, −0.224) | <0.001 | −0.215 (−0.427, −0.004) | 0.046 | −0.383 (−0.524, −0.242) | <0.001 |
| Q4 vs. Q1 | −0.263 (−0.413, −0.113) | 0.001 | −0.247 (−0.458, −0.035) | 0.022 | −0.384 (−0.525, −0.243) | <0.001 |
| P for trend | <0.001 | 0.019 | <0.001 | |||
| Model 3 | ||||||
| Q2 vs. Q1 | 0.166 (0.024, 0.307) | 0.022 | −0.121 (−0.332, 0.089) | 0.259 | −0.236 (−0.372, −0.100) | 0.001 |
| Q3 vs. Q1 | −0.360 (−0.499, −0.222) | <0.001 | −0.147 (−0.359, 0.065) | 0.174 | −0.382 (−0.519, −0.244) | <0.001 |
| Q4 vs. Q1 | −0.194 (−0.346, −0.041) | 0.013 | −0.147 (−0.366, 0.072) | 0.189 | −0.389 (−0.526, −0.252) | <0.001 |
| P for trend | <0.001 | 0.202 | <0.001 | |||
Model 1 was unadjusted; Model 2 was adjusted for age. For push-ups and sit-ups, Model 3 was adjusted for age, serum uric acid, serum hemoglobin, serum creatinine, current drinker, betel nut chewing status, and running speed (m/s); for the 3-km running test, Model 3 was adjusted for age, serum uric acid, serum hemoglobin, serum creatinine, current drinker, and betel nut chewing status. The β coefficients were interpreted as the change in cardiovascular disease risk for each quartile increase in the physical fitness tests. CI, confidence interval; Q1, first quartile; Q2, second quartile; Q3, third quartile; Q4, fourth quartile.
| Push-ups | Sit-ups | 3-km running test | ||||
|---|---|---|---|---|---|---|
| β (95% CI) | P value | β (95% CI) | P value | β (95% CI) | P value | |
| Model 1 | ||||||
| Q2 vs. Q1 | 0.015 (−0.009, 0.038) | 0.217 | −0.044 (−0.109, 0.021) | 0.180 | 0.036 (0.009, 0.063) | 0.008 |
| Q3 vs. Q1 | 0.011 (−0.025, 0.046) | 0.554 | −0.044 (−0.136, 0.048) | 0.347 | 0.000 (−0.026, 0.026) | 1.000 |
| Q4 vs. Q1 | −0.000 (−0.032, 0.032) | 1.000 | −0.044 (−0.148, 0.060) | 0.405 | 0.000 (−0.027, 0.027) | 1.000 |
| P for trend | 0.974 | 0.216 | 0.431 | |||
| Model 2 | ||||||
| Q2 vs. Q1 | 0.020 (−0.004, 0.044) | 0.097 | −0.035 (−0.100, 0.030) | 0.291 | 0.040 (0.013, 0.067) | 0.004 |
| Q3 vs. Q1 | 0.022 (−0.015, 0.058) | 0.242 | −0.036 (−0.128, 0.057) | 0.449 | 0.006 (−0.021, 0.032) | 0.680 |
| Q4 vs. Q1 | 0.008 (−0.024, 0.040) | 0.635 | −0.051 (−0.155, 0.053) | 0.334 | 0.007 (−0.020, 0.035) | 0.603 |
| P for trend | 0.629 | 0.223 | 0.792 | |||
| Model 3 | ||||||
| Q2 vs. Q1 | 0.016 (−0.007, 0.781) | 0.173 | −0.047 (−0.110, 0.015) | 0.138 | 0.040 (0.014, 0.067) | 0.003 |
| Q3 vs. Q1 | 0.019 (−0.018, −0.028) | 0.317 | −0.038 (−0.126, 0.049) | 0.390 | 0.003 (−0.023, 0.030) | 0.801 |
| Q4 vs. Q1 | 0.005 (0.055, 0.038) | 0.781 | −0.045 (−0.146, 0.055) | 0.378 | 0.006 (−0.021, 0.033) | 0.670 |
| P for trend | 0.791 | 0.221 | 0.660 | |||
Model 1 was unadjusted; Model 2 was adjusted for age. For push-ups and sit-ups, Model 3 was adjusted for age, serum uric acid, serum hemoglobin, serum creatinine, current drinker, betel nut chewing status, and running speed (m/s); for the 3-km running test, Model 3 was adjusted for age, serum uric acid, serum hemoglobin, serum creatinine, current drinker, and betel nut chewing status. The β coefficients were interpreted as the change in cardiovascular disease risk for each quartile increase in the physical fitness tests. CI, confidence interval; Q1, first quartile; Q2, second quartile; Q3, third quartile; Q4, fourth quartile.
| Push-ups | Sit-ups | 3-km running test | ||||
|---|---|---|---|---|---|---|
| β (95% CI) | P value | β (95% CI) | P value | β (95% CI) | P value | |
| Model 1 | ||||||
| Q2 vs. Q1 | 4.983×10⁻¹⁷ (−0.073, 0.073) | 1.000 | – | – | −0.053 (−0.123, 0.017) | 0.138 |
| Q3 vs. Q1 | 0.033 (−0.040, 0.107) | 0.370 | – | – | −0.053 (−0.123, 0.017) | 0.138 |
| Q4 vs. Q1 | 4.673×10⁻¹⁷ (−0.104, 0.104) | 1.000 | – | – | −0.053 (−0.123, 0.018) | 0.143 |
| P for trend | 0.468 | – | 0.169 | |||
| Model 2 | ||||||
| Q2 vs. Q1 | 0.003 (−0.067, 0.073) | 0.929 | – | – | −0.057 (−0.125, 0.011) | 0.101 |
| Q3 vs. Q1 | 0.051 (−0.021, 0.123) | 0.162 | – | – | −0.048 (−0.116, 0.020) | 0.166 |
| Q4 vs. Q1 | 0.037 (−0.067, 0.141) | 0.477 | – | – | −0.049 (−0.118, 0.019) | 0.157 |
| P for trend | 0.126 | – | 0.215 | |||
| Model 3 | ||||||
| Q2 vs. Q1 | −0.010 (−0.085, 0.060) | 0.732 | – | – | −0.049 (−0.120, 0.022) | 0.173 |
| Q3 vs. Q1 | 0.028 (−0.046, 0.109) | 0.419 | – | – | −0.037 (−0.109, 0.036) | 0.317 |
| Q4 vs. Q1 | 0.018 (−0.091, 0.139) | 0.675 | – | – | −0.047 (−0.121, 0.026) | 0.203 |
| P for trend | 0.323 | – | 0.306 | |||
Model 1 was unadjusted; Model 2 was adjusted for age. For push-ups and sit-ups, Model 3 was adjusted for age, serum uric acid, serum hemoglobin, serum creatinine, current drinker, betel nut chewing status, and running speed (m/s); for the 3-km running test, Model 3 was adjusted for age, serum uric acid, serum hemoglobin, serum creatinine, current drinker, and betel nut chewing status. The β coefficients were interpreted as the change in cardiovascular disease risk for each quartile increase in the physical fitness tests. CI, confidence interval; Q1, first quartile; Q2, second quartile; Q3, third quartile; Q4, fourth quartile.
Demographic information of eligible participants is given in Table 1. Participants were divided according to sex and BMI into 4 groups: non-obese males (n=38,115), obese males (n=10,453), non-obese females (n=2,6790, and obese females (n=253). There were significant differences in age, height, BMI, biochemical data, and fitness performance across these 4 groups.
Association Between Fitness Performance and the FRS-CAD in the 4 GroupsIn non-obese male participants (Table 2), fitness performance was closely associated with 10-year CAD risk in all non-adjusted and adjusted models. In Model 3, the number of push-ups was inversely associated with fitness quartiles after adjusting for pertinent clinical variables, with β values (95% confidence intervals) of −0.226 (−0.271, −0.181), −0.151 −0.204, −0.097), and −0.205 (−0.254, −0.156), respectively (P for trend <0.001). In obese male participants (Table 3), FRS-CAD was significantly lower in subjects in higher quartiles of fitness performance compared with the lowest quartile in non-adjusted and adjusted models (P for trend <0.001), except for the sit-up test in Model 3.
In non-obese female participants (Table 4), there were no significant associations between fitness performance and 10-year CAD risk. Similarly, there was no significant relationship between fitness performance and FRS-CAD in obese female participants (Table 5).
The most prominent finding in this study is the inverse association between muscular endurance and the CVD risk score in the general, healthy Taiwan male adult population with or without obesity. We discovered that the general, healthy, male adults with higher quartiles of muscular endurance tended to have lower CVD risk according to the significant values for the P for trend in this study. To the best of our knowledge, the present study is the first to demonstrate the association between muscular endurance and future CVD risk in a large sample size of the Taiwan population.
Most earlier studies used either a combination score of muscular endurance and maximal muscular strength or muscular strength alone to assess muscular fitness.20,21 Among the few studies that focused on muscular endurance, a retrospective longitudinal cohort study highlighted the effectiveness of using push-ups to predict CVD risk in a middle-aged male population,16 and the results of that study are consistent with the findings of the present study, namely that a higher level of performance in the push-up test was associated with a lower risk of CVD in adult males. There is further evidence to suggest that muscular endurance (including push-ups, sit-ups, and repeated squats) was inversely associated with the clustered cardiovascular risk factors, including blood pressure, glucose, triglycerides, and low-density lipoprotein cholesterol (LDL-C), independent of CRF.14
However, in the non-obese female participants (Table 4), no muscular fitness was significantly inversely correlated with FRS-CAD. After adjusting for the variables in Model 3, the association of the physical fitness tests with FRS-CHS remained non-significant in non-obese females. A similar observation was reported by Tanaka et al, who found that the regional distribution of fat (waist to hip ratio) rather than physical fitness was significantly related to plasma lipid profiles (total cholesterol, LDL-C, LDL-C/HDL-C) in obese women after adjusting for percentage body fat.22 Therefore, fat distribution may be a stronger predictor of CVD risk than physical fitness in females, and this needs to be investigated in future studies. Despite our understanding of the complex mechanism underlying the link between poor muscle endurance and higher CVD risk being incomplete, insulin resistance and mitochondrial dysfunction in skeletal muscle could be involved. Insulin resistance is a condition in which insulin-induced glucose uptake in insulin-sensitive tissue like muscle is impaired, and muscular fitness (measured by handgrip strength) is associated with insulin resistance in adolescents.23,24 It has been proposed that an accumulation of oxidant products in mitochondria in response to excess fuel relative to demand impairs the insulin signaling pathway, and thereby results in obesity-linked skeletal muscle insulin resistance.25 As the primary tissue for glucose and triglyceride metabolism, skeletal muscle with poor muscle fitness has been proposed to directly affect mortality through its association with increased cardiometabolic disease and inflammatory proteins.26,27 Therefore, upregulation of fat oxidation and glucose from enhanced skeletal muscle mitochondrial enzyme activity after endurance training may explain the link between muscular endurance and improved insulin resistance.
In the present study, CRF performance was evaluated using a 3,000-m non-weight-bearing running test because this field test could be a reliable alternative to estimate maximum oxygen uptake in large-scale research studies and does not require expensive equipment.28 In addition, performance in the 3,000-m running test depends primarily on V̇O2 max.29 Conversely, in line with prior studies,8,28,30,31 male participants in the present study with higher quartiles of CRF had significantly lower CVD risk (Tables 2,3). CRF in the previous studies was assessed using maximal aerobic capacity (MAC), expressed in units of metabolic equivalents (METs) or peak V̇O2 derived from a submaximal exercise test.8,30,31 A cross-sectional analysis reported that predicted peak V̇O2 derived from submaximal treadmill exercise testing was a strong and significant predictor of the 10-year and lifetime CVD risk within apparently healthy, young to middle-aged adults.31
It is interesting to note that no significant relationship between CRF and FRS-CAD was found in female participants in the present study. Consistent with our findings, a cohort study reported that the relationship between V̇O2peak and CVD mortality was non-significant in self-referred apparently healthy women after adjusting for age, examination year, and traditional CVD risk factors during a long-term follow-up (from 1985 to 2015).10 In that study, deaths among the women were further divided into 3 groups and graded by CRF performance, with the findings suggesting that “low-fitness women may be more likely to die from CVD-related causes at an earlier age compared with those with higher fitness levels”.10 Another cross-sectional study found that the CRF of Chinese middle-aged women was independently associated with CVD risk factors, including overweight, hypertension, dyslipidemia, and arterial stiffness, with the least fit women having the highest number of CVD risk factors.32 Although low CRF is a stronger predictor of CVD mortality risk than elevated BMI, the effects of obesity and fat distribution should not be ignored.33 For example, homeostasis model assessment of insulin resistance (HOMA-IR) was lower in a high- than low-CRF group, and the high fitness group had higher visceral adiposity.34 The lower CVD risk in obesity may be attributed, in part, to the anti-inflammatory effects of exercise.35 Apart from regular physical checkups, we support the recommendations for health institutions to routinely measure and classify CRF for the general, healthy, adult population because CRF testing may identify groups with poorer CRF performance for targeted health promotion suggestions or necessary interventions.28 Keeping good physical fitness when young could also reduce the risk of impaired glucose tolerance when old.36 In addition, both CRF and muscular fitness have been shown to have a positive association with health-related quality of life. Specifically, improving of CRF and muscular fitness could prevent disability and lower the morbidity burden in older age.37,38
The present study had some strengths. To the best of our knowledge, this study is the first to explore the association between physical fitness, including muscular endurance, and future CVD risks in a large number of Asian subjects, especially males, and the study sample may be representative of the generally healthy young population seen on a regular basis. In addition, the strict assessment of the number of push-ups and sit-ups was achieved using infrared sensors rather than self-report.
Nevertheless, this study also has some limitations. First, further investigations with a larger sample size of female subjects may be required. Compared with male participants, there were fewer female participants in this study because of the relatively small number of female soldiers and officers in the Republic of China Armed Forces. As a result, a non-significant relationship was found between CRF or muscular endurance and CVD risk in the female population, regardless of obesity status. Of note, the association between female sit-up tests and CRF were not adequate to be analyzed (Table 5). Consistent with the findings of this study, a study based on the Health Profile Institute database found that a lower CRF category was associated with a higher CVD risk, with women of all ages showing no further obvious reduction in risk with higher CRF.39 It is generally accepted that the larger muscle fibers in men may represent a true innate difference in body muscular strength and muscular endurance.40,41 Therefore, the results described above presumably reflect the limited power and non-significant relationship between muscular endurance and CVD risk in the group of females in this study. In addition, data comparing military and healthy adults in the general population in Taiwan is lacking. Other potential covariates, such as fat distribution, may be considered in future studies. Finally, the cross-sectional nature of the study precludes our ability to identify any cause-effect relationships, and which is the stronger predictor of CVD risk, CRF or muscular fitness, was not addressed in this study.
A substantial inverse association was seen between FRS-CAD and both muscular endurance and CRF among adult males in the military. This suggests that low muscular endurance and CRF are associated with higher risks of future CVD for general, healthy, young to middle-aged Taiwanese males. Based on these findings, improving muscular fitness and CRF is recommended and further longitudinal studies to support the benefits of these approaches are warranted.
None.
This study was supported in part by grants from the National Defense Medical Bureau (MAB-104-066, MAB-105-028, MAB-105-031, MAB-105-032, MAB-106-037 and MAB-106-038), Taiwan, ROC.
The authors report no conflicts of interest in this work.
The authors declared that they had no competing interests.