Abstract
Background:
Few studies have investigated the association between temporal change in QT interval and incident heart failure (HF). The aim of this study is to examine this association in the Atherosclerosis Risk in Communities (ARIC) study.
Methods and Results:
A secondary analysis was performed for the ARIC study. Overall, 10,274 participants (age 60.0±5.7 years, 45.7% male and 19.5% black) who obtained a 12-lead electrocardiography (ECG) at both Visit 1 (1987–1989) and Visit 3 (1993–1995) in the ARIC study were included. QT interval duration was corrected by using Bazett’s formula (QTc). The change in corrected QT interval duration (∆QTc) was calculated by subtracting QTc at Visit 3 from Visit 1. The main outcome measure was incident HF. Multivariable Cox regression models were used to assess the association between ∆QTc and incident HF. During a median follow up of 19.5 years, 1,833 cases (17.8%) of incident HF occurred. ∆QTc was positively associated with incident HF (HR: 1.06, 95% CI 1.03, 1.08, per 10 ms increase, P<0.001; HR 1.22, 95% CI 1.08, 1.36, T3 vs. T1, P=0.002), after adjusting for traditional cardiovascular risk factor, QTc and QRS duration.
Conclusions:
Temporal increases in QTc are independently associated with increased risk of HF.
The QT interval on electrocardiogram (ECG), from the beginning of the QRS complex to the end of the T wave, represents the time from the beginning of ventricular depolarization to the end of ventricular repolarization. Prolongation of action potential duration (APD) is a hallmark of cells and tissues isolated from failing hearts. Specifically, reductions in the inward-rectifier K+ current, delayed rectifier K+ current and the transient outward K+ current, and increase of the Na+/Ca2+ exchanger have been shown to contribute to the prolongation of the APD.1,2
Previous studies have shown the associations between QT interval duration and heart failure (HF) and other cardiovascular events.3–7
Considering the increased risk of incident HF according to the prolongation or reduction of QT interval, the change of QT interval over time may also be associated with HF, though few studies have investigated this. As a result, we aimed to examine the association between temporal change in QT interval and incident HF among participants of the Atherosclerosis Risk in Communities (ARIC) study.
Methods
We performed a secondary analysis of the ARIC study. The ARIC study is a population-based, prospective cohort of cardiovascular risk factors in four US communities initially consisting of 15,792 participants aged 45–64 years recruited between 1987 and 1989 (Visit 1). After the baseline visit, 4 subsequent study visits were conducted: Visit 2 (1990–1992), Visit 3 (1993–1995), Visit 4 (1996–1998) and Visit 5 (2011–2013). Participants are also being followed by annual or semiannual telephone interviews and active surveillance of community hospitals. Details of the study design have been published previously.8
The ARIC Study has been approved by institutional review boards at all participating institutions, and all participants provided written informed consent. In the present study, we included 12,047 participants who attended Visit 3, excluding participants with missing ECG information from Visit 1 (n=157), Visit 3 (n=140) or with an extreme change in corrected QT interval duration (∆QTc) between Visits 1 and 3 (defined as ∆QTc <−200 ms or >200 ms) (n=7). We further excluded participants who had other missing covariates (n=935) or participants with prevalent HF (n=534). The final sample size was 10,274 (Figure 1).

Digital 12-lead ECGs were obtained at Visit 1 and Visit 3 using MAC PC ECG machines (Marquette Electronics, Milwaukee, WI, USA) and processed at the Epidemiology Coordinating and Research (EPICORE) Center (University of Alberta, Edmonton, Alberta, Canada) and Epidemiological Cardiology Research (PEPICARE) Center (Wake Forest University, Winston-Salem, NC, USA). After visual inspection for errors and inadequate quality, ECGs were automatically processed using GE Marquette 12-SL version 2001 (GE, Milwaukee, WI, USA). A global single measure of QT interval was defined as the time duration between the earliest QRS onset to the latest T wave offset. The RR interval was used to calculate QTc with Bazett’s formula. ∆QTc was calculated by subtracting QTc at Visit 3 from Visit 1 (detail information for the measurement ECGs could be found in the ARIC Study Protocol, Manual 5, https://sites.cscc.unc.edu/aric/sites/default/files/public/manuals/Electrocardiography.1_5.pdf).
Measurement of Other Covariates
All covariates were assessed at Visit 3, except for blood creatinine (Cr) and glucose, which were assessed at Visit 2 for lacking data in Visit 3. Race, age, gender, smoking status, drinking status and education level were self-reported. Height and weight were measured with the participant wearing light clothes. BMI was calculated as weight (kilograms) divided by squared height (m2). Blood potassium concentration was measured by an ion selective electrode using the DACOS Analyzer plus LYTES Option on the undiluted serum. Cr was measured using the modified kinetic Jaffe method and glucose was measured using a modified hexokinase/glucose-6-phosphate dehydrogenase procedure.9
Total cholesterol (TC), high-density lipoprotein cholesterol (HDL-c) and triglycerides (TG) were measured using standardized enzymatic assays and low-density lipoprotein cholesterols (LDL-c) were calculated based on the Friedewald formula.10
Diabetes was defined if the participants had fasting blood glucose ≥126 mg/dL, non-fasting blood glucose ≥200 mg/dL, use of antidiabetic medicines, or a self-reported physician diagnosis of diabetes. Hypertension was defined as systolic blood pressure (BP) ≥140 mmHg and/or diastolic BP ≥90 mmHg, or BP medicine use in the past 2 weeks.
Ascertainment of HF
Detailed ascertainment of incident HF has been described previously.11–13
Incident HF was defined as the first occurrence of a hospitalization with HF diagnosis according to the International Classification of Diseases – 9th
Revision (ICD-9) code 428 (428.0 to 428.9) in any position ascertained by the ARIC study retrospective surveillance of hospital discharges, or a death certificate with an ICD-9 code of 428 or an ICD-10 code of 150 in any position. Other outcomes including all-cause mortality, coronary artery disease (CAD), stroke and atrial fibrillation (AF) were also ascertained, which have been previously described.12,14–16
Statistical Analysis
We modeled ∆QTc as a continuous variable. Then, we categorized ∆QTc into tertiles based on the sample distribution. Baseline (Visit 3) characteristics of participants were compared between groups using a one-way ANOVA test, chi-squared test and Kruskal-Wallis test as appropriate. Kaplan-Meier estimates were used to compute cumulative incidence of HF by quartiles of ∆QTc, and the difference in estimate was compared using the long-rank procedure. We used multivariable Cox’s hazard regression models to assess the relationship between ∆QTc and incident HF. Time of follow up was defined as time from Visit 3 (baseline) to the incident of HF, loss to follow up, death, or 31 December 2012, whichever occurred first. The initial model adjusted for age, race and gender. A second model additionally adjusted for QTc at Visit 1, QRS interval and heart rate. The final model further adjusted for BMI, smoking, drinking, education level, Cr, HDL-c, LDL-c, TC, TG, glucose, prevalent hypertension, stroke, diabetes, CAD and AF and use of antihypertension medicine, stain, aspirin and anticoagulation. We also used restricted cubic spline with 3 knots to express the dose-response association between ∆QTc and incident HF.
We performed pre-specified subgroup analysis by sex, age, race, QTc at Visit 1, smoking status, drinking status, hypertension and tested for potential interactions of these covariates with ∆QTc separately. We also did sensitivity analyses excluding participants with QRS interval ≥120 ms at Visit 3, prevalent of CAD, stroke and AF separately. We did a time-varying sensitivity analysis: ∆QTc was calculated by subtracting QTc at Visit4 from Visit 1 and at Visit 5 from Visit 1 separately. In the Cox’s hazard ratio regression models, time of follow up was defined as time from Visit 4 or Visit 5.
In addition, similar analyses were also performed for other outcomes including all-cause mortality, CAD, stroke and AF in the ARIC study.
Results
Baseline characteristics are shown in
Table 1. The mean value of ∆QTc for 10,274 participants was 4.3±18.1 ms. At baseline (Visit 3), the average age was 60.0±5.7 years, 4,898 (45.7%) were male and 1,999 (19.5%) were black. Participants with relatively lower ∆QTc were more likely to be longer QTc in Visit 1, shortened QTc at Visit 3, a lower heart rate, more likely to be black, have a lower education level and have hypertension. Participants in both the first and third tertile were more likely to be female. There were no significant differences in smoking status, drinking status, HDL-c, LDL-c, TC, Cr, prevalence of stroke and AF across ∆QTc tertiles.
Table 1.
Baseline Characteristics of Study Participants by Tertiles of 6-Year Changes in QTc
| Characteristic |
Total
(n=10,274) |
T1
(n=3,453) |
T2
(n=3,449) |
T3
(n=3,372) |
P value |
| ΔQTc, ms |
4.3 (18.1) |
−12.9 (11.9) |
3.8 (3.1) |
22.5 (14.6) |
<0.001 |
| QTc (v1), ms |
414.8 (17.2) |
422.8 (19.1) |
411.0 (13.4) |
410.4 (15.6) |
<0.001 |
| QTc (v3), ms |
419.1 (20.0) |
409.9 (15.1) |
414.8 (13.4) |
432.9 (22.5) |
<0.001 |
| QRS (v1), ms |
92.0 (11.9) |
92.0 (12.1) |
91.9 (11.5) |
92.1 (12.2) |
0.788 |
| QRS (v3), ms |
93.2 (13.6) |
92.0 (12.3) |
92.6 (12.0) |
95.0 (15.9) |
<0.001 |
| Heart rate, beats/min |
64.9 (9.8) |
63.3 (9.7) |
63.9 (9.0) |
67.7 (10.2) |
<0.001 |
| Age, years |
60.0 (5.7) |
60.2 (5.7) |
59.8 (5.7) |
60.1 (5.7) |
0.007 |
| Gender |
|
|
|
|
<0.001 |
| Male |
4,898 (45.7%) |
1,506 (43.6%) |
1,695 (49.1%) |
1,497 (44.4%) |
|
| Female |
5,576 (54.3%) |
1,947 (56.4%) |
1,754 (50.9%) |
1,875 (55.6%) |
|
| Race |
|
|
|
|
<0.001 |
| Black |
1,999 (19.5%) |
795 (23.0%) |
633 (18.4%) |
571 (16.9%) |
|
| White |
8,275 (80.5%) |
2,658 (77.0%) |
2,816 (81.6%) |
2,801 (83.1%) |
|
| Smoking |
|
|
|
|
0.063 |
| Current smoker |
1,774 (17.3%) |
558 (16.2%) |
591 (17.1%) |
625 (18.5%) |
|
| Former smoker |
4,283 (41.7%) |
1,427 (41.3%) |
1,455 (42.2%) |
1,401 (41.5%) |
|
| Never smoker |
4,217 (41.0%) |
1,468 (42.5%) |
1,403 (40.7%) |
1,346 (39.9%) |
|
| Drinking |
|
|
|
|
0.134 |
| Current drinker |
5,593 (54.4%) |
1,818 (52.6%) |
1,918 (55.6%) |
1,857 (55.1%) |
|
| Former drinker |
2,231 (21.7%) |
782 (22.6%) |
724 (21.0%) |
725 (21.5%) |
|
| Never drinker |
2,450 (23.8%) |
853 (24.7%) |
807 (23.4%) |
790 (23.4%) |
|
| Education level |
|
|
|
|
0.019 |
| Basic or 0 years |
1,913 (18.6%) |
705 (20.4%) |
601 (17.4%) |
607 (18.0%) |
|
| Intermediate |
4,345 (42.3%) |
1,432 (41.5%) |
1,488 (43.1%) |
1,425 (42.3%) |
|
| Advanced |
4,016 (39.1%) |
1,316 (38.1%) |
1,360 (39.4%) |
1,340 (39.7%) |
|
| BMI, kg/m2 |
28.2 (5.4) |
28.3 (5.4) |
28.0 (5.2) |
28.4 (5.4) |
0.013 |
| K, mmol/L |
4.5 (0.5) |
4.4 (0.5) |
4.5 (0.5) |
4.5 (0.5) |
<0.001 |
| HDL-c, mmol/L |
1.4 (0.5) |
1.4 (0.5) |
1.4 (0.5) |
1.4 (0.5) |
0.480 |
| LDL-c, mmol/L |
3.3 (0.9) |
3.3 (0.9) |
3.3 (0.9) |
3.3 (0.9) |
0.473 |
| TC, mmol/L |
5.4 (0.9) |
5.4 (1.0) |
5.3 (0.9) |
5.4 (1.0) |
0.459 |
| TG, mmol/L |
1.5 (0.8) |
1.5 (0.8) |
1.5 (0.7) |
1.6 (0.8) |
0.002 |
| GLU, mmol/L |
6.2 (2.2) |
6.2 (2.2) |
6.1 (2.1) |
6.2 (2.2) |
0.074 |
| Cr, mg/dL |
1.1 (0.3) |
1.2 (0.5) |
1.1 (0.2) |
1.1 (0.2) |
0.624 |
| CAD |
617 (6.0%) |
163 (6.1%) |
140 (5.0%) |
132 (5.7%) |
0.007 |
| Diabetes |
1,139 (11.1%) |
330 (12.4%) |
292 (10.5%) |
222 (9.6%) |
0.007 |
| Hypertension |
3,938 (38.3%) |
1,078 (40.4%) |
1,026 (36.9%) |
769 (33.1%) |
<0.001 |
| Stroke |
166 (1.6%) |
44 (1.6%) |
50 (1.8%) |
24 (1.0%) |
0.073 |
| AF |
44 (0.4%) |
15 (0.6%) |
10 (0.4%) |
4 (0.2%) |
0.082 |
| Anti-hypertension |
3,538 (34.4%) |
1,284 (37.2%) |
1,053 (30.5%) |
1,201 (35.6%) |
<0.001 |
| Statin |
533 (5.2%) |
177 (5.1%) |
168 (4.9%) |
188 (5.6%) |
0.415 |
| Aspirin |
5,530 (53.6%) |
1,840 (53.3%) |
1,811 (52.5%) |
1,852 (54.9%) |
0.125 |
| Anticoagulation |
97 (0.9%) |
37 (1.1%) |
20 (0.6%) |
40 (1.2%) |
0.022 |
Data are presented as mean (SD) or n (%), unless otherwise indicated. Baseline characteristics are from the study population (n=10,274) at baseline Visit 3 (creatinine and blood glucose are from visit 2 for the lacking of data in visit 3) according to quartiles of 6-year changes in QT interval. AF, atrial fibrillation; BMI, body mass index; CAD, coronary artery disease; Cr, creatinine; GLU, blood glucose; HDL-c, high-density lipoprotein cholesterol; K, potassium; LDL-c, low-density lipoprotein cholesterol; QRS, QRS duration; QTc, heart rate-corrected QT interval with Bazett’s formula; ΔQTc, 6-year changes in QTc; TC, total cholesterol; TG, triglycerides.
During a median follow up of 19.5 years, 1,833 cases (17.8%) of incident HF occurred. An unadjusted cumulative incident curve for HF is shown in
Figure 2. The model measured ∆QTc as a continuous variable, and the hazard ratio for incident HF of 10 ms increased in ∆QTc and was 1.06 (95% CI, 1.03, 1.08; P<0.001), after adjusting for all covariates (Table 2). This result was similar when we categorized individuals by ∆QTc tertiles. In the final model, the hazard ratios for incident HF comparing 2nd
and 3rd
tertiles of ∆QTc to the 1st
tertiles were 1.11 (95% CI, 0.98, 1.25; P=0.087) and 1.22 (95% CI, 1.08, 1.36; P=0.002) respectively (Table 2).
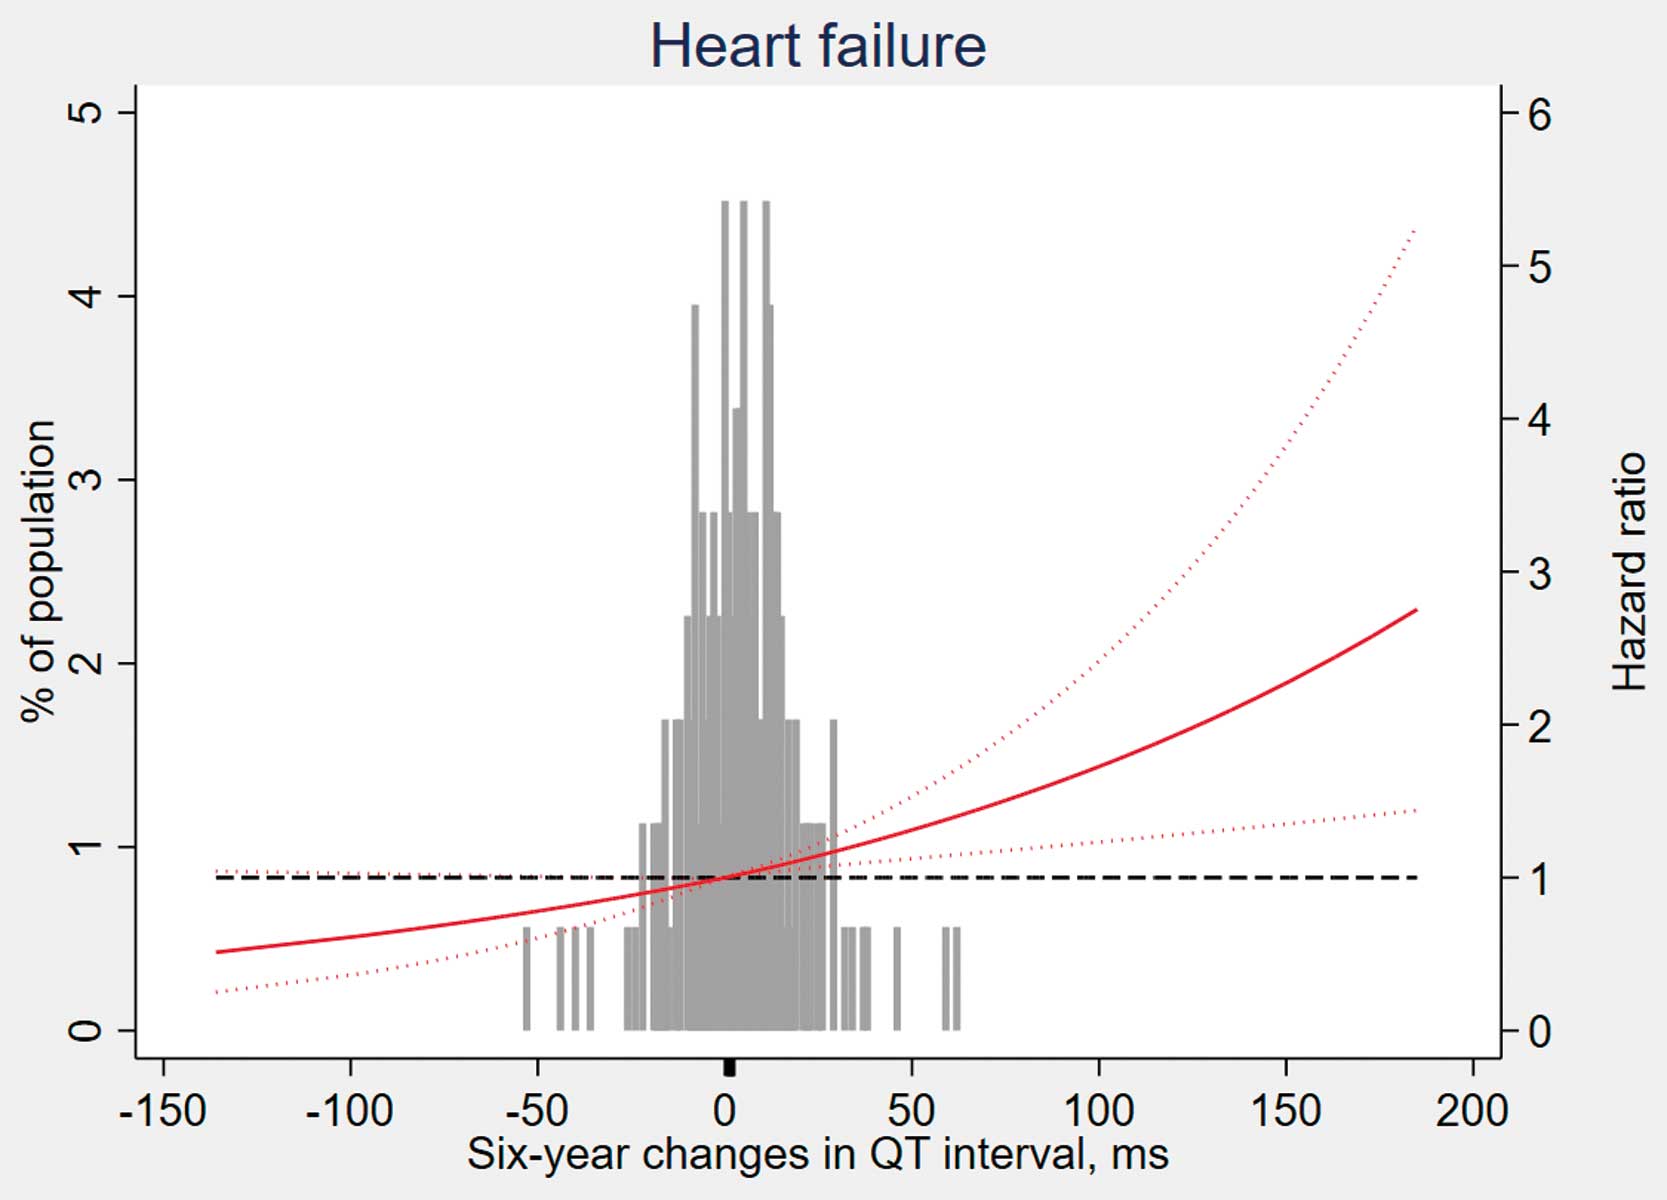
Figure 3
depicts the association between HF and ∆QTc, modelled as a restricted cubic spline, taking no change in ∆QTc (0 ms) as the reference level. Consistent with the analysis using tertiles of sample distribution, the risk of incident HF increased in participants with ∆QTc >0 ms.

Table 2.
Association Between 6-Year Changes in QT Interval and Incident Heart Failure
| ∆QTc (ms) |
Events, No. |
Model 1† |
Model 2‡ |
Model 3§ |
| HR (95% CI) |
P value |
HR (95% CI) |
P value |
HR (95% CI) |
P value |
| Incident heart failure |
| Per 10 ms |
1,833/10,274 |
1.07 (1.04–1.09) |
<0.001 |
1.07 (1.05–1.10) |
<0.001 |
1.06 (1.03–1.08) |
<0.001 |
| Tertiles (T) |
| T1 (≤−2) |
602/3,453 |
1.00 (Ref.) |
– |
1.00 (Ref.) |
– |
1.00 (Ref.) |
– |
| T2 (−2 to 9) |
567/3,449 |
0.95 (0.85–1.07) |
0.389 |
1.07 (0.95–1.21) |
0.276 |
1.11 (0.98–1.25) |
0.087 |
| T3 (≥9) |
664/3,372 |
1.24 (1.11–1.39) |
<0.001 |
1.24 (1.10–1.40) |
<0.001 |
1.22 (1.08–1.36) |
0.002 |
CI, confidence interval; HR, hazard ratio. Other abbreviations as in Table 1. †Adjusted for age, race, gender. ‡Further adjusted for QTc at Visit 1, QRS interval, heart rate. §Further adjusted for BMI, smoking, drinking, education level, serum potassium, Cr, HDL-c, LDL-c, TC, TG, glucose, hypertension, stroke, diabetes, CAD, AF, antihypertension medicine, stain, aspirin, anticoagulation.
Results were similar when stratified by sex, age, race, QTc interval at Visit 1, smoking status, drinking status and hypertension (all P for interaction >0.05,
Figure 4). In sensitivity analysis, the association between ∆QTc and incident HF persisted after excluding participants with QRS interval ≥120 ms at Visit 3, prevalence of CAD, stroke, AF separately (Figure 4). There were similar results in the time-varying sensitivity analysis (Supplementary Table 1). We also performed similar analyses for other outcomes in the ARIC study and the results are presented in the supplementary materials (Supplementary Table 2, Supplementary Figures 1–3).
Discussion
In this large, community-based, prospective cohort study with a long-term follow up, we found that temporal increases in QTc was independently associated with high risk of incident HF, after adjustment of traditional risk factor and QTc before change; the association was consistent in several subgroup analyses.
The QT interval on ECG represents the time from the beginning of ventricular depolarization to the end of ventricular repolarization. Individuals with abnormal prolongation and shortening ventricular repolarization are predisposed to ventricular fibrillation and sudden death, which is usually caused by genetic abnormalities of potassium and sodium channels within cell membranes, severe electrolyte imbalance, central nervous system injury, myocardial infarction or medicine use.7,17–20
In addition, several studies3–7,21–24
had also found the effect of less extreme variations in QT interval within a reference range in the general population. In the study by Beinart et al,7
increased QT interval was associated with high risk of incident HF (HR 1.25, 95% CI 1.14 to 1.37, P<0.001) in the Multi-Ethnic Study of Atherosclerosis. Moreover, C statistics for Framingham Heart Study (FHS) risk scores increased (0.735 vs. 0.724, P<0.001) when modified with QTc, which means a better ability of prediction when adding QTc into FHS risk scores. The results indicated the potential value of QTc as an index for clinical stratification in HF. However, the study examined only a single QT interval measurement at baseline. Indeed, dynamic changes in QT interval may also be of important clinical value. As a result, our study further analyzed the effect of temporal change in QT interval by 6 years.
Prolongation of QT intervals is associated with the early after-depolarizations in experimental models.25
Sufficient amplitude by early after-depolarizations may generate premature action potentials, which may lead to cardiac arrhythmias and sudden cardiac death.6,26,27
Additionally, QT interval varies as a function of sympathetic and parasympathetic tone.6
By increasing the heart rate, sympathetic stimulation can secondarily decrease the QT interval. In contrast, by decreasing the heart rate, parasympathetic stimulation can increase the QT interval.6
Previous studies6,28,29
have also reported that high sympathetic tone with increased catecholamine levels would induce QT interval prolongation in healthy individuals. Meanwhile, high sympathetic tone is also associated with the development of HF.30
As a result, prolongation of QT interval, representing the elevation of sympathetic tone, may explain its association with incident HF.7
Furthermore, the results of our study extend the findings of previous studies and found that temporal QT interval change is also associated with HF. Importantly, our result was independent of the absolute value of the QT interval before change, suggesting that monitoring of the QT interval change is also of clinical significance as a prevention strategy. In addition, our study also explored the relationship between QT interval change with all-cause mortality and other cardiovascular outcomes. Further details can be found in the supplementary materials (Supplementary Table 2, Supplementary Figures 1–3).
Our study has important strengths. We conducted a large community-based cohort with long follow-up duration to test our hypothesis. The rigorous design of the ARIC study8
with an extensive measurement of covariates allows us to conduct comprehensive adjustment and control confounding factors as much as possible. However, our study also has some limitations. First, it was an observational study and despite rigorous adjustment for potential confounding, we could not exclude residual confounding. Second, some degree of measurement error is unavoidable so the interpretation of absolute data of results should be cautious. Third, due to the lack of data for antiarrhythmic drugs, which can often prolong the QT interval, we could not differentiate between congenital and acquired (drug-induced) QTc prolongation. Although the prevalence of AF is only 0.4% at baseline and equal between groups (Table 1), antiarrhythmic drugs might also be prescribed for other arrhythmias. Participants with arrhythmias might developed HF more frequently. Finally, most cardiovascular events were found through hospital discharge codes. As a result, individuals with asymptomatic cardiovascular events or those managed in an outpatient setting not requiring hospital admission were unable to be identified.
Conclusions
The present study demonstrates that 6-year increases in QT intervals were independently associated with incident HF.
Acknowledgment
We thank the staff and participants of the ARIC study for their important contributions.
Disclosures
The ARIC study is performed as a collaborative trial supported by National Heart, Lung, and Blood Institute contracts (HHSN268201100005C, HHSN268201100006C, HHSN-268201100007C, HHSN268201100008C, HHSN26820-1100009C, HHSN268201100010C, HHSN268201100011C, and HHSN268201100012C). This study was also supported by the National Natural Science Foundation of China (81600206 to X. Zhuang; 81870195 to X. Liao), and the Natural Science Foundation of Guangdong Province (2016A030310140 to X. Zhuang; 20160903 to X. Liao).
IRB Information
This study is a secondary data analysis of deidentified data from the ARIC study (https://www2.cscc.unc.edu/aric/). The ARIC study protocol was approved by the institutional review board of each participating university; therefore, the ethics committee of the First Affiliated Hospital of Sun Yat-Sen University decided that this study did not require ethical approval.
Supplementary Files
Please find supplementary file(s);
http://dx.doi.org/10.1253/circj.CJ-20-0719
References
- 1.
Aiba T, Tomaselli G. Electrical remodeling in dyssynchrony and resynchronization. J Cardiovasc Transl 2012; 5: 170–179.
- 2.
Aiba T, Tomaselli GF. Electrical remodeling in the failing heart. Curr Opin Cardiol 2010; 25: 29–36.
- 3.
Dekker JM, Crow RS, Hannan PJ, Schouten EG, Folsom AR. Heart rate-corrected QT interval prolongation predicts risk of coronary heart disease in black and white middle-aged men and women. J Am Coll Cardiol 2004; 43: 565–571.
- 4.
Nielsen JB, Graff C, Pietersen A, Lind B, Struijk JJ, Olesen MS, et al. J-shaped association between QTc interval duration and the risk of atrial fibrillation. J Am Coll Cardiol 2013; 61: 2557–2564.
- 5.
Soliman EZ, Howard G, Cushman M, Kissela B, Kleindorfer D, Le A, et al. Prolongation of QTc and risk of stroke. J Am Coll Cardiol 2012; 59: 1460–1467.
- 6.
Zhang Y, Post WS, Dalal D, Blasco-Colmenares E, Tomaselli GF, Guallar E. QT-interval duration and mortality rate: Results from the Third National Health and Nutrition Examination Survey. Arch Intern Med 2011; 171: 1727–1733.
- 7.
Beinart R, Zhang Y, Lima JAC, Bluemke DA, Soliman EZ, Heckbert SR, et al. The QT interval is associated with incident cardiovascular events. J Am Coll Cardiol 2014; 64: 2111–2119.
- 8.
The Atherosclerosis Risk in Communities (ARIC) Study: Design and objectives. The ARIC investigators. Am J Epidemiol 1989; 129: 687–702.
- 9.
The ARIC Investigators. ARIC: Atherosclerosis Risk in Communities Study: Operations manual 10. Clinical chemistry determinations. Bethesda (MD): National Heart, Lung, and Blood Institute; 1987.
- 10.
Friedewald WT, Levy RI, Fredrickson DS. Estimation of the concentration of low-density lipoprotein cholesterol in plasma, without use of the preparative ultracentrifuge. Clin Chem 1972; 18: 499–502.
- 11.
Goncalves A, Claggett B, Jhund PS, Rosamond W, Deswal A, Aguilar D, et al. Alcohol consumption and risk of heart failure: The Atherosclerosis Risk in Communities Study. Eur Heart J 2015; 36: 939–945.
- 12.
Silvestre OM, Nadruz W, Querejeta Roca G, Claggett B, Solomon SD, Mirabelli MC, et al. Declining lung function and cardiovascular risk. J Am Coll Cardiol 2018; 72: 1109–1122.
- 13.
Loehr LR, Rosamond WD, Chang PP, Folsom AR, Chambless LE. Heart failure incidence and survival (From the Atherosclerosis Risk in Communities Study). Am J Cardiol 2008; 101: 1016–1022.
- 14.
White AD, Folsom AR, Chambless LE, Sharret AR, Yang K, Conwill D, et al. Community Surveillance of Coronary Heart Disease in the Atherosclerosis Risk in Communities (ARIC) Study: Methods and initial two years’ experience. J Clin Epidemiol 1996; 49: 223–233.
- 15.
Alonso A, Agarwal SK, Soliman EZ, Ambrose M, Chamberlain AM, Prineas RJ, et al. Incidence of atrial fibrillation in Whites and African-Americans: The Atherosclerosis Risk in Communities (ARIC) Study. Am Heart J 2009; 158: 111–117.
- 16.
Rosamond WD, Folsom AR, Chambless LE, Wang CH, McGovern PG, Howard G, et al. Stroke incidence and survival among middle-aged adults: 9-year follow-up of the Atherosclerosis Risk in Communities (ARIC) cohort. Stroke 1999; 30: 736–743.
- 17.
Moss AJ. Prolonged QT-interval syndromes. JAMA 1986; 256: 2985–2987.
- 18.
Schwartz PJ, Wolf S. QT interval prolongation as predictor of sudden death in patients with myocardial infarction. Circulation 1978; 57: 1074–1077.
- 19.
Priori SG, Schwartz PJ, Napolitano C, Bloise R, Ronchetti E, Grillo M, et al. Risk stratification in the long-QT syndrome. N Engl J Med 2003; 348: 1866–1874.
- 20.
Bednar MM, Harrigan EP, Anziano RJ, Camm AJ, Ruski JN. The QT interval. Prog Cardiovasc Dis 2001; 43(5 Suppl 1): 1–45.
- 21.
Roberts JD, Soliman EZ, Alonso A, Vittinghoff E, Chen LY, Loehr L, et al. Electrocardiographic intervals associated with incident atrial fibrillation: Dissecting the QT interval. Heart Rhythm 2017; 14: 654–660.
- 22.
Cox AJ, Azeem A, Yeboah J, Soliman EZ, Aggarwal SR, Bertoni AG, et al. Heart rate-corrected QT interval is an independent predictor of all-cause and cardiovascular mortality in individuals with type 2 diabetes: The Diabetes Heart Study. Diabetes Care 2014; 37: 1454–1461.
- 23.
Ishikawa J, Ishikawa S, Kario K. Prolonged corrected QT interval is predictive of future stroke events even in subjects without ECG-diagnosed left ventricular hypertrophy. Hypertension 2015; 65: 554–560.
- 24.
Nielsen JB, Graff C, Rasmussen PV, Pietersen A, Lind B, Olesen MS, et al. Risk prediction of cardiovascular death based on the QTc interval: Evaluating age and gender differences in a large primary care population. Eur Heart J 2014; 35: 1335–1344.
- 25.
Zabel M, Hohnloser SH, Behrens S, Li YG, Woosley RL, Franz MR. Electrophysiologic features of Torsades De Pointes: Insights from a new isolated rabbit heart model. J Cardiovasc Electrophysiol 1997; 8: 1148–1158.
- 26.
Davey P. QT interval and mortality from coronary artery disease. Prog Cardiovasc Dis 2000; 42: 359–384.
- 27.
Elming H, Soone J, Lublin HKF. The importance of the QT interval: A review of the literature. Acta Psychiatr Scand 2003; 107: 96–101.
- 28.
Vyas H, Hejlik J, Ackerman MJ. Epinephrine QT stress testing in the evaluation of congenital long-QT syndrome: Diagnostic accuracy of the paradoxical QT response. Circulation 2006; 113: 1385–1392.
- 29.
Baumert M, Lambert GW, Dawood T, Lambert EA, Esler MD, McGrane M, et al. QT interval variability and cardiac norepinephrine spillover in patients with depression and panic disorder. Am J Physiol Heart Circ Physiol 2008; 295: H962–H968.
- 30.
Floras JS, Ponikowski P. The sympathetic/parasympathetic imbalance in heart failure with reduced ejection fraction. Eur Heart J 2015; 36: 1974–1982.

