Abstract
Background: Whether the magnitude and predictors of improvement in exercise capacity after cardiac rehabilitation (CR) are the same between young-old (YO) and octogenarian (OCT) patients with acute myocardial infarction (AMI) is unknown.
Methods and Results: We studied 284 YO (age range 65–69 years; mean [±SD] 67±1 years) and 65 OCT (age range ≥80 years; mean [±SD] 83±2 years) patients who participated in a post-AMI CR program. After 3 months of CR, peak oxygen uptake (PV̇O2) measured during cardiopulmonary exercise testing improved significantly in both age groups (P<0.01), although the percentage increase in PV̇O2
(%∆PV̇O2) was significantly smaller in the OCT than YO group (5.4±13.7% vs. 10.0±12.8%; P<0.01). Multiple regression analysis demonstrated that independent predictors of %∆PV̇O2
were the number of outpatient CR (OPCR) sessions attended (P=0.015), left ventricular ejection fraction (P=0.028), and baseline PV̇O2
(P=0.0007) in the YO group; and the number of sessions attended (P=0.018), atrial fibrillation (P=0.042), and the presence of nutritional risk (Geriatric Nutritional Risk Index ≤98; P=0.036) in the OCT group.
Conclusions: The predictors of improvement in exercise capacity after CR differed between the YO and OCT patients with AMI. To obtain a greater improvement in PV̇O2
in CR, frequent OPCR session attendance may be necessary in both groups; in addition, particularly in OCT patients, better nutritional status may be important.
The effectiveness of cardiac rehabilitation (CR) in improving exercise capacity, quality of life (QOL), and long-term prognosis in patients with acute myocardial infarction (AMI) has been established, and clinical guidelines strongly recommend active participation in CR after AMI onset.1–3 However, although the proportion of elderly and very elderly patients entering CR programs after AMI onset is rapidly increasing, evidence of the effectiveness of CR in these patients is not robust. Elderly patients are usually less fit and have a higher incidence of complications, leading to longer hospital stays and a greater risk of subsequent hospital-acquired deconditioning.4,5 Although previous reviews have summarized the beneficial effects of CR in elderly patients,6–8 most have focused on general elderly patients (i.e., those aged ≥65 years) with no distinction between early elderly (65–69 years) and very elderly (≥80 years) patients. Compared with early elderly patients, very elderly patients more often experience age-related complexities, including multiple comorbidities, poor nutrition, frailty, and other complications that add to the existing risks of deconditioning, disability, and other challenges.
Deley et al reported that CR significantly improved exercise capacity in all age groups (<65, 65–80, and ≥80 years) with mixed heart diseases.9 However, no study has directly compared the effects of CR on exercise capacity in early elderly (65–69 years; hereafter referred to as young-old [YO] patients) and very elderly patients (≥80 years; hereafter octogenarian [OCT] patients) with AMI. Furthermore, it is unknown whether the magnitude and predictors of improvements in exercise capacity after CR are the same between YO and OCT patients with AMI. Thus, the aims of the present study were to assess the effects of a 3-month CR program and determine the predictors of improvement in exercise capacity (peak oxygen uptake [PV̇O2]) after CR in YO and OCT patients with AMI.
Methods
Patients
We retrospectively studied 1,710 consecutive patients with AMI who participated in a recovery-phase CR program and underwent cardiopulmonary exercise testing (CPX) at the beginning and end of the 3-month program at the National Cerebral and Cardiovascular Center (NCVC) in Japan. Data were extracted for patients in the 2 age groups (297 YO, 86 OCT; Figure 1). Diagnoses of AMI, hypertension, dyslipidemia, and diabetes/impaired glucose tolerance were made by the attending physician for each patient. Thirty-four patients (13 YO, 21 OCT) were excluded because of technical problems in CPX (orthopedic problems or air leaks) or a peak respiratory exchange ratio (RER) <1.0, leaving 284 YO and 65 OCT patients in the final analysis.

This study was conducted in accordance with the Declaration of Helsinki and was approved by the Institutional Ethics Committee of the NCVC (Reference no. M26-015-2). Because of the retrospective nature of the study, the requirement for informed consent was waived by the ethics committee, with an opt-out method used instead.
CR Program
The CR program began at the cardiology ward approximately 4–7 days after AMI onset, followed by aerobic exercise rehabilitation at the CR gym, and was continued after hospital discharge for 3 months. Patients with angina or electrocardiogram (ECG) evidence of ischemic changes at a low level of exercise (walking test), uncontrolled heart failure, and serious arrhythmia were excluded. The program components included supervised exercise sessions (walking, bicycle ergometry, and calisthenics) and education, as described previously.10,11 The exercise intensity was determined individually at 50–60% of heart rate reserve (Karvonen’s equation, k=0.5–0.6)12,13 or an anaerobic threshold level of heart rate obtained in a maximal symptom-limited CPX or at level 12–13 (“slightly difficult”) of the 6–20 scale perceived rating of exercise (original Borg’s scale).14 The exercise program usually began with supervised in-hospital sessions (5 times/week) for 1–2 weeks, followed by supervised outpatient CR (OPCR) sessions (1–3 times/week) combined with home exercise for the remaining 9–11 weeks. Home exercise consisted mainly of brisk walking at a prescribed heart rate for 30–60 min, 3–5 times/week, and low-intensity resistance training for 10–20 min, 2–3 times/week.
Patients were encouraged to attend education classes, which were held 3–4 times each week, with lectures on coronary artery disease, heart failure, secondary prevention, diet, smoking cessation, medication, and physical activities given by physicians, nurses, dieticians, pharmacists, and exercise instructors. In addition, all patients received individual counseling on exercise prescription, secondary prevention, and activities of daily life by a physician and nurse at hospital discharge and at the end of the 3-month CR program. Patients were scheduled to undergo blood tests at the beginning and end of the 3-month CR program.
CPX
A symptom-limited CPX was performed at the beginning and end of the 3-month CR program.11 After a 2-min rest on the bicycle ergometer in the upright position, patients started pedaling at an intensity of 0 W for 1 min (warm-up), performed an incremental exercise test with a ramp protocol (10 or 15 W/min) until exhaustion, and then recovered for 5 min. Blood pressure was measured once per minute using a sphygmomanometer, and a 12-lead ECG was continuously monitored. Expired gas was collected and analyzed continuously using an AE-300S gas analyzer (Minato Co., Osaka, Japan). PV̇O2
was defined as the highest oxygen uptake (V̇O2) value achieved at peak exercise. Peak RER (the ratio of carbon dioxide output [V̇CO2] to V̇O2
at peak exercise) was used as a measure of patient effort during the testing, and a value of ≥1.0 was considered sufficient for the elderly patients. The slope of the relationship between minute ventilation (V̇E) and V̇CO2
until the respiratory compensation point was determined as an index of respiratory inefficiency.
Nutritional Status
Nutritional status was assessed by calculating the Geriatric Nutritional Risk Index (GNRI)15 from serum albumin and body mass index (BMI; weight [kg] divided by height [m] squared) using the following equation:
GNRI = 14.89 × serum albumin (g/dL) + 41.7 × BMI / 22
We classified GNRI into 2 categories according to Bouillanne et al:15 low GNRI (≤98 points), indicating a nutritional risk; and high GNRI (>98 points), indicating no nutritional risk.
Comorbidity
The comorbidity-related information required to calculate the Charlson comorbidity index was collected via chart reviews according to the approach and definitions established by Charlson et al.16
Data Analysis
First, clinical characteristics and exercise capacity at baseline were compared between the YO and OCT groups. Second, changes in CPX data and plasma B-type natriuretic peptide (BNP) concentrations from baseline to the end of the 3-month CR period were assessed in each group. Third, the percentage increase in peak V̇O2
(%∆PV̇O2) was compared between the YO and OCT groups. Finally, the predictors of %∆PV̇O2
were assessed by univariate and multivariate regression analyses for each group.
Statistical Analysis
Continuous data are expressed as the mean±SD and categorical data are presented as numbers and percentages. Baseline characteristics of the YO and OCT groups were compared using unpaired t-tests and Chi-squared tests. Data at the beginning and end of the 3-month CR were compared by paired t-test. Correlations between %∆PV̇O2
and baseline clinical data were examined by univariate regression analysis for each group. To determine the predictors of %∆PV̇O2, we performed a multiple regression analysis using variables with P<0.2 in the univariate analysis in each group. Statistical calculations were performed using the SAS version 11.0 (SAS Institute, Cary, NC, USA), and statistical significance was set at P<0.05 are P values two-tailed.
Results
Baseline Characteristics: YO Group vs. OCT Group
The results in the YO and OCT groups are summarized in Table 1. The prevalence of atrial fibrillation (AF) and prior myocardial infarction, Charlson comorbidity index, and log BNP concentrations were all significantly higher, whereas BMI, smoking rate, left ventricular ejection fraction (LVEF), hemoglobin, estimated glomerular filtration rate, and GNRI were lower, in the OCT than YO group. (Data for patients with ages of 70–79 years are presented in Supplementary Table 1.)
Table 1. Clinical Characteristics in Young-Old and Octogenarian Patients
| |
Young-old
(n=284) |
Octogenarian
(n=65) |
P value |
| Age (years) |
67±1 |
83±2 |
<0.0001 |
| Male sex (%) |
80 |
74 |
0.28 |
| BMI (kg/m2) |
23.2±2.8 |
22.2±2.7 |
0.013 |
| Hypertension (%) |
64 |
74 |
0.14 |
| Dyslipidemia (%) |
62 |
52 |
0.15 |
| Diabetes/IGT (%) |
53 |
44 |
0.21 |
| Smoking (%) |
37 |
14 |
<0.0001 |
| Killip ≥II (%) |
10 |
15 |
0.24 |
| Peak creatine kinase (U/L) |
2,746±2,135 (n=224) |
2,422±1,817 (n=51) |
0.32 |
| LVEF (%) |
48±7 |
46±6 |
0.035 |
| AF (%) |
9 |
26 |
0.0004 |
| Paroxysmal AF (%) |
1 |
6 |
0.025 |
| Chronic AF (%) |
8 |
20 |
0.0062 |
| Prior MI (%) |
8 |
20 |
0.0073 |
| Charlson comorbidity index |
2.8±1.7 |
3.3±1.5 |
0.027 |
| Log BNP (pg/mL) |
4.86±0.88 |
5.43±0.76 |
<0.0001 |
| Hemoglobin (g/dL) |
13.0±1.4 |
12.0±1.6 |
<0.0001 |
| eGFR (mL/min/1.73 m2) |
65±18 |
57±20 |
0.0021 |
| GNRI |
102±8 |
96±9 |
<0.0001 |
| Poor nutrition (GNRI ≤98; %) |
30 |
58 |
<0.0001 |
| Hospital stay (days) |
21±10 |
23±9 |
0.30 |
| In-hospital CR duration (days) |
6±4 |
7±4 |
0.66 |
| No. OPCR sessions attended |
14±10 |
10±6 |
0.0016 |
| Medications |
| β-blocker (%) |
60 |
67 |
0.39 |
| ACEI/ARB (%) |
75 |
79 |
0.62 |
| Statin (%) |
55 |
54 |
0.91 |
| Diuretic (%) |
9 |
26 |
0.0004 |
| CPX parameters at baseline |
| Peak RER |
1.25±0.10 |
1.18±0.11 |
<0.0001 |
| Heart rate response (peak–rest; beats/min) |
64±18 |
48±18 |
<0.0001 |
| Peak WR (W) |
110±22 |
80±17 |
<0.0001 |
| Peak V̇O2 (mL/min) |
1,239±284 |
940±203 |
<0.0001 |
| Peak V̇O2 (mL/kg/min) |
20.4±3.9 |
16.7±2.7 |
<0.0001 |
| Peak V̇O2 (% predicted) |
77±14 |
80±13 |
0.49 |
| V̇E–V̇CO2 slope |
30.5±5.0 |
33.6±5.3 |
<0.0001 |
Unless indicated otherwise, values are presented as the mean±SD. ACEI, angiotensin-converting enzyme inhibitor; AF, atrial fibrillation; ARB, angiotensin II receptor blocker; BMI, body mass index; BNP, B-type natriuretic peptide; CPX, cardiopulmonary exercise testing; CR, cardiac rehabilitation; eGFR, estimated glomerular filtration rate; GNRI, Geriatric Nutritional Risk Index; IGT, impaired glucose tolerance; LVEF, left ventricular ejection fraction; MI, myocardial infarction; OPCR, outpatient cardiac rehabilitation; RER, respiratory exchange ratio; V̇CO2, carbon dioxide output; V̇E, minute ventilation; V̇O2, oxygen uptake; WR, work rate.
Regarding baseline CPX data, compared with the YO group, the OCT group had a lower peak RER, lower heart rate response, lower peak work rate, lower PV̇O2, and higher V̇E–V̇CO2
slope, all of which were anticipated by the definition of each group. In contrast, percentage of predicted PV̇O2
did not differ significantly between the 2 groups.
Effects of CR
Table 2 summarizes results for each of the parameters before and after the 3-month CR in the YO and OCT groups. Peak RER before and after CR was sufficiently high and not significantly different, indicating that maximal effort was achieved during CPX both before and after CR in both groups. After the 3-month CR, peak work rate, PV̇O2, and log BNP concentration improved significantly in both groups, whereas heart rate response and the V̇E–V̇CO2
slope improved significantly only in the YO group. (Data for patients aged 70–79 years are presented in Supplementary Table 2.)
Table 2. Clinical and Exercise Test Data of Young-Old and Octogenarian Patients Before and After OPCR
| |
Young-old (n=284) |
Octogenarian (n=65) |
| Before CR |
After CR |
P value |
Before CR |
After CR |
P value |
| BMI (kg/m2) |
23.2±2.8 |
23.1±2.8 |
0.99 |
22.2±2.7 |
22.0±2.6 |
0.21 |
| Hemoglobin (g/dL) |
13.0±1.4 |
13.6±1.3 |
<0.0001 |
12.0±1.6 |
12.7±1.3 |
<0.0001 |
| eGFR (mL/min/1.73 m2) |
65±18 |
65±17 |
0.63 |
57±20 |
55±16 |
0.27 |
| Log BNP (pg/mL) |
4.86±0.88 |
4.19±0.92 |
<0.0001 |
5.43±0.76 |
4.91±0.84 |
<0.0001 |
| CPX data |
| Peak RER |
1.25±0.10 |
1.24±0.10 |
0.12 |
1.18±0.11 |
1.18±0.08 |
0.97 |
| Heart rate response (peak–rest; beats/min) |
64±18 |
69±18 |
<0.0001 |
48±18 |
50±19 |
0.13 |
| Peak WR (W) |
110±22 |
120±25 |
<0.0001 |
80±17 |
83±20 |
0.015 |
| Peak V̇O2 (mL/min) |
1,239±284 |
1,356±314 |
<0.0001 |
940±203 |
978±226 |
0.0093 |
| Peak V̇O2 (mL/kg/min) |
20.4±3.9 |
22.3±4.3 |
<0.0001 |
16.7±2.7 |
17.5±3.2 |
0.0024 |
| Peak V̇O2 (% predicted) |
77±14 |
85±16 |
<0.0001 |
80±13 |
84±15 |
0.0024 |
| V̇E–V̇CO2 slope |
30.5±5.0 |
29.3±4.2 |
<0.0001 |
33.6±5.3 |
32.9±5.0 |
0.24 |
Unless indicated otherwise, values are presented as the mean±SD. Abbreviations as inTable 1.
Figure 2 compares %∆PV̇O2
between the YO and OCT groups. At the end of the 3-month CR, %∆PV̇O2
was significantly smaller in the OCT than YO group (5.4% vs. 10.0%; P<0.01).
Predictors of %∆PV̇O2
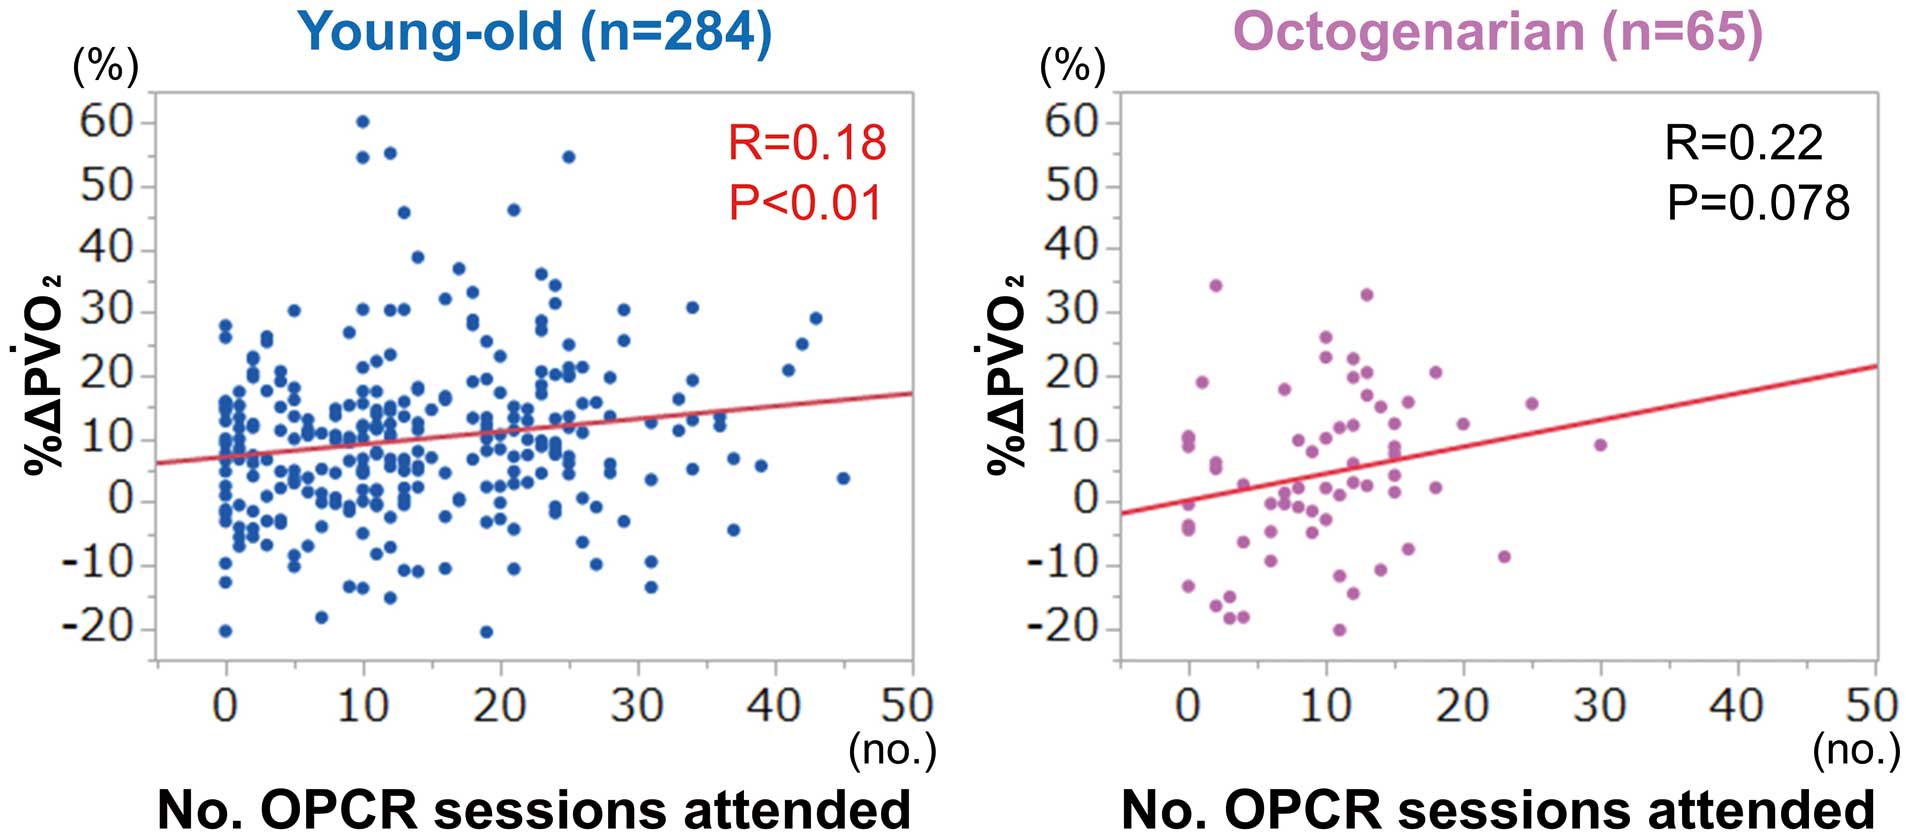
Figure 3 shows the correlation between %∆PV̇O2
and the number of OPCR sessions attended in the 2 groups. %∆PV̇O2
was significantly correlated with the number of OPCR sessions attended in the YO group (R=0.18, P<0.01), but there was only a tendency for such a correlation in the OCT group (R=0.22, P=0.078).
Figure 4A compares %∆PV̇O2
between AF and sinus rhythm patients in the 2 groups. %∆PV̇O2
was significantly higher in sinus rhythm than in AF patients in the OCT group, but not in the YO group. Figure 4B compares %∆PV̇O2
between patients with poor (GNRI ≤98) and normal (GNRI >98) nutrition in the 2 groups. %∆PV̇O2
tended to be lower among patients with poor nutrition than among those with normal nutrition in the OCT group.

Table 3 summarizes the results of univariate and multivariate analyses of the predictors of %∆PV̇O2
in the 2 groups. Univariate analysis revealed that, in the YO group, the number of OPCR sessions attended (P=0.0018), LVEF (P=0.016), and PV̇O2
at baseline (P<0.0001) were significantly associated with %∆PV̇O2; in the OCT group, only AF (P=0.032) was significantly correlated with %∆PV̇O2. The multiple regression analyses revealed that, in the YO group, the number of OPCR sessions attended, LVEF, and PV̇O2
at baseline were independent predictors of %∆PV̇O2. In contrast, in the OCT group, the number of OPCR sessions attended, AF, and poor nutrition were independent predictors of %∆PV̇O2.
Table 3. Univariate and Multivariate Regression Analyses of the Percentage Increases in Peak V̇O
2
| |
Young-old (65–69 years) |
Octogenarian (≥80 years) |
| Univariate |
Multivariate* |
Univariate |
Multivariate** |
| R |
P value |
β |
P value |
R |
P value |
β |
P value |
| No. OPCR sessions attended |
0.18 |
0.0018 |
0.16 |
0.015 |
0.22 |
0.078 |
0.28 |
0.018 |
| LVEF |
−0.15 |
0.016 |
−0.16 |
0.028 |
−0.12 |
0.19 |
−0.16 |
0.20 |
| Peak V̇O2 at baseline |
−0.24 |
<0.0001 |
−0.24 |
0.0007 |
−0.16 |
0.17 |
−0.20 |
0.10 |
| Log BNP |
0.11 |
0.088 |
−0.079 |
0.32 |
−0.051 |
0.69 |
|
|
| AF |
0.043 |
0.47 |
|
|
0.27 |
0.032 |
−0.24 |
0.042 |
| Poor nutrition (GNRI ≤98) |
0.044 |
0.52 |
|
|
0.20 |
0.12 |
−0.26 |
0.036 |
*P<0.0001, R2=0.10; **P=0.0066, R2=0.24. Factor selection criteria: univariate P<0.2. Abbreviations as inTable 1.
Discussion
The major findings of the present study are that: (1) OCT patients showed significant improvements in PV̇O2
after 3-month CR, despite having greater comorbidity and frailty burdens than the YO patients; (2) the magnitude of %∆PV̇O2
was significantly smaller in the OCT group than in the YO group; and (3) the predictors of %∆PV̇O2
differed between the OCT and YO groups, with a higher number of OPCR sessions attended being a significant predictor in both groups, lower LVEF and PV̇O2
at baseline being predictors in the YO group, and the absence of AF and a better GNRI being predictors in the OCT group. These findings suggest the importance of frequent OPCR session attendance and better nutritional status in improving exercise capacity in OCT patients participating in CR after AMI.
Previous Studies
Only a few studies reported the effects of CR in OCT patients compared with younger patients with respect to the magnitude and predictors of an improvement in exercise capacity. Scimia et al17 reported that CR significantly improved 6-min walk distance in OCT patients with heart diseases. Mehta et al18 reported a significant improvement in physical performance (in terms of metabolic equivalents) after CR in patients with coronary artery disease aged ≥80 years. However, these studies did not measure PV̇O2
or analyze the predictors of an improvement in exercise capacity. Deley et al reported that CR also significantly improved peak workload in all age groups (<65, 65–80, and ≥80 years) with mixed heart diseases,9 whereas Ehsani et al reported that the increase in PV̇O2
after exercise training was attenuated in healthy OCT subjects;19 however, neither of these studies analyzed the predictors of the improvement in exercise capacity. Thus, to our knowledge, the present study is the first to directly compare the magnitude of improvements in PV̇O2
after CR between YO and OCT patients with AMI and to determine the predictors of the improvement in PV̇O2
in OCT patients.
Present Study
A notable finding of the present study is that %∆PV̇O2
after CR was significantly smaller (mean 5.4% vs. 10.0%) in OCT patients than in YO patients with AMI. This finding is not attributed to insufficient effort during CPX in the OCT patients because patients with insufficient effort during CPX (i.e., peak RER <1.0) were excluded from the analysis, and the resultant peak RER was sufficiently high (mean 1.18) before and after CR in the OCT group (Table 2). The age-dependent attenuation of the training effect on PV̇O2
may not be confined to OCT patients with AMI but may hold true in healthy OCT subjects.19 The American Heart Association scientific statement on functional capacity in elderly patients with cardiovascular disease20 suggested that an increase in PV̇O2
of >7% from baseline is a clinically meaningful improvement in aerobic capacity in elderly patients, because such an increase in PV̇O2
may allow these patients to perform meaningful aerobic activities that were previously not possible. However, Fleg et al21 reported that PV̇O2
in healthy subjects declines according to age and that the rate of decline accelerates from 6% per 10 years in those in their 30 s to >20% per 10 years in those in their 70 s and beyond, resulting in a markedly reduced PV̇O2
at 80 years, approximately 50% of that in the third decade. In this sense, a statistically significant increase in PV̇O2
of 5.4%, even though small in magnitude, may be a physiologically meaningful gain (i.e., a reversal of a natural decline) in exercise capacity in OCT patients.
Predictors of %∆PV̇O2
After CR
The notable predictors of %∆PV̇O2
found in the present study deserve further discussion. First, the number of OPCR sessions attended was a significant predictor of %∆PV̇O2
in both groups. In a previous meta-regression analysis of relatively young patients with heart failure (median age 60 years), session frequency was indicated as a predictor of an improvement in exercise capacity.22 Another meta-regression analysis in healthy sedentary elderly subjects (mean [±SD] age 67±5 years) reported that aerobic training 3–4 days/week appears to be optimal for PV̇O2
gain.23 Thus, although session attendance frequency has been reported to be a predictor of %∆PV̇O2
in relatively young populations with heart failure or healthy elderly populations, the present study is the first to show that frequent OPCR participation is a significant predictor of greater PV̇O2
gain in OCT patients with AMI.
Regarding the optimal session attendance frequency, a recent meta-regression analysis in healthy and unhealthy elderly participants (mostly aged in their 70 s) reported that PV̇O2
gain after exercise training did not significantly differ between session frequencies of 3 and 4–5 times/week.24 Because the session attendance of our patients (range 0–44 times in 9–11 weeks) corresponds to an attendance frequency of 0–4 times/week, it remains unclear whether a frequency of 5 times/week is more effective than a frequency of 3–4 times/week in obtaining a greater PV̇O2
gain in OCT patients.
Second, the present study demonstrated that a better nutritional status may lead to a greater %∆PV̇O2
in OCT patients but not in YO patients. Yu et al reported that malnutrition was a negative predictor of an improvement in the 6-min walk distance in very elderly patients (median age 76 years) who participated in CR after transcatheter aortic valve implantation.25 The present study quantitatively extended these findings to OCT patients with AMI by measuring PV̇O2
and comparing OCT patients to YO patients. The reason for the significant association between nutritional status and %∆PV̇O2
in OCT patients but not YO patients may be that a higher prevalence of sarcopenia in OCT than YO patients may have enhanced the influence of nutritional status on the improvement in exercise capacity after CR.26
Third, AF was a significant negative predictor of %∆PV̇O2
in the OCT but not YO group in the present study. Previous studies reported that the increase in PV̇O2
with exercise training did not differ significantly between patients with and without AF.27,28 Because the participants in these previous studies were relatively young (mean age 55–59 years), the present finding in YO patients does not contradict the findings in the previous studies. In contrast, the present finding that OCT patients with AF have poor PV̇O2
responses to exercise training is new, and, if confirmed in studies with larger numbers of patients, the current standard of exercise prescription in CR for very elderly patients with AF may require reconsideration.
Finally, the present study demonstrated that baseline exercise capacity is a significant predictor of %∆PV̇O2
after CR in YO but not OCT patients. Previous studies reported that the improvement in exercise capacity after exercise training was inversely correlated with baseline exercise capacity.29,30 Sakuragi et al30 reported that in relatively young patients with AMI (mean age 61 years), baseline PV̇O2
is determined by the duration of inactivity (hospital-acquired physical deconditioning) and residual pulmonary congestion after AMI onset, both of which are reversible and thus account for the inverse correlation between baseline PV̇O2
and %∆PV̇O2. In contrast, in very elderly patients with AMI, baseline exercise capacity is likely to be affected by factors other than short-term physical deconditioning and pulmonary congestion (i.e., pre-existing sarcopenia, malnutrition, autonomic nerve dysfunction, and multiple comorbidities), all of which may be non-reversible or not easily ameliorated during a short (3 months) period of CR. Therefore, an individualized exercise program for a longer period rather than a routine uniform 3-month CR may be necessary for very elderly patients with a low baseline exercise capacity.
Clinical Implications
The present findings have important clinical implications for OCT patients undergoing CR. Regarding session attendance frequency, a meta-regression analysis reported that the increase in exercise capacity after exercise training is primarily determined by total energy expenditure (a product of session frequency, session duration, training intensity, and program length), followed by session frequency, duration, and intensity.22 However, in very elderly patients, increasing the exercise intensity or duration may increase the risk of orthopedic injury and is practically difficult. In addition, a dose–response relationship has been reported between the number of CR sessions attended and better long-term outcomes in elderly patients with coronary artery disease (mean age 74 years).31 Therefore, increasing the session attendance frequency may help attain a greater increase in exercise capacity and potentially favorable outcomes in very elderly patients. However, considering the difficulty in commuting to OPCR centers, alternative models for frequent session attendance, such as hybrid (combining center- and home-based) CR32 or home-based mobile-guided CR,33 would help enhance the effectiveness of CR in very elderly patients.
Regarding the management of malnutrition or sarcopenia in elderly patients, a recent topic of consideration is whether the progressive age-related decline in muscle mass and function can be counteracted by protein supplementation with or without resistance training. A recent meta-analysis showed improved muscle mass and walking capacity with a combination of protein supplementation and muscle-strengthening exercise in older adults at a risk of sarcopenia or frailty (mean age 79 years).34 Then, in OCT patients with malnutrition or sarcopenia, combination therapy that includes both nutritional and exercise interventions could potentially lead to a greater improvement in exercise capacity compared with either exercise or nutrition therapy alone.
Finally, the clinical significance of an improvement in exercise capacity on QOL and prognosis in OCT patients deserves discussion. An American Heart Association Scientific Statement stated that an increase in PV̇O2, even modest, may allow elderly patients to perform meaningful activities of daily living that were previously not possible.20 In fact, in the Rehabilitation Therapy in Older Acute Heart Failure (REHAB-HF) trial, an improvement in functional capacity obtained by physical rehabilitation was significantly associated with an improvement in QOL in elderly patients (mean age 73 years) hospitalized for acute decompensated heart failure.35 In addition, the Agency for Medical Research and Development (AMED) CR study in Japan reported that elderly heart failure patients (mean age 68 years) with frailty who participated in OPCR had a better long-term prognosis than non-participants.36 Regarding OCT patients, Martínez-Velilla et al reported that short-term (5 days) in-hospital physical rehabilitation improved both functional capacity and QOL in OCT patients (mean age 87 years).37 However, further studies are needed to investigate whether an improvement in exercise capacity obtained by recovery-phase CR is associated with improvements in QOL and prognosis in OCT patients.
Study Limitations
The present study has several limitations. First, this study was a retrospective analysis and the number of OCT patients was relatively small. However, to date, no study has investigated very elderly patients with AMI (including 65 OCT patients) with measurements of PV̇O2
both at baseline and after OPCR and an analysis of %∆PV̇O2. Second, OCT patients who were unable to undergo CPX were not included in this study. Therefore, the present results cannot be generalized to OCT patients with more severe frailty. However, in such patients with severe frailty, an accurate assessment of exercise capacity without measurement of PV̇O2
in CPX may be problematic. Third, although we recommended our patients perform exercises at home in addition to center-based CR sessions, we were unable to quantitate the amount of exercise performed at home. Therefore, the number of OPCR sessions may not necessarily be an accurate measure of the total amount of exercise performed over the 3-month CR period in the present study. In future studies, the total amount of exercise, including both center-based OPCR sessions and home exercise, should be quantitated using devices such as pedometers or wearable devices.
Conclusions
The predictors of improvement in exercise capacity after CR differed between the YO and OCT patients with AMI. To obtain a greater improvement in PV̇O2
in CR, frequent OPCR session attendance may be necessary in both groups and, particularly in the case of OCT patients, better nutritional status may be important.
Acknowledgments
The authors would thank Editage (www.editage.com) for English language editing.
Sources of Funding
This study did not receive any funding.
Disclosures
T.N. and S.Y. are members of Circulation Journal’s Editorial Team.
IRB Information
This study was approved by the Ethics Committee of the NCVC (Reference no. M26-015-2).
Data Availability
The deidentified participant data will not be shared.
Supplementary Files
Please find supplementary file(s);
https://doi.org/10.1253/circj.CJ-22-0606
References
- 1.
Kimura K, Kimura T, Ishihara M, Nakagawa Y, Nakao K, Miyauchi K, et al. JCS 2018 guideline on diagnosis and treatment of acute coronary syndrome. Circ J 2019; 83: 1085–1196.
- 2.
Ibanez B, James S, Agewall S, Antunes MJ, Bucciarelli-Ducci C, Bueno H, et al. 2017 ESC guidelines for the management of acute myocardial infarction in patients presenting with ST-segment elevation: The Task Force for the Management of Acute Myocardial Infarction in Patients Presenting With ST-Segment Elevation of the European Society of Cardiology (ESC). Eur Heart J 2018; 39: 119–177.
- 3.
Makita S, Yasu T, Akashi YJ, Adachi H, Izawa H, Ishihara S, et al. JCS/JACR 2021 guideline on rehabilitation in patients with cardiovascular disease. Circ J 2023; 87: 155–235.
- 4.
Wenger NK. Current status of cardiac rehabilitation. J Am Coll Cardiol 2008; 51: 1619–1631.
- 5.
Gordon S, Grimmer KA, Barras S. Assessment for incipient hospital-acquired deconditioning in acute hospital settings: A systematic literature review. J Rehabil Med 2019; 51: 397–404.
- 6.
Schopfer DW, Forman DE. Cardiac rehabilitation in older adults. Can J Cardiol 2016; 32: 1088–1096.
- 7.
Lutz AH, Forman DE. Cardiac rehabilitation in older adults: Apropos yet significantly underutilized. Prog Cardiovasc Dis 2022; 70: 94–101.
- 8.
Menezes AR, Lavie CJ, Milani RV, Arena RA, Church TS. Cardiac rehabilitation and exercise therapy in the elderly: Should we invest in the aged? J Geriatr Cardiol 2012; 9: 68–75.
- 9.
Deley G, Culas C, Blonde MC, Mourey F, Verges B. Physical and psychological effectiveness of cardiac rehabilitation: Age is not a limiting factor! Can J Cardiol 2019; 35: 1353–1358.
- 10.
Kamakura T, Kawakami R, Nakanishi M, Ibuki M, Ohara T, Yanase M, et al. Efficacy of out-patient cardiac rehabilitation in low prognostic risk patients after acute myocardial infarction in primary intervention era. Circ J 2011; 75: 315–321.
- 11.
Takaya Y, Kumasaka R, Arakawa T, Ohara T, Nakanishi M, Noguchi T, et al. Impact of cardiac rehabilitation on renal function in patients with and without chronic kidney disease after acute myocardial infarction. Circ J 2014; 78: 377–384.
- 12.
Karvonen MJ, Kentala E, Mustala O. The effects of training on heart rate; a longitudinal study. Ann Med Exp Biol Fenn 1957; 35: 307–315.
- 13.
Fletcher GF, Balady GJ, Amsterdam EA, Chaitman B, Eckel R, Fleg J, et al. Exercise standards for testing and training: A statement for healthcare professionals from the American Heart Association. Circulation 2001; 104: 1694–1740.
- 14.
Borg G. Perceived exertion as an indicator of somatic stress. Scand J Rehabil Med 1970; 2: 92–98.
- 15.
Bouillanne O, Morineau G, Dupont C, Coulombel I, Vincent JP, Nicolis I, et al. Geriatric Nutritional Risk Index: A new index for evaluating at-risk elderly medical patients. Am J Clin Nutr 2005; 82: 777–783.
- 16.
Charlson ME, Pompei P, Ales KL, MacKenzie CR. A new method of classifying prognostic comorbidity in longitudinal studies: Development and validation. J Chronic Dis 1987; 40: 373–383.
- 17.
Scimia F, Casadei I, Cerquetani E, Piccoli M, Villa A, La Carrubba S, et al. Functional evaluation of ultra-octogenarian patients undergoing cardiac rehabilitation: Correlation between six minute walking test and Rivermead mobility index. Monaldi Arch Chest Dis 2010; 74: 159–163.
- 18.
Mehta H, Sacrinty M, Johnson D, St Clair M, Paladenech C, Robinson K. Comparison of usefulness of secondary prevention of coronary disease in patients <80 versus ≥80 years of age. Am J Cardiol 2013; 112: 1099–1103.
- 19.
Ehsani AA, Spina RJ, Peterson LR, Rinder MR, Glover KL, Villareal DT, et al. Attenuation of cardiovascular adaptations to exercise in frail octogenarians. J Appl Physiol (1985) 2003; 95: 1781–1788.
- 20.
Forman DE, Arena R, Boxer R, Dolansky MA, Eng JJ, Fleg JL, et al. Prioritizing functional capacity as a principal end point for therapies oriented to older adults with cardiovascular disease: A scientific statement for healthcare professionals from the American Heart Association. Circulation 2017; 135: e894–e918.
- 21.
Fleg JL, Morrell CH, Bos AG, Brant LJ, Talbot LA, Wright JG, et al. Accelerated longitudinal decline of aerobic capacity in healthy older adults. Circulation 2005; 112: 674–682.
- 22.
Vromen T, Kraal JJ, Kuiper J, Spee RF, Peek N, Kemps HM. The influence of training characteristics on the effect of aerobic exercise training in patients with chronic heart failure: A meta-regression analysis. Int J Cardiol 2016; 208: 120–127.
- 23.
Huang G, Wang R, Chen P, Huang SC, Donnelly JE, Mehlferber JP. Dose-response relationship of cardiorespiratory fitness adaptation to controlled endurance training in sedentary older adults. Eur J Prev Cardiol 2016; 23: 518–529.
- 24.
Cheour S, Cheour C, Bragazzi NL, Zou L, Paravlic AH, Slimani M, et al. Dose-response relationship between endurance training prescription variables and increases in aerobic performance of healthy and unhealthy middle and very old individuals aged 70 years and older: A systematic review and meta-analysis of randomized controlled trials. Life (Basel) 2021; 11: 121, doi:10.3390/life11020121.
- 25.
Yu Z, Zhao Q, Ye Y, Wang M, Zhou Z, Zhang H, et al. Comprehensive geriatric assessment and exercise capacity in cardiac rehabilitation for patients referred to transcatheter aortic valve implantation. Am J Cardiol 2021; 158: 98–103.
- 26.
Yoshimura Y, Wakabayashi H, Bise T, Nagano F, Shimazu S, Shiraishi A, et al. Sarcopenia is associated with worse recovery of physical function and dysphagia and a lower rate of home discharge in Japanese hospitalized adults undergoing convalescent rehabilitation. Nutrition 2019; 61: 111–118.
- 27.
Vanhees L, Schepers D, Defoor J, Brusselle S, Tchursh N, Fagard R. Exercise performance and training in cardiac patients with atrial fibrillation. J Cardiopulm Rehabil 2000; 20: 346–352.
- 28.
Luo N, Merrill P, Parikh KS, Whellan DJ, Pina IL, Fiuzat M, et al. Exercise training in patients with chronic heart failure and atrial fibrillation. J Am Coll Cardiol 2017; 69: 1683–1691.
- 29.
Shiran A, Kornfeld S, Zur S, Laor A, Karelitz Y, Militianu A, et al. Determinants of improvement in exercise capacity in patients undergoing cardiac rehabilitation. Cardiology 1997; 88: 207–213.
- 30.
Sakuragi S, Takagi S, Suzuki S, Sakamaki F, Takaki H, Aihara N, et al. Patients with large myocardial infarction gain a greater improvement in exercise capacity after exercise training than those with small to medium infarction. Clin Cardiol 2003; 26: 280–286.
- 31.
Hammill BG, Curtis LH, Schulman KA, Whellan DJ. Relationship between cardiac rehabilitation and long-term risks of death and myocardial infarction among elderly Medicare beneficiaries. Circulation 2010; 121: 63–70.
- 32.
Heindl B, Ramirez L, Joseph L, Clarkson S, Thomas R, Bittner V. Hybrid cardiac rehabilitation: The state of the science and the way forward. Prog Cardiovasc Dis 2022; 70: 175–182.
- 33.
Snoek JA, Prescott EI, van der Velde AE, Eijsvogels TMH, Mikkelsen N, Prins LF, et al. Effectiveness of home-based mobile guided cardiac rehabilitation as alternative strategy for nonparticipation in clinic-based cardiac rehabilitation among elderly patients in Europe: A randomized clinical trial. JAMA Cardiol 2021; 6: 463–468.
- 34.
Liao CD, Chen HC, Huang SW, Liou TH. The role of muscle mass gain following protein supplementation plus exercise therapy in older adults with sarcopenia and frailty risks: A systematic review and meta-regression analysis of randomized trials. Nutrients 2019; 11: 1713, doi:103390/nu11081713.
- 35.
Whellan D, McCarey MM, Chen H, Nelson MB, Pastva AM, Duncan P, et al. Quality of life trajectory and its mediators in older patients with acute decompensated heart failure receiving a multi-domain rehabilitation intervention: Results from the Rehabilitation Therapy in Older Acute Heart Failure Patients trial. Circ Heart Fail 2022; 15: e009695.
- 36.
Kamiya K, Sato Y, Takahashi T, Tsuchihashi-Makaya M, Kotooka N, Ikegame T, et al. Multidisciplinary cardiac rehabilitation and long-term prognosis in patients with heart failure. Circ Heart Fail 2020; 13: e006798.
- 37.
Martínez-Velilla N, Casas-Herrero A, Zambom-Ferraresi F, Saez de Asteasu ML, Lucia A, Galbete A, et al. Effect of exercise intervention on functional decline in very elderly patients during acute hospitalization: A randomized clinical trial. JAMA Intern Med 2019; 179: 28–36.