Abstract
Background: Dynamic chest radiography (DCR) produces sequential radiographs within a short examination time. It is also inexpensive and only uses a low dose of radiation. Because of the lack of reports of evaluating cardiac function using DCR in humans, we investigated its discriminative ability for left ventricular (LV) dysfunction in a study cohort.
Methods and Results: We analyzed the DCR pixel values of 4 circular regions of interest (ROIs) in the hearts of 61 patients with cardiovascular disease and 10 healthy volunteers. We evaluated the relationship between changes in pixel value in the heart and the LV ejection fraction (LVEF) by echocardiography. We constructed receiver operating characteristic (ROC) curves to evaluate whether the percent change in pixel value (%∆pixel value) could be used to identify patients with reduced LVEF. A total of 21 patients had reduced LVEF (LVEF <50%), and 40 had preserved LVEF (LVEF ≥50%). The correlation between LVEF and %∆pixel value in each ROI was significant, and the area under the ROC curve of the %∆pixel values for identifying patients with reduced LVEF was satisfactory (0.808–0.827) in 3 ROIs where the entire circular area was within the cardiac shadow.
Conclusions: LV dysfunction can be detected by changes in the pixel value on DCR.
The number of people with cardiac disease is increasing because of the extended life expectancy of the general population.1 When managing patients with cardiac disease, it is essential to evaluate cardiac function, especially the left ventricular ejection fraction (LVEF), which is frequently used to classify pathologies and determine appropriate therapeutic strategies.2–4 Most commonly, echocardiography is used to evaluate LVEF, but it is time-consuming and requires well-trained sonographers,2 so an easier method for examining cardiac function would be desirable.
Editorial p 168
Dynamic chest radiography (DCR) was developed to easily but more accurately evaluate pulmonary function.5,6 It produces sequential radiographs at 15–30 frames/s, which can be performed over an additional 10–15 s compared with the time required for conventional chest radiography. Without the use of contrast media, DCR provides functional information on rib and diaphragm motion, cardiac motion, pulmonary ventilation, and perfusion. As well as its short examination time, it is cost-effective and exposes the patient to a low dose of radiation.7–15 With its advanced digital image processing, DCR also allows quantitative assessment of changes in pixel values during the cardiac cycle.
Regarding the pulmonary circulation, we previously reported16 that the magnitude of change in the pixel value in the lung field of monkeys, as measured by DCR, correlated with the degree of pulmonary circulation. Thus, changes in pixel values in the lung field reflect the minute beating of pulmonary vessels.16 Several other reports have shown that DCR enables diagnosis of pulmonary embolism in humans using the same method.17–20 In terms of cardiac function, the EF of a heart phantom model correlated with the pixel value obtained by DCR.10 However, there are no reports of evaluating cardiac EF in humans or animals using DCR, so our aim in the present study was to identify whether there is a relationship between LVEF and the magnitude of change in the pixel values on DCR in the left heart field and whether it is possible to detect patients with reduced LVEF using DCR.
Methods
Study Population
This study was a single-center, retrospective study that included patients with cardiovascular diseases who underwent transthoracic echocardiography (TTE) and DCR between August 2020 and October 2021. The exclusion criteria were: (1) age <18 years, (2) patients with cardiac devices, (3) patient unable to hold their breath, and (4) patients in whom there was difficulty identifying the left edge of the cardiac shadow and the border of the diaphragm due to pleural fluid or prominent cardiac dilatation. The clinical data of the patients were collected from the institutional medical records and the database of the echocardiography laboratory. In addition, because of our interest in the pixel value changes on DCR in people with apparently good LV contractility, healthy volunteers without a medical history or abnormal findings on TTE were also included in this study. This study was approved by the Institutional Review Board and Ethics Committee of Shiga University of Medical Science (approval number: 2019-150) and was performed in accordance with the Declaration of Helsinki. All participants provided written informed consent before undergoing DCR.
Echocardiography
All participants underwent comprehensive echocardiography performed while supine or in the left lateral position by experienced sonographers or doctors using commercially available ultrasound machines. All measurements were obtained according to current guidelines.4 LV end-diastolic diameter (LVEDD) and LV end-systolic diameter (LVESD) were measured in the long parasternal view, while LVEF was measured in the apical 2- and 4-chamber views using the biplane modified Simpson’s method. Reduced and preserved LVEF were defined as <50% and ≥50%, respectively. LV mass (LVM) was calculated using the following validated formula: LVM = 0.8 × [1.04 (interventricular septal thickness + LV posterior wall thickness + LVEDD)3 − (LVEDD)3] + 0.6.
DCR
Posteroanterior DCR was performed using a prototype system comprising an indirect-conversion flat-panel detector (PaxScan, 4343CB; Varex Imaging Corporation, Salt Lake City, UT, US), an X-ray tube (RAD-94/B-130H; Varian Medical Systems, Inc., Palo Alto, CA, US), and a pulsed X-ray generator (EPS45RF; EMD Technologies, SaintEustache, Canada). All participants were scanned for approximately 7 s while seated and holding their breath. The exposure conditions were: tube voltage, 100 kV; tube current, 40 mA; pulsed X-ray duration, 5 ms; source-to-image distance, 2 m; additional filter, 0.5 mm Al+0.1 mm Cu. The matrix size was 1,024×1,024 pixels, the pixel size was 417×417 μm, and the whole image area was 42.7×42.7 cm. The pixel value range in each flat-panel detector pixel was 65,536 (16 bit). The pixel value is proportional to the entrance surface dose at 0–58,000 and saturated at >58,000. The frame rate to detect a high temporal change in pixel value is 15 frames/s. The entrance skin dose is 0.56 mGy in 7 s, which is less than the dose limit for 2 projections (posterior, anterior, and lateral) recommended in the International Atomic Energy Agency guidelines.21
DCR Analysis
A circular region of interest (ROI) with a diameter of 20 mm was located on the left edge of the cardiac shadow corresponding to the left ventricle on DCR. To identify the most appropriate position for the ROI, we placed 4 ROIs with a left edge of 10 mm medial, 5 mm medial, just touching, and 5 mm lateral to the left edge of the cardiac shadow in diastole (Figure 1A,B). A series of pixel values over the 7 s in each ROI was obtained, and the most stable 3-s interval with the smallest difference between the maximum and minimum values was extracted from these signals (Figure 1C). The maximum and minimum values of this 3-s interval were used for further analysis. This procedure enabled us to exclude the large fluctuations that often occur at the beginning of the signal. Filtering was not performed in order to avoid missing the waveform information with filtering. The percent change in pixel value (%∆pixel value) was calculated from the maximum and minimum values using the formula:

%∆pixel value (%) = (maximum value − minimum value) ÷ maximum value.
The cardiothoracic ratio (CTR) was calculated from the transverse thoracic diameter and heart diameter in diastole on the DCR images. The percent change in the transverse heart diameter (%∆transverse diameter) was calculated from the transverse heart diameters in diastole and systole, according to the formula:
%∆transverse diameter (%) = (transverse heart diameter in diastole − transverse heart diameter in systole) ÷ transverse heart diameter in diastole.
Statistical Analysis
Categorical variables are presented as number and percentage and were compared using Fisher’s exact test. Continuous variables are expressed as median and interquartile range (IQR), and were compared using the Mann-Whitney U test. The effect size, which represents the magnitude of the between-group difference in DCR pixel values (difference between patients with reduced and preserved LVEF), was calculated using the Z statistic of the Mann-Whitney U test. The relationship between LVEF and the %∆pixel value was visualized in a scatter plot, and Spearman’s rank correlation coefficient was calculated. A receiver operating characteristic (ROC) curve analysis was performed to evaluate whether the %∆pixel value could be used to identify patients with reduced LVEF, and the area under the ROC curve (AUC) value was calculated. Two types of threshold were calculated: one attaining ≥95% sensitivity and the other attaining ≥ 95% specificity. All reported P values were two-tailed, and a P value <0.05 was considered statistically significant. Statistical analyses were performed with SAS 9.4 (SAS Institute Inc., Cary, NC, US).
Results
Study Population
The study flowchart is shown in Figure 2. During the study registration period we performed DCR on 75 patients and 10 healthy volunteers, from whom we excluded 6 patients who were unable to hold their breath and 8 patients in whom we had difficulty identifying the left edge of the cardiac shadow on DCR. Finally, 61 patients and 10 healthy volunteers were enrolled. Of the 61 patients in the study population, 21 had reduced LVEF, and 40 had preserved LVEF. The median (IQR) interval between the dates of DCR and TTE was 5 (1–27) days. The baseline characteristics of all participants are presented in Table 1. No significant difference in age was found between the groups with reduced or preserved LVEF (73 [62–76] vs. 72 [54–79] years, respectively; P=0.994). The group with reduced LVEF had a significantly fewer female patients (24% vs. 68%; P=0.003) and the patients had a larger body surface area (BSA) (1.7 [1.5–1.8] vs. 1.5 [1.4–1.7] m2; P=0.016) than the group with preserved LVEF. In terms of the echocardiographic data, the group with reduced LVEF recorded significantly larger LVEDD and LVESD, lower LVEF, and larger LVM than the group with preserved LVEF (LVEDD: 54 [51–63] vs. 46 [41–51] mm; P<0.001; LVESD: 43 [38–52] vs. 30 [27-34] mm; P<0.001; LVEF: 40% [34–43%] vs. 63% [59–67%]; P<0.001; LVM: 208 [189–246] vs. 158 [132–199] g; P=0.001, respectively).

Table 1.
Participant Characteristics
| Characteristic |
Patients (n=61) |
Healthy volunteers
(n=10) |
Reduced LVEF
(n=21) |
Preserved LVEF
(n=40) |
P value |
| Age (years), median (Q1, Q3) |
73 (62, 76) |
72 (54, 79) |
0.994 |
43 (39, 57) |
| Female sex, n (%) |
5 (24) |
27 (68) |
0.003 |
3 (30) |
| Body surface area (m2), median (Q1, Q3) |
1.7 (1.5, 1.8) |
1.5 (1.4, 1.7) |
0.016 |
1.6 (1.5, 1.9) |
| Body mass index (kg/m2), median (Q1, Q3) |
24 (20, 27) |
23 (20, 24) |
0.160 |
23 (20, 25) |
| Underlying disease, n (%) |
|
|
<0.001 |
|
| Ischemic heart disease |
3 (14) |
1 (3) |
|
|
| Valvular disease |
4 (19) |
17 (43) |
|
|
| Myocardial disease |
6 (29) |
5 (13) |
|
|
| Arrhythmia |
7 (33) |
1 (3) |
|
|
| Pulmonary embolism |
1 (5) |
6 (15) |
|
|
| Pulmonary hypertension |
0 (0) |
6 (15) |
|
|
| Congenital heart disease |
0 (0) |
2 (5) |
|
|
| Aortic aneurysm |
0 (0) |
1 (3) |
|
|
| Unexplained dyspnea on exertion |
0 (0) |
1 (3) |
|
|
| Transthoracic echocardiography |
| LVEDD (mm), median (Q1, Q3) |
54 (51, 63) |
46 (41, 51) |
<0.001 |
44 (41, 46) |
| LVESD (mm), median (Q1, Q3) |
43 (38, 52) |
30 (27, 34) |
<0.001 |
28 (28, 31) |
| LVEF (%), median (Q1, Q3) |
40 (34, 43) |
63 (59, 67) |
<0.001 |
59 (58, 61) |
| Left ventricular mass (g), median (Q1, Q3) |
208 (189, 246) |
158 (132, 199) |
0.001 |
104 (91, 129) |
| Regional wall motion abnormality, n (%) |
2 (10) |
2 (5) |
0.602 |
0 (0) |
LVEDD, left ventricular end-diastolic diameter; LVEF, left ventricular ejection fraction; LVESD, left ventricular end-systolic diameter; Q1, 1st quartile; Q3, 3rd quartile.
Comparison of Indicators Between Patients With Reduced or Preserved LVEF by DCR
Table 2 shows the CTR of DCR, %∆transverse diameter, maximum and minimum pixel values, and the %∆pixel values in the 4 ROIs of the heart. There was no significant difference in CTR or %∆transverse diameter between patients with reduced LVEF and those with preserved LVEF. The maximum and minimum pixel values and the %∆pixel values were significantly lower in patients with reduced LVEF than in those with preserved LVEF in all ROIs. The effect size of the %∆pixel value was greatest among the CTR, %∆transverse diameter and other indicators in all ROIs, suggesting that the %∆pixel value could clearly distinguish participants with reduced LVEF from those with preserved LVEF. Furthermore, the effect sizes of the %∆pixel value in the 10-mm medial, 5-mm medial, and touching-the-edge ROIs (0.502–0.533) were larger than that of the 5-mm lateral ROI (0.380).
Table 2.
Comparison of Patients With Reduced or Preserved LVEF on DCR
| Indicator |
Patients (n=61) |
Healthy volunteers
(n=10) |
Reduced LVEF
(n=21) |
Preserved LVEF
(n=40) |
P value |
Effect size |
| Cardiothoracic ratio, median (Q1, Q3) |
56 (52, 63) |
54 (49, 57) |
0.091 |
0.217 |
45 (44, 47) |
| %Δtransverse diameter |
1.7 (1.1, 2.8) |
2.4 (1.7, 3.7) |
0.057 |
0.244 |
4.8 (3.9, 5.8) |
| 10-mm medial ROI |
| Maximum pixel value, median (Q1, Q3) |
3,574 (2,248, 3,827) |
4,296 (3,514, 5,826) |
0.017 |
0.306 |
4,639 (3,975, 5,298) |
| Minimum pixel value, median (Q1, Q3) |
3,386 (2,181, 3,639) |
3,735 (3,189, 5,134) |
0.029 |
0.279 |
4,171 (3,473, 4,539) |
| %Δpixel value, median (Q1, Q3) |
5.3 (4.5, 7.4) |
9.8 (7.2, 12.7) |
<0.001 |
0.502 |
12.9 (11.0, 15.6) |
| 5-mm medial ROI |
| Maximum pixel value, median (Q1, Q3) |
3,969 (2,538, 4,311) |
4,905 (4,060, 6,433) |
0.010 |
0.331 |
5,445 (4,698, 6,327) |
| Minimum pixel value, median (Q1, Q3) |
3,698 (2,400, 4,010) |
4,176 (3,720, 5,747) |
0.025 |
0.287 |
4,757 (3,988, 5,208) |
| %Δpixel value, median (Q1, Q3) |
6.4 (5.3, 8.1) |
11.1 (8.9, 15.6) |
<0.001 |
0.518 |
16.5 (15.1, 20.5) |
| Touching-the-edge ROI |
| Maximum pixel value, median (Q1, Q3) |
4,671 (2,860, 5,313) |
6,011 (4,982, 7,642) |
0.006 |
0.349 |
6,595 (5,962, 8,220) |
| Minimum pixel value, median (Q1, Q3) |
4,325 (2,686, 4,783) |
4,917 (4,450, 6,583) |
0.023 |
0.291 |
5,545 (4,714, 6,401) |
| %Δpixel value, median (Q1, Q3) |
8.1 (7.1, 10.0) |
14.2 (10.2, 20.2) |
<0.001 |
0.533 |
20.8 (18.1, 25.9) |
| 5-mm lateral ROI |
| Maximum pixel value, median (Q1, Q3) |
6,571 (3,822, 7,456) |
8,433 (6,182, 11,767) |
0.015 |
0.312 |
9,212 (7,581, 11,980) |
| Minimum pixel value, median (Q1, Q3) |
6,169 (3,588, 6,907) |
7,526 (5,674, 10,950) |
0.025 |
0.287 |
8,223 (7,062, 10,210) |
| %Δpixel value, median (Q1, Q3) |
6.8 (4.6, 8.0) |
8.7 (7.2, 11.7) |
0.003 |
0.380 |
11.4 (10.7, 12.6) |
DCR, dynamic chest radiography; ROI, region of interest. Other abbreviations as in Table 1.
Relationship Between the %∆pixel Values and LVEF
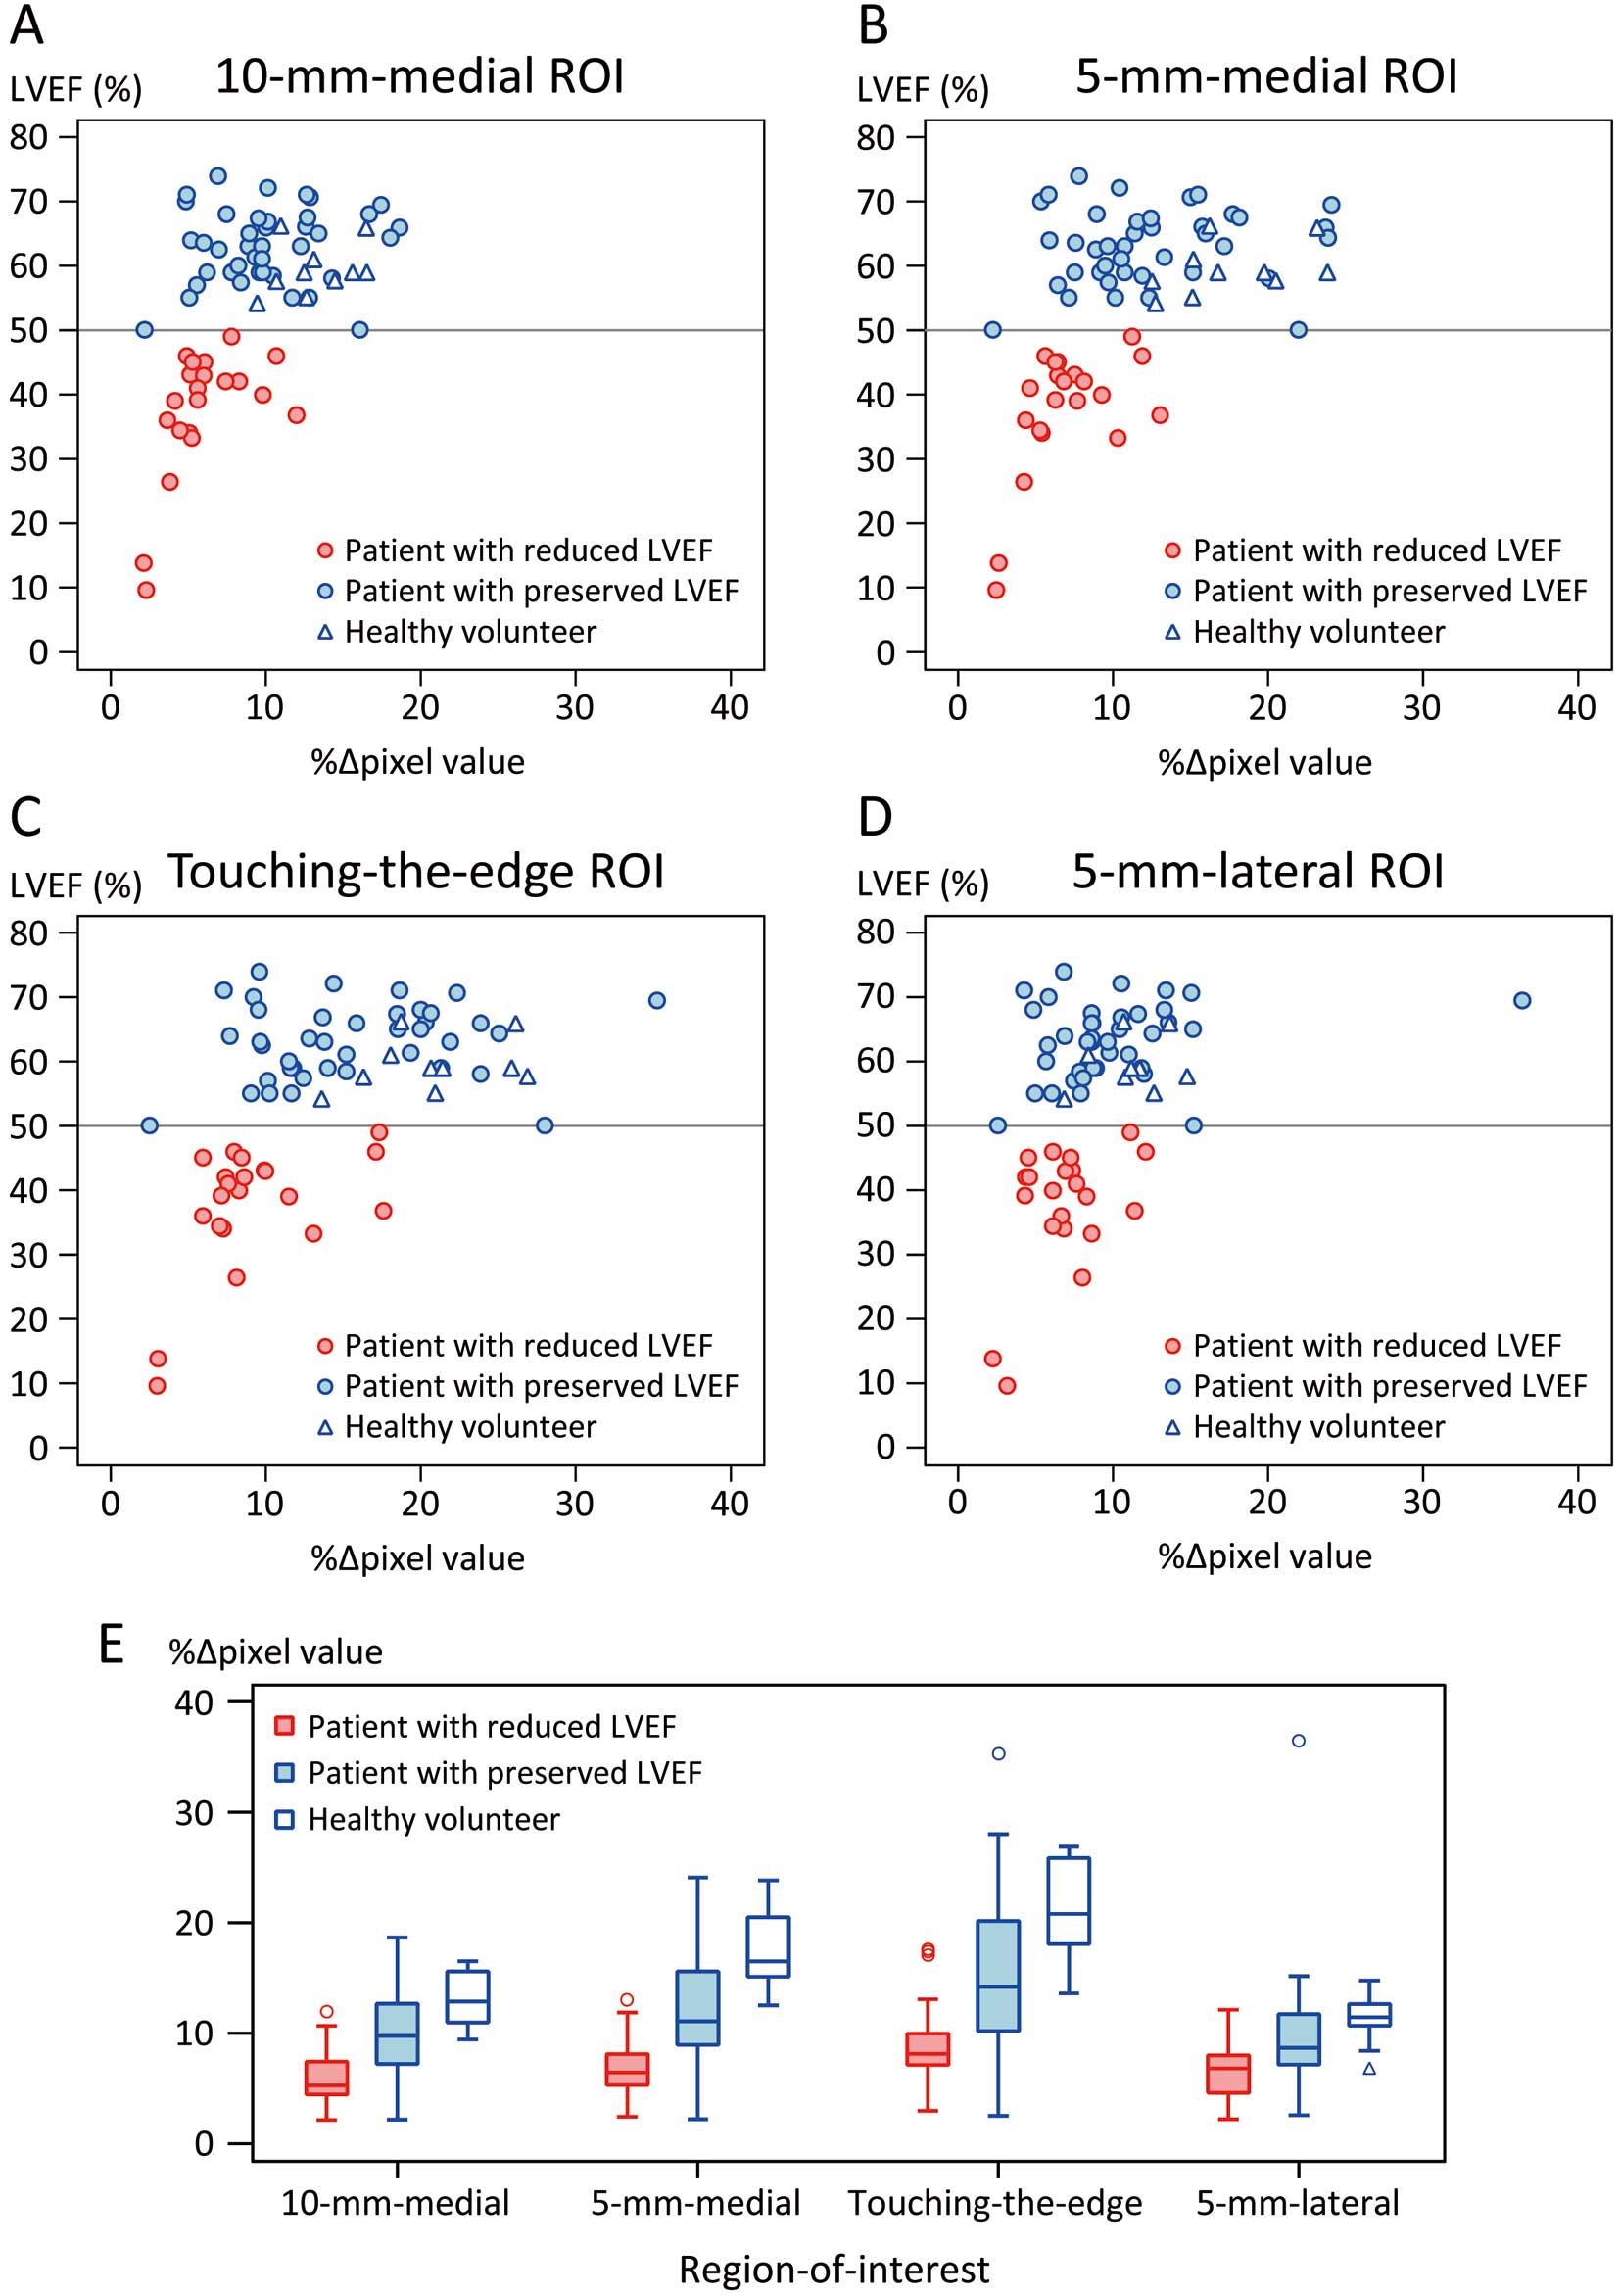
Figure 3 shows scatter plots of the %∆pixel values and LVEF in each ROI and box plots of %∆pixel values by participant group (patients with reduced LVEF, patients with preserved LVEF, and healthy volunteers). Spearman’s rank correlation coefficients between %∆pixel values and LVEF (calculated using only patient data) were significant in all ROIs (ρ=0.514, P<0.001 in the 10-mm medial ROI; ρ=0.525, P<0.001 in the 5-mm medial ROI; ρ=0.534, P<0.001 in the touching-the-edge ROI; ρ=0.426, P<0.001 in the 5-mm lateral ROI). The box plots show that the %∆pixel values of patients with preserved LVEF had greater variability than those of the patients with reduced LVEF and the healthy volunteers.
Discriminative Ability of the %∆pixel Values for Reduced LVEF
Figure 4 shows the ROC curves of the %∆pixel values at the 4 ROIs for discriminating patients with reduced LVEF, and Table 3 shows the AUC values. The AUC values of the 10-mm medial, 5-mm medial, and touching-the-edge ROIs were satisfactory, whereas the AUC value of the 5-mm lateral ROI was lower (AUC values: 0.808, 0.818, 0.827, and 0.733, respectively). The AUC value of the %∆transverse diameter was even lower (0.650).
Table 3.
AUC Values of %Δpixel Values in 4 ROIs and %Δtransverse Diameter for Discriminating Reduced LVEF in Patients
| Indicator |
AUC value |
95% CI |
| %Δpixel value |
| 10-mm medial ROI |
0.808 |
0.695, 0.922 |
| 5-mm medial ROI |
0.818 |
0.709, 0.927 |
| Touching-the-edge ROI |
0.827 |
0.717, 0.938 |
| 5-mm lateral ROI |
0.733 |
0.601, 0.866 |
| %Δtransverse diameter |
0.650 |
0.507, 0.793 |
AUC, area under the curve; CI, confidence interval; %Δpixel values, percent change in pixel value. Other abbreviations as in Tables 1,2.
Table 4 shows the cutoff %∆pixel values that attained 95% specificity or 95% sensitivity at each ROI. Among the cutoff values that attained 95% specificity, the value at the touching-the-edge ROI showed the highest sensitivity (43%). Among the cutoff values that attained 95% sensitivity, the 5-mm medial ROI showed the highest specificity (45%). When the cutoff values that attained 95% specificity were applied to healthy volunteers, there were no false classifications. When the cutoff values that attained 95% sensitivity were applied to healthy volunteers, there were no false classifications in the 5-mm medial ROI, 2 false classifications in each of the 10-mm medial and touching-the-edge ROIs, and 5 false classifications in the 5-mm lateral ROI.
Table 4.
Cutoff %Δpixel Values in 4 ROIs for Discriminating Reduced LVEF
| Cutoff type / ROI |
Cutoff
%Δpixel
value (%) |
Patients |
Healthy
volunteers |
Sensitivity
(%) |
Specificity
(%) |
Positive
predictive
value (%) |
Negative
predictive
value (%) |
No. incorrectly
classified, n (%) |
| Attaining 95% specificity |
| 10-mm medial |
4.8 |
29 |
98 |
86 |
72 |
0 (0) |
| 5-mm medial |
5.8 |
38 |
95 |
80 |
75 |
0 (0) |
| Touching-the-edge |
7.7 |
43 |
95 |
82 |
76 |
0 (0) |
| 5-mm lateral |
4.8 |
29 |
95 |
75 |
72 |
0 (0) |
| Attaining 95% sensitivity |
| 10-mm medial |
10.7 |
95 |
35 |
43 |
93 |
2 (20) |
| 5-mm medial |
11.9 |
95 |
45 |
48 |
95 |
0 (0) |
| Touching-the-edge |
17.4 |
95 |
40 |
45 |
94 |
2 (20) |
| 5-mm lateral |
11.4 |
95 |
28 |
41 |
92 |
5 (50) |
Abbreviations as in Tables 1–3.
Comparison Between Patients With Low and High %∆pixel Values Among Patients With Preserved LVEF
The variation in the %∆pixel values of patients with preserved LVEF was large (Figure 3E) and Spearman’s rank correlation between the %∆pixel values and LVEF in patients with preserved LVEF was not statistically significant (Supplementary Table 1). Therefore, we performed an additional comparison of patients with low and high %∆pixel values among the patients with preserved LVEF. We divided them into 2 groups of patients with preserved LVEF using a %∆pixel value of 17.4 (the cutoff attaining 95% sensitivity) in the touching-the-edge ROI, which had the highest AUC value. The additional analysis showed that patients with preserved LVEF but low %∆pixel values had a significantly larger body mass index than those with preserved LVEF and high %∆pixel values (23 [21–24] vs. 20 [18–23] kg/m2, P=0.042) (Supplementary Table 2).
Discussion
The results of this study can be summarized as follows. First, patients with reduced LVEF showed significantly lower %∆pixel values than patients with preserved LVEF in all 4 ROIs of the heart, and the effect size of the %∆pixel values was largest among those of CTR and other indicators that were measured by DCR. Second, the correlation between LVEF and the %∆pixel value on DCR of the heart was significant. Third, the %∆pixel values of the 10-mm medial, 5-mm medial, and touching-the-edge ROIs demonstrated satisfactory discriminative ability for LV dysfunction, and minor differences in the position of the ROI did not largely affect the results.
Up to now, research on DCR has mainly been performed in the respiratory field, but in the cardiovascular field, several reports have shown that DCR can be used to evaluate pulmonary circulation.12,13,15–17 In this study, we demonstrated that cardiac function can also be evaluated DCR by measuring the %∆pixel values at the left edge of the heart.
Comparison of DCR With Conventional Chest Radiography
Conventional chest radiography is the most commonly used examination in the cardiovascular field because of its very short examination time and low radiation exposure. Conventional chest radiography is performed to evaluate pulmonary congestion and cardiac enlargement from the pulmonary vessels and cardiac shadow. However, conventional chest radiography cannot be used to directly assess cardiac function, and is not a reliable indicator of the degree of LV dysfunction.22 In the present study, CTR was not useful for distinguishing between patients with reduced and preserved LVEF, whereas the pixel value obtained with DCR could more accurately distinguish between patients with reduced and preserved LVEF. That result suggests important information on LV contractility can be obtained over the additional 10–15 s required for DCR compared with only conventional chest radiography.
Factors Affecting the Change in Pixel Value of the Heart
We previously reported that changes in pixel values of the lung field on DCR reflect the motion of pulmonary vessels due to the increase in blood flow with cardiac pumping,16 which suggested that the magnitude of change in structure within a designated ROI affects the change in pixel value. On the basis of this finding, we considered that changes in the pixel value obtained by placing a ROI at the heart might reflect cardiac function. It was challenging to decide on the location of the ROI because clinical studies investigating cardiac function using DCR are lacking, and the factors affecting changes in pixel value remain unclear. Hence, we compared multiple ROIs around the left edge of the cardiac shadow. On DCR, the left edge of the cardiac shadow moves inward in systole with LV contraction (Supplementary Movie 1). The inward movement of the left edge of the cardiac shadow tends to be less pronounced in patients with reduced LVEF than in patients with preserved LVEF (Supplementary Movie 2). Therefore, before performing this study we decided that the inward movement was the most influential factor for changes in pixel value. In fact, we found that the %∆pixel values had comparable discriminative ability for LVEF in the 3 ROIs in which the entire circular area was within the cardiac shadow, while that in the 5-mm lateral ROI was inferior. Additionally, the discriminative ability of the %∆transverse diameter, which expresses the degree of inward movement of the left edge of the cardiac shadow, was even more inferior. These results indicated that the 3D movement of the ventricle may influence the change in pixel values because 2D inward movement did not involve the 10-mm and 5-mm medial ROIs. Therefore, the position of the ROI within the heart throughout the entire cardiac cycle may have been appropriate. However, we could not demonstrate the superiority of the ROI within the heart throughout the entire cardiac cycle, because the AUCs of the 10-mm medial, 5-mm medial, and touching-the-edge ROIs were comparable. Changes in pixel value with cardiac motion in ROIs may also depend on the direction of the heart. The left ventricle contracts longitudinally and circumferentially, and a previous study suggested that circumferential movement contributes to LVEF more than longitudinal movement.23 On the other hand, it is unclear which types of cardiac movement influence changes in pixel value. Hiraiwa et al24 reported that the %∆pixel value of the heart could be used to identify low cardiac output by right heart catheterization. They found a relationship between the %∆pixel value and hemodynamics,24 whereas we found a relationship between %∆pixel value and LV contractility. Cardiac output tends to be low when LV contractility is reduced. Thus, the findings of the study by Hiraiwa et al and our research are consistent without contraindications. However, whether the changes in pixel value on DCR are influenced by alterations in blood flow or by structural changes remains unclear. Thus, further research is needed to elucidate the factors that influence the change in pixel value.
Variability of the %∆pixel Values in Patients With Preserved LVEF
The %∆pixel value of patients with preserved LVEF showed greater variability than in patients with reduced LVEF. Therefore, we performed an additional analysis comparing patients with low and high %∆pixel values among the patients with preserved LVEF. The additional analysis showed that patients with preserved LVEF but low %∆pixel values had a significantly larger body mass index than those with preserved LVEF and high %∆pixel values. We had assumed that the %∆pixel value is less affected by body size than the raw pixel values, but the result may indicate that body size affects the %∆pixel value. Furthermore, the group of patients with preserved LVEF but low %∆pixel values seemed to include a large number of patients with diseases causing LV hypertrophy, although there was no significant difference in LVM between the 2 groups. Based on these results, we believe that DCR has the potential to detect myocardial dysfunction. However, further studies are needed to investigate this possibility.
Future Prospects of DCR
The major advantage of DCR is that it can conveniently and quickly assess the magnitude of structural changes using pixel values. When measuring the %∆pixel values by DCR, placing a ROI and detecting the maximum and minimum pixel values from the waveform are currently performed manually, but if this process can be automated, it will make it easier to acquire measurements of LV contractility.
We consider that DCR will be a highly valuable tool for use at general medical checkups. Quick and easy examinations are required when there are large numbers of people requiring a checkup. Both ECG and conventional chest radiography are suitable for medical checkups, but limited for assessment of cardiac function.22,25 Echocardiography is the most commonly used examination used to assess cardiac function, but requires a long examination time and well-trained operators. For this reason, echocardiography is rarely performed at general medical checkups. However, within only 10–15s, using almost the same technique as conventional chest radiography, DCR can detect patients with LV dysfunction with acceptable accuracy. Additional radiation exposure solely for the detection of LV dysfunction may not be appropriate, but studies have shown other uses for DCR.7–9,11,12,20 Therefore, we are hopeful that DCR will become a valuable additional radiation imaging technique that can be performed at medical checkups, especially for middle age and older patients with a high incidence of cardiac disease. However, because the amount of radiation per frame during DCR is reduced to prioritize the observation of motion while keeping the radiation dose low compared with conventional chest X-ray, the image quality may be slightly worse than that of conventional chest X-ray. Further research is needed to compare image quality and diagnostic utility between DCR and conventional chest X-ray.
Study Limitations
There are several limitations to note. First, this study was conducted at a single center and the sample size was small. Second, we did not consecutively enroll patients with cardiovascular diseases, so there may have been a selection bias. The population of subjects at medical checkups is very different from the population of patients included in this study. Thus, further studies on more subjects are warranted to verify the usefulness of DCR. Third, the characteristics were not similar between patients with reduced LVEF and preserved LVEF. Specifically, there were significant differences in BSA and sex between groups, which may have affected the pixel value results. Fourth, DCR was conducted consistently, regardless of the patient’s body size. This decision was based on our postulation that the %∆pixel value was less influenced by chest wall thickness than the raw pixel values. In standard clinical practice, the tube voltage is adjusted upward for larger-bodied patients to ensure optimal image quality. However, this adjustment affects the %∆pixel value in accordance with the principles of X-ray attenuation. The primary focus of our study was the relationship between the %∆pixel value and LVEF. Therefore, we chose a uniform setting for all participants. Nonetheless, given that clinical protocols often adapt settings based on body size, further studies are needed to better comprehend these intricacies. In addition, future research is needed to standardize the scanning parameters based on body size when investigating the pixel value-based study. Fifth, the interval between DCR and echocardiography was long for some patients, which may have affected the results of this study. Despite this, all patients underwent DCR and echocardiography while in a stable clinical phase with minimal changes in symptoms and cardiac function. Sixth, DCR was performed only in the seated position, but body position during DCR affects the pixel values. Therefore, we should verify the relationship between the %∆pixel value and LVEF using pixel values obtained in different positions. We were unable to perform DCR in the supine position because of limited space. Seventh, we used the LVEF measured by echocardiography, but it would be preferable to use the LVEF measured by magnetic resonance imaging, because it can be accurately measured in all patients. However, it is ethically difficult to perform magnetic resonance imaging in all patients for the sole purpose of measuring the LVEF. By contrast, echocardiography was routinely performed for the patients with cardiovascular disease. Therefore, we used the LVEF measured by echocardiography.
Conclusions
In this study, DCR was able to detect LV dysfunction with satisfactory accuracy, which is supportive evidence for the usability of DCR as a new imaging system in the field of cardiovascular healthcare.
Acknowledgment
We thank Emily Woodhouse, PhD, from Edanz (https://jp.edanz.com/ac) for editing a draft of this manuscript.
Sources of Funding
This work was supported by Konica Minolta, Inc.
Disclosures
N.M. is an employee of Konica Minolta, which developed dynamic radiography. The remaining authors have no conflicts of interest to disclose.
IRB Information
Shiga University of Medical Science Research Ethics Committee, reference number: 2019-150
Data Availability
The deidentified participant data will not be shared.
Supplementary Files
Supplementary Movie 1. DCR image in a patient with preserved LVEF (LVEF: 59%). DCR, dynamic chest radiography; LVEF, left ventricular ejection fraction.
Supplementary Movie 2. DCR image in a patient with reduced LVEF (LVEF: 39%). DCR, dynamic chest radiography; LVEF, left ventricular ejection fraction.
Please find supplementary file(s);
https://doi.org/10.1253/circj.CJ-23-0429
References
- 1.
Savarese G, Lund LH. Global public health burden of heart failure. Card Fail Rev 2017; 3: 7–11.
- 2.
Heidenreich PA, Bozkurt B, Aguilar D, Allen LA, Byun JJ, Colvin MM, et al. 2022 AHA/ACC/HFSA guideline for the management of heart failure: A report of the American College of Cardiology/American Heart Association Joint Committee on Clinical Practice Guidelines. Circulation 2022; 145: e895–e1032.
- 3.
Priori SG, Blomström-Lundqvist C, Mazzanti A, Blom N, Borggrefe M, Camm J, et al. 2015 ESC guidelines for the management of patients with ventricular arrhythmias and the prevention of sudden cardiac death: The Task Force for the Management of Patients with Ventricular Arrhythmias and the Prevention of Sudden Cardiac Death of the European Society of Cardiology (ESC). Endorsed by: Association for European Paediatric and Congenital Cardiology (AEPC). Eur Heart J 2015; 36: 2793–2867.
- 4.
Lang RM, Badano LP, Mor-Avi V, Afilalo J, Armstrong A, Ernande L, et al. Recommendations for cardiac chamber quantification by echocardiography in adults: An update from the American Society of Echocardiography and the European Association of Cardiovascular Imaging. Eur Heart J Cardiovasc Imaging 2015; 16: 233–270.
- 5.
Tanaka R, Sanada S, Kobayashi T, Suzuki M, Matsui T, Inoue H. Automated analysis for the respiratory kinetics with the screening dynamic chest radiography using a flat-panel detector system. Int Congr Ser 2003; 1256: 179–186.
- 6.
Tanaka R, Sanada S, Suzuki M, Kobayashi T, Matsui T, Inoue H, et al. Breathing chest radiography using a dynamic flat-panel detector combined with computer analysis. Med Phys 2004; 31: 2254–2262.
- 7.
Tanaka R, Sanada S, Sakuta K, Kawashima H. Quantitative analysis of rib kinematics based on dynamic chest bone images: Preliminary results. J Med Imaging (Bellingham) 2015; 2: 024002.
- 8.
Hida T, Yamada Y, Ueyama M, Araki T, Nishino M, Kurosaki A, et al. Time-resolved quantitative evaluation of diaphragmatic motion during forced breathing in a health screening cohort in a standing position: Dynamic chest phrenicography. Eur J Radiol 2019; 113: 59–65.
- 9.
Yamada Y, Ueyama M, Abe T, Araki T, Abe T, Nishino M, et al. Time-resolved quantitative analysis of the diaphragms during tidal breathing in a standing position using dynamic chest radiography with a flat panel detector system (“dynamic X-ray phrenicography”): Initial experience in 172 volunteers. Acad Radiol 2017; 24: 393–400.
- 10.
Tanaka R, Sanada S, Tsujioka K, Matsui T, Takata T, Matsui O. Development of a cardiac evaluation method using a dynamic flat-panel detector (FPD) system: A feasibility study using a cardiac motion phantom. Radiol Phys Technol 2008; 1: 27–32.
- 11.
Tanaka R, Sanada S, Okazaki N, Kobayashi T, Suzuki M, Matsui T, et al. Detectability of regional lung ventilation with flat-panel detector-based dynamic radiography. J Digit Imaging 2008; 21: 109–120.
- 12.
Tanaka R, Matsumoto I, Tamura M, Takata M, Yoshida S, Saito D, et al. Dynamic chest radiography: Clinical validation of ventilation and perfusion metrics derived from changes in radiographic lung density compared to nuclear medicine imaging. Quant Imaging Med Surg 2021; 11: 4016–4027.
- 13.
Tanaka R, Sanada S, Fujimura M, Yasui M, Tsuji S, Hayashi N, et al. Pulmonary blood flow evaluation using a dynamic flat-panel detector: Feasibility study with pulmonary diseases. Int J Comput Assist Radiol Surg 2009; 4: 449–455.
- 14.
Hanaoka J, Yoden M, Hayashi K, Shiratori T, Okamoto K, Kaku R, et al. Dynamic perfusion digital radiography for predicting pulmonary function after lung cancer resection. World J Surg Oncol 2021; 19: 43.
- 15.
Tanaka R. Dynamic chest radiography: Flat-panel detector (FPD) based functional X-ray imaging. Radiol Phys Technol 2016; 9: 139–153.
- 16.
Miyatake H, Tabata T, Tsujita Y, Fujino K, Tanaka R, Eguchi Y. Detection of pulmonary embolism using a novel dynamic flat-panel detector system in monkeys. Circ J 2021; 85: 361–368.
- 17.
Miyatake H, Asada K, Tabata T, Eguchi Y, Matsutani N, Nakagawa Y. Novel pulmonary circulation imaging using dynamic chest radiography for acute pulmonary embolism. Circ J 2021; 85: 400.
- 18.
Yamasaki Y, Abe K, Hosokawa K, Kamitani T. A novel pulmonary circulation imaging using dynamic digital radiography for chronic thromboembolic pulmonary hypertension. Eur Heart J 2020; 41: 2506.
- 19.
Yamasaki Y, Moriyama S, Tatsumoto R, Abe K, Ishigami K. Chronic thromboembolic pulmonary hypertension after acute pulmonary thromboembolism revealed by dynamic chest radiography. Eur Heart J Cardiovasc Imaging 2022; 23: e264–e265.
- 20.
Yamasaki Y, Abe K, Kamitani T, Hosokawa K, Hida T, Sagiyama K, et al. Efficacy of dynamic chest radiography for chronic thromboembolic pulmonary hypertension. Radiology 2023; 306: e220908.
- 21.
International Atomic Energy Agency. Nuclear medicine resources manual. Human Health Series No. 37 [serial online]. December 2020. https://www-pub.iaea.org/MTCD/Publications/PDF/P1861_web.pdf (accessed August 20, 2022).
- 22.
Clark AL, Coats AJ. Unreliability of cardiothoracic ratio as a marker of left ventricular impairment: Comparison with radionuclide ventriculography and echocardiography. Postgrad Med J 2000; 76: 289–291.
- 23.
Stokke TM, Hasselberg NE, Smedsrud MK, Sarvari SI, Haugaa KH, Smiseth OA, et al. Geometry as a confounder when assessing ventricular systolic function: Comparison between ejection fraction and strain. J Am Coll Cardiol 2017; 70: 942–954.
- 24.
Hiraiwa H, Sakamoto G, Ito R, Koyama Y, Kazama S, Kimura Y, et al. Dynamic chest radiography as a novel minimally invasive hemodynamic imaging method in patients with heart failure. Eur J Radiol 2023; 161: 110729.
- 25.
Panicker GK, Narula DD, Albert CM, Lee DC, Kothari S, Goldberger JJ, et al. Validation of electrocardiographic criteria for identifying left ventricular dysfunction in patients with previous myocardial infarction. Ann Noninvasive Electrocardiol 2021; 26: e12812.