Abstract
Background:
Uric acid (UA) serves as an antioxidant in vascular endothelial cells. UA transporter 1 (URAT1) encoded by SLC22A12 is expressed in the kidney and vessels and its loss of function causes hypouricemia. The purpose of this study was to examine whether there is any endothelial dysfunction in patients with hypouricemia.
Methods and Results:
Twenty-six patients with hypouricemia (<2.5 mg/dl) and 13 healthy control subjects were enrolled. Endothelial function was evaluated using flow-mediated dilation (FMD). mRNA of UA transporters expressed in cultured human umbilical endothelial cells (HUVEC) was detected on RT-PCR. There was a positive correlation between FMD and serum UA in the hypouricemia group. URAT1 loss-of-function mutations were found in the genome of 21 of 26 patients with hypouricemia, and not in the other 5. In the hypouricemia groups, serum UA in homozygous and compound heterozygous patients was significantly lower than in other groups, suggesting that severity of URAT1 dysfunction may influence the severity of hypouricemia. Thirteen of 16 hypouricemia subjects with homozygous and compound heterozygote mutations had SUA <0.8 mg/dl and their FMD was lower than in other groups. HUVEC do not express mRNA of URAT1, suggesting the null role of URAT1 in endothelial function.
Conclusions:
Depletion of UA due to SLC22A12/URAT1 loss-of-function mutations causes endothelial dysfunction in hypouricemia patients.
Uric acid (UA) is the end product of purine metabolism. Tissue deposition of UA crystals in the joints and kidney causes gout and chronic interstitial nephropathy, respectively. Several cohort studies identified a link between serum UA (SUA) and the incidence of cardiovascular (CV) disease, but it remains unclear whether UA is a casual, compensatory, or coincidental factor.1
There is a J-shaped relation of SUA to CV events,2,3
suggesting a protective action of UA on CV systems. Increased free radical activities in the bloodstream or arterial intima may cause endothelial dysfunction, which is thought to be an important step in the development of atherosclerosis.4,5
It has been reported that UA provides an antioxidant defense.6,7
Like ascorbic acid, UA treatment improved endothelial function in patients with type 1 diabetes and in smokers.1,8
High SUA may be neuroprotective in patients with acute stroke, resulting in better functional outcome.9
Thus, a decrease in SUA might be associated with endothelial dysfunction, although it has never been tested.
Editorial p ????
Renal hypouricemia is a heterogeneous genetic disorder characterized by impaired reabsorption of UA via loss-of-function mutations of SLC22A12/UA transporter 1 (SLC22A12/URAT1) or SLC9A2/GLUT9. It often causes exercise-induced acute renal failure via constriction of renal artery. It has been suggested that depletion of UA results in endothelial dysfunction via increasing reactive oxygen species,10,11
but it is not known whether renal hypouricemia causes vascular injury.
Flow-mediated dilation (FMD) is widely accepted as an index of endothelium-dependent vasodilatation12
and serves as an independent predictor of CV events.13,14
Thus, in this study, we evaluated endothelial function using FMD in patients with renal hypouricemia.
Method
Subjects
We examined 26 patients with hypouricemia, who had SUA concentration <2.5 mg/dl (149 μmol/L), and 13 healthy control subjects at Tottori University Hospital and St. Luke’s International Hospital in Japan, between 2005 and 2014. Blood sample was obtained in the early morning while subjects were fasting. The study was approved by the institutional review board on human investigation. Informed consent was obtained from all subjects. This was a case-control study (hypouricemia group and control group). There was no significant difference in age, sex or other biochemical indexes between the 2 groups.
Genotyping
Genomic DNA was isolated from peripheral blood cells. Polymorphism of SLC22A12 encoding URAT1 and SLC2A9A encoding GLUT9 was determined on sequencing analysis as reported previously.15,16
UA Metabolism
At 09:00 hours, while seated upright after rest, blood and urine tests were performed. Serum/urinary UA (SUA/UUA), serum/urinary creatinine (SCr and UCr), and fractional excretion of UA (FEUA) were investigated.
Brachial FMD and Nitroglycerine-Mediated Dilation (NMD)
Endothelial function was evaluated using FMD and NMD. FMD and NMD show endothelium-dependent and -independent arterial dilation, respectively.
In this study, we evaluated endothelial function using FMD in hypouricemia patients and control subjects to clarify whether a decrease in SUA was associated with endothelial dysfunction.
The FMD and NMD procedures have been described previously.17
All subjects fasted for 12 h before this test. The right brachial artery diameter was measured on B-mode ultrasound with 10-Mhz linear-array transducer (Vigmed System 5 ultrasound machine; Vigmed Ultrasound, Horten, Norway) at rest, during reactive hyperemia and after sublingual nitroglycerin. Subjects lay quietly for >30 min before the rest scan. Reactive hyperemia was induced by the inflation of a blood pressure cuff placed around the forearm to 220 mmHg for 5 min flowed by release. The artery was scanned continuously for 1 min before and 2 min after the deflation of the cuff, increasing a repeated recording of flow velocity for the first 10 s after the cuff was released. Thereafter, 15 min was allowed for the recovery of the vessel, after which an additional scan at rest was performed. Sublingual nitroglycerin spray 300 μg was then administered, and the vessel was scanned continuously for 5 min. FMD and NMD were calculated as the percentage increase in arterial diameter during hyperemia or after nitroglycerin, compared with the corresponding value at rest.
Cardio-Ankle Vascular Index (CAVI) and Carotid Ultrasonography
CAVI, independent of blood pressure, was measured using a VaSera VS-1500ATN (Fukuda Denshi, Tokyo, Japan) as described previously.18
CAVI was calculated according to the following formula: CAVI=a{(2ρ/∆P)×ln(Ps/Pd)PWV2
}+b, where ρ is blood density, Ps is systolic blood pressure, Pd is diastolic blood pressure, ∆P is pulse pressure (Ps-Pd), PWV is pulse wave velocity, and a and b are constants. Briefly, cuffs were attached around the bilateral upper arms and ankles of the subject in supine position. After resting for 10 min, electrocardiography, phonocardiography and pressures and waveforms of the brachial and ankle arteries were measured. PWV and CAVI were calculated automatically. The average of the right and left CAVIs was used for analysis.
Carotid ultrasonography was performed with a 7.5-MHz linear-type probe (Aplio MX, Toshiba, Tokyo, Japan). Intima-media thickness (IMT) was defined as the distance between the luminal-ntimal interface and medial-adventitial interface in the far wall of the common carotid artery along the plaque-free segment approximately 1.0 cm proximal to the carotid bulb. Six measurements of the far wall IMT were obtained manually, and IMT was calculated by averaging the bilateral mean IMT.
Human Umbilical Endothelial Cells (HUVEC) and UA Transporter mRNA
We used HUVEC for assay of mRNA expression of UA transporters. Cells were maintained in Dulbecco’s modified Eagle medium (Gibco BRL)/10% fetal bovine serum (Gibco BRL) at 37℃ in a 5% CO2
incubator. Total RNA was isolated from HUVEC using RNeasy Mini Kit (QIAGEN, Hilden, Germany). Reverse transcription-polymerase chain reaction was performed using ReverTra Ace-α-TM Kit according to the manufacturer’s instructions (TOYOBO, Osaka, Japan).
Table S1
lists the primer sets for individual UA transporters.
Statistical Analysis
All data are reported as mean±SD. To assess differences between 2 groups (control group and hypouricemia group), the data were analyzed using Student’s unpaired t-test. Statistical analysis were also carried out between multiple groups using analysis of variance (ANOVA) and Tukey’s test at a significance level of 5%. When the sample distribution was non-normal, non-parametric ANOVA was performed using Kruskal-Wallis test (α=0.05). Data were analyzed using SPSS for Windows (v21.0; SPSS, Chicago, IL, USA). Given that there was a low number of renal hypouricemia patients in Japan due to its low incidence,15
we used the analysis described here.
Results
Endothelial Function and UA Metabolism in Renal Hypouricemia
Clinical profiles of the control and hypouricemia subjects are summarized in
Table 1. Biochemical indexes for the renal and hepatic functions were within normal limits in both groups. There were no differences in age, systolic blood pressure, serum lipid profile, plasma glucose or the grade of arteriosclerosis (IMT, ankle-brachial index and CAVI) between the 2 groups. There was a difference in body mass index (BMI) between the 2 groups (hypouricemia, 20.7±3.0 kg/m2
vs. control, 23.6±1.9 kg/m2, P<0.05).
Table 1.
Clinical Characteristics
| Variables |
Control
(n=13) |
Hypouricemia
(n=26) |
| Age (years) |
44±16 |
49±13 |
| Male (%) |
53.8 |
34.6 |
| BMI (kg/m2) |
23.6±1.9 |
20.7±3.0* |
| SBP (mmHg) |
128.4±20.2 |
116.2±16.7 |
| Heart rate (beats/min) |
62±9 |
71±11 |
| Creatinine (mg/dl) |
0.66±0.13 |
0.65±0.18 |
| AST (U/dl) |
17.88±2.59 |
24.81±21.01 |
| ALT (U/dl) |
14.50±3.07 |
20.00±11.48 |
| Uric acid (mg/dl) |
4.82±1.36 |
1.14±0.67** |
| Triglyceride (mg/dl) |
116.63±31.01 |
71.32±47.67 |
| HDL-C (mg/dl) |
59.00±21.26 |
69.64±14.73 |
| LDL-C (mg/dl) |
125.50±35.06 |
113.20±21.16 |
| Plasma glucose (mg/dl) |
100.25±14.01 |
96.50±12.17 |
| IMT (cm) |
1.10±0.27 |
0.97±0.46 |
| ABI |
1.12±0.05 |
1.08±0.08 |
| CAVI |
8.67±0.58 |
7.27±1.21 |
Data given as mean±SD. *P<0.05 vs. control, **P<0.001 vs. control. ABI, ankle-brachial index; ALT, alanine aminotransferase; AST, aspartate aminotransferase; BMI, body mass index; CAVI, cardio-ankle vascular index; HDL-C, high-density lipoprotein cholesterol; IMT, intima-media thickness; LDL-C, low-density lipoprotein cholesterol; SBP, systolic blood pressure.
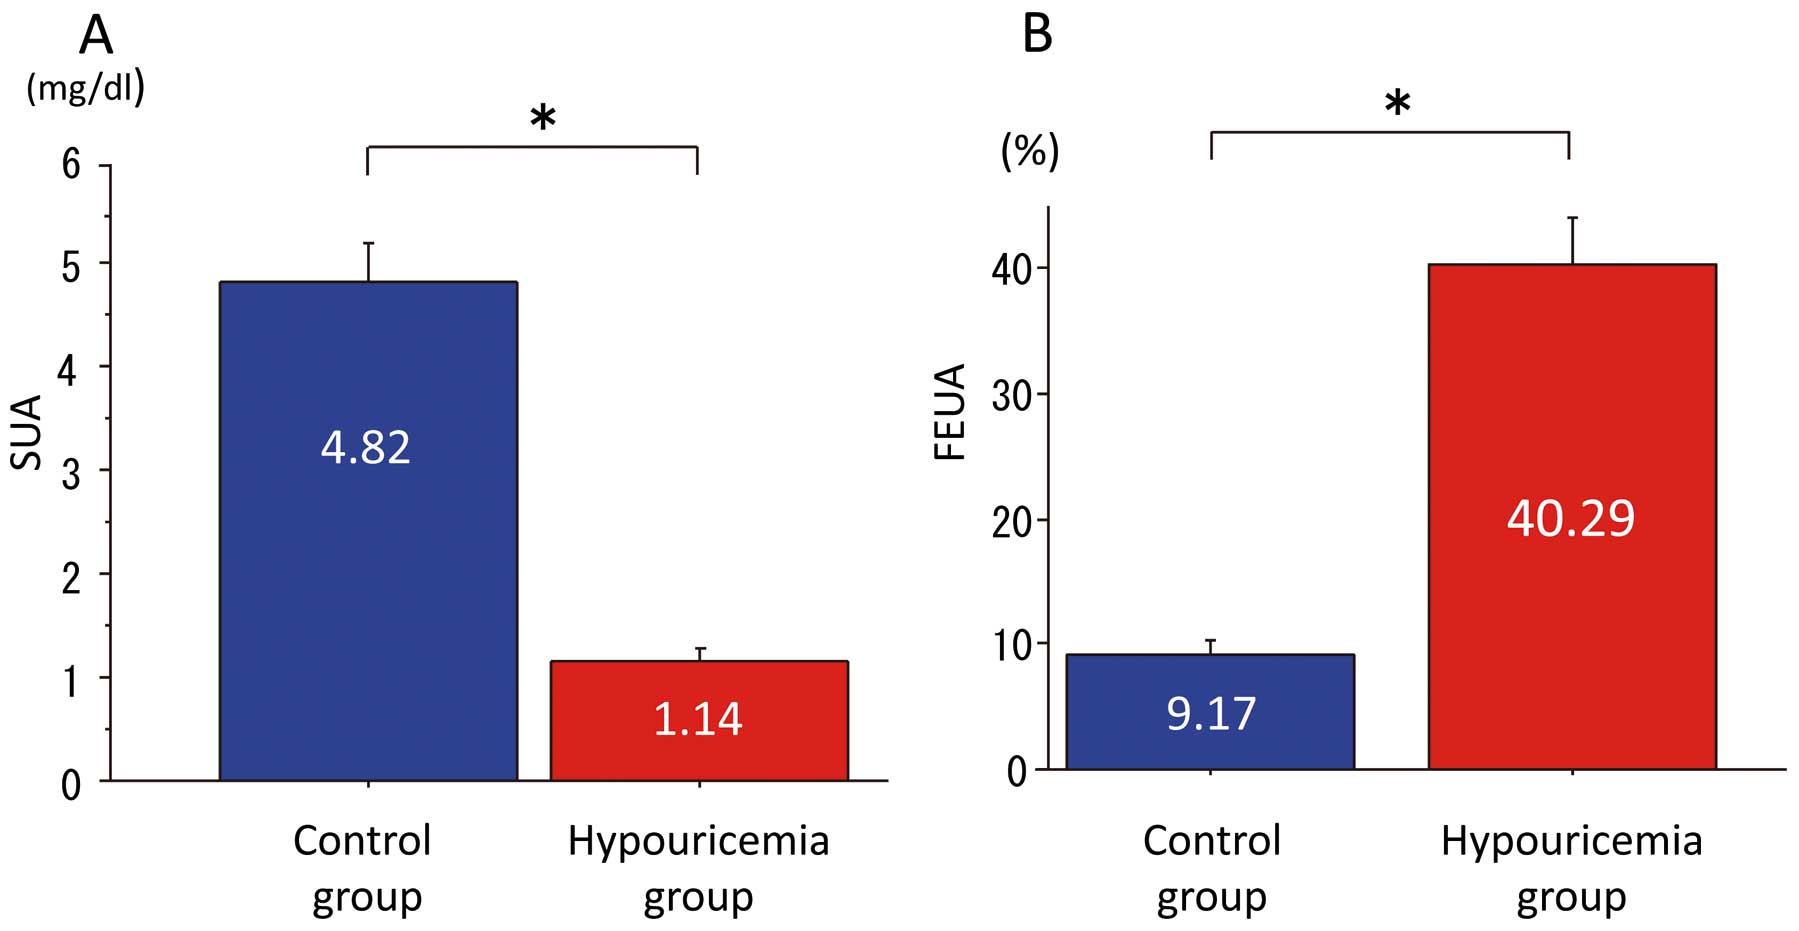
As shown in
Figure 1, the SUA of the hypouricemia groups was significantly lower (hypouricemia, 1.14±0.67 mg/dl vs. control, 4.82±1.36 mg/dl, P<0.001), and FEUA was significantly higher than in the control group (hypouricemia, 40.29±19.24% vs. control, 9.17±2.92%, P<0.001). As shown in
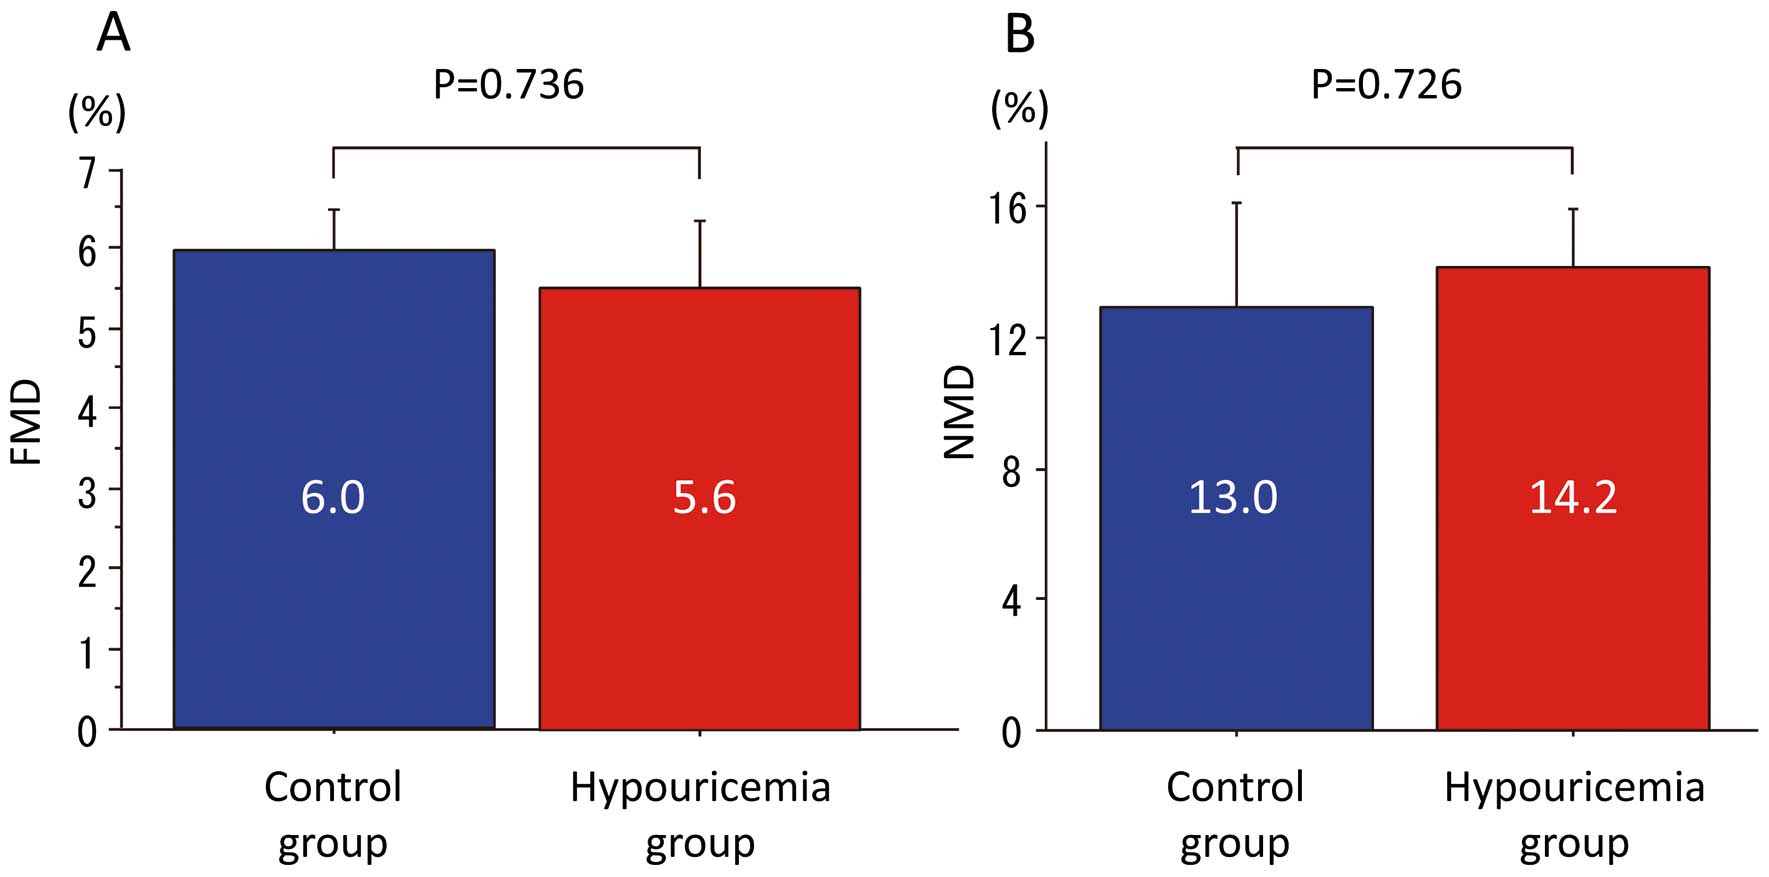
Figure 2, there were no significant differences in FMD and NMD between the hypouricemia and control groups (FMD: hypouricemia 5.6±4.3% vs. control 6.0±1.9%, P=0.736; NMD: hypouricemia 14.2±5.2% vs. control 13.0±8.3%, P=0.726).
Impaired Endothelial Function in Hypouricemia Due to SUA Depletion
In the total subject group (ie, hypouricemia plus the control group), there was no positive correlation between FMD and SUA (R=0.253, P=0.121; data not shown). In the hypouricemia patients, however, there was a positive correlation between SUA and FMD (R=0.409, P=0.038;
Figure 3A).
Neither CAVI (R=0.001, P=0.888) nor IMT (R=0.303, P=0.629) was correlated with SUA in hypouricemia patients.
We divided hypouricemia patients into 2 groups according to median SUA (0.8 mg/dl). FMD was significantly lower in the hypouricemia patients with SUA <0.8 mg/dl than in either the hypouricemia patients with SUA >0.8 mg/dl or the control group (Figure 3B), suggesting that very low SUA might impair endothelial function.
Given that there was a possibility of loss of SLC22A12/URAT1 function mutation, we examined the relationship between this mutation and FMD in hypouricemia patients.
Table 2
lists clinical data and SLC22A12 mutations of the patients with renal hypouricemia. SLC22A12/URAT1 loss-of-function mutations (G774A, G269A, C445T, G446A, G774A, C1137G, A1145T and T1253G) were found in the genome of 21 patients of the 26. Of the 21 patients, 6 were homozygous, 10 were compound heterozygous, and 5 were heterozygous. None of them harbored a mutation of SLC2A9A/GLUT9. None of the normouricemic subjects harbored a mutation of SLC22A12/URAT1. In the hypouricemia group, SUA and FEUA in homozygous and compound heterozygous patients were significantly lower and higher, respectively, than those in other genotypes. SUA and FEUA in heterozygous and mutation-free patients were significantly lower and higher, respectively, than those in the control group (SUA: homozygous, 0.70±0.20 mg/dl; compound heterozygous, 0.65±0.21 mg/dl; heterozygous, 2.00±0.42 mg/dl; mutation free, 1.80±0.42 mg/dl; FEUA: homozygous, 54.07±7.87%; compound heterozygous, 53.33±8.41%; heterozygous, 14.72±6.80%; mutation free, 23.24±11.80%;
Figures 4A,S1).
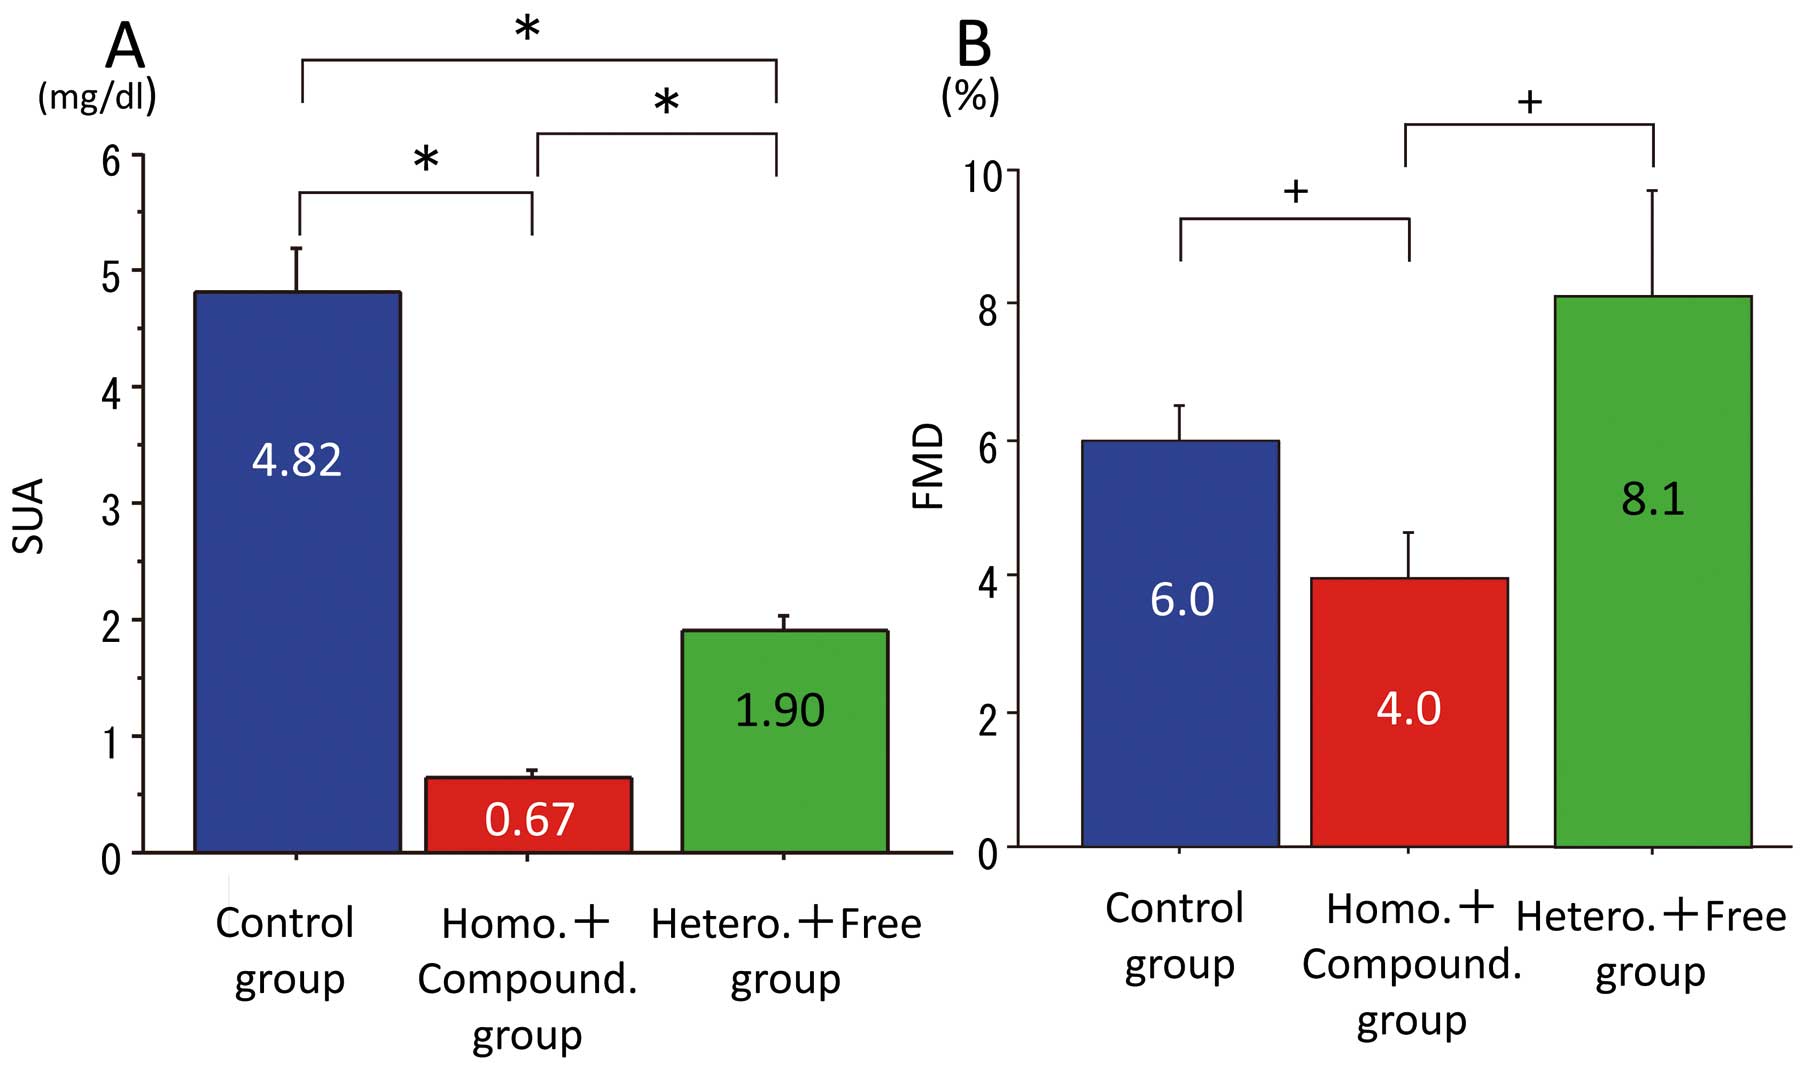
This suggested that the extent of impaired function of SLC22A12/URAT1 determined the severity of renal hypouricemia. Then, we examined the allele-dependent effects of SLC22A12/URAT1 mutations on endothelial function (Figure 4B). FMD was significantly lower in patients with homozygous mutations than in the control and mutation-free patients. FMD in compound heterozygous patients tended to be lower than in the heterozygous and mutation-free patients, although there was no difference in FMD between heterozygous and mutation-free patients (FMD: homozygous, 2.7±2.3%; compound heterozygous, 4.7±2.8%; heterozygous, 9.3±7.2%; mutation free, 7.0±2.3%). The similarity of FMD in the heterozygous and mutation-free patients with the control group, may be related to the median SUA (0.8 mg/dl) indicating impaired FMD in hypouricemia patients. SUA in heterozygote and mutation-free patients was similar at around 2 mg/dl (Figure 4A;
Table 2), and none of the patients in the heterozygote and mutation-free group had SUA <0.8 mg/dl, although SUA in homozygotes and compound heterozygotes was similar and was <1.0 mg/dl, and 13 of 16 patients among them had SUA <0.8 mg/dl. To confirm the impact of SUA on endothelial function in renal hypouricemia, we separated the renal hypouricemia patients into 3 groups based on SUA. First was a group of homozygote and compound heterozygote patients (n=16), for whom SUA was 0.67±0.18 mg/dl (<0.8 mg/dl); second was a group of heterozygote and mutation-free patients (n=10) for whom SUA was 1.90±0.41 mg/dl (>0.8 mg/dl); and third was the control group (n=13), for whom SUA was 4.82±1.36 mg/dl (Figure 5A). FMD was significantly lower in the group of homozygote and compound heterozygote patients (4.0±2.7%) among the 3 groups (Figure 5B). FMD was similar between the heterozygote and mutation-free patients (8.1±5.2%) and the control group (6.0±1.9%). This showed that either very low SUA or allele-dependent effect can impair FMD.

Table 2.
Clinical Data and SLC22A12 Mutations in Hypouricemia Patients
| ID no. |
Sex |
Age
(years) |
SLC22A12 mutation |
Type of genome
mutation |
SUA
(mg/dl) |
UUA
(mg/dl) |
SCr
(mg/dl) |
UCr
(mg/dl) |
FEUA
(%) |
| 1 |
M |
45 |
G774A Homo |
Homo. |
0.8 |
96.0 |
0.88 |
217.0 |
48.66 |
| 2 |
M |
34 |
G774A Homo |
Homo. |
0.7 |
71.6 |
0.80 |
122.0 |
67.70 |
| 3 |
M |
56 |
G774A Homo |
Homo. |
0.7 |
108.0 |
0.81 |
277.0 |
45.11 |
| 4 |
F |
52 |
G774A Homo |
Homo. |
0.6 |
31.0 |
0.52 |
52.0 |
51.67 |
| 5 |
F |
60 |
G774A Homo |
Homo. |
0.9 |
33.0 |
0.59 |
38.0 |
56.93 |
| 6 |
F |
51 |
G774A Homo |
Homo. |
0.5 |
39.0 |
0.62 |
89.0 |
54.34 |
| 7 |
M |
57 |
G774A/G269A |
Compound hetero. |
0.9 |
43.0 |
1.08 |
97.6 |
52.87 |
| 8 |
F |
32 |
G774A/G269A |
Compound hetero. |
0.3 |
30.0 |
0.57 |
90.0 |
63.33 |
| 9 |
M |
62 |
A626T/C1137G |
Compound hetero. |
0.8 |
36.6 |
0.82 |
76.9 |
48.78 |
| 10 |
F |
25 |
G77A/intro2G->A |
Compound hetero. |
0.4 |
59.3 |
0.43 |
107.0 |
59.58 |
| 11 |
F |
33 |
A1145T hetero/1639-1643Del Hetero |
Compound hetero. |
0.6 |
51.0 |
0.60 |
103.0 |
49.51 |
| 12 |
F |
66 |
G269A Hetero/G774A Hetero |
Compound hetero. |
0.9 |
29.0 |
0.59 |
42.0 |
45.26 |
| 13 |
M |
48 |
G269A Hetero/G774A Hetero |
Compound hetero |
0.8 |
60.0 |
0.55 |
70.0 |
37.50 |
| 14 |
M |
48 |
A1145T Hetero/G774A Hetero |
Compound hetero. |
0.7 |
82.0 |
0.67 |
135.0 |
58.14 |
| 15 |
F |
50 |
G774A Hetero/T1253G Hetero |
Compound hetero. |
0.5 |
23.0 |
0.49 |
35.0 |
64.40 |
| 16 |
M |
39 |
G774A Hetero/G269A Hetero |
Compound hetero. |
0.6 |
28.0 |
0.74 |
64.0 |
53.9 |
| 17 |
F |
46 |
G774A Hetero |
Hetero. |
2.2 |
100.0 |
0.53 |
244.0 |
9.87 |
| 18 |
F |
35 |
A1145T Hetero |
Hetero. |
2.3 |
38.0 |
0.46 |
58.0 |
13.10 |
| 19 |
F |
55 |
C1137G Hetero |
Hetero. |
2.3 |
26.2 |
0.51 |
42.4 |
13.70 |
| 20 |
F |
42 |
G269A Hetero |
Hetero. |
1.9 |
87.0 |
0.60 |
264.0 |
10.41 |
| 21 |
F |
57 |
G774A Hetero |
Hetero. |
1.3 |
26.0 |
0.57 |
43.0 |
26.51 |
| 22 |
M |
45 |
Mutation free |
Mutation free |
1.7 |
83.6 |
1.10 |
125.0 |
43.28 |
| 23 |
F |
41 |
Mutation free |
Mutation free |
1.6 |
61.9 |
0.45 |
134.6 |
12.93 |
| 24 |
F |
73 |
Mutation free |
Mutation free |
1.4 |
52.5 |
0.63 |
124.0 |
19.05 |
| 25 |
F |
34 |
Mutation free |
Mutation free |
1.8 |
49.9 |
0.58 |
68.9 |
23.34 |
| 26 |
F |
78 |
Mutation free |
Mutation free |
2.5 |
24.9 |
0.78 |
44.1 |
17.62 |
SLC22A12/URAT1 loss-of-function mutations were found in the genome of 21 patients with hypouricemia, but not in 5 patients (mutation free): 6 were homozygous, 10 were compound heterozygous, and 5 were heterozygous. FEUA, functional excretion of uric acid; SCr, serum creatinine; SUA, serum uric acid; UCr, urine creatinine; UUA, urine uric acid.
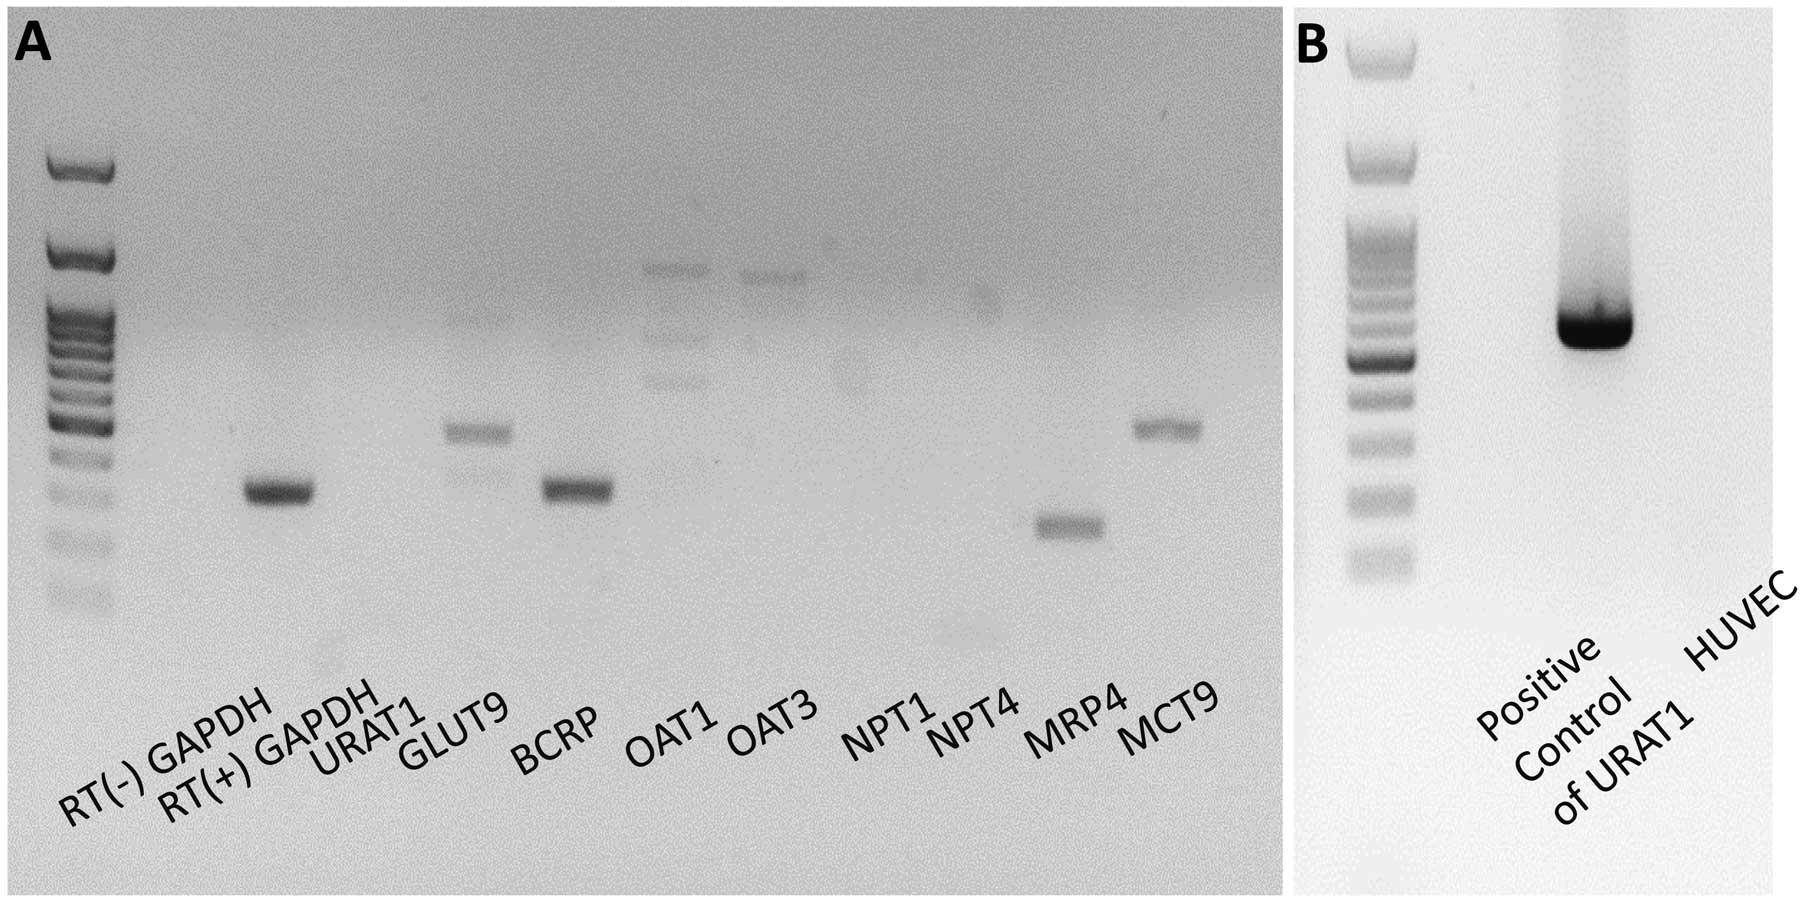
Recently, it was found that SLC22A12/URAT1 was expressed in vascular cells.17
This raises the possibility that SLC22A12/URAT1 mutations are directly associated with endothelial function in renal hypouricemia independent of SUA level. When we examined the mRNA level of UA transporters expressed in HUVEC, however, we found that HUVEC expressed mRNA of UA transporters including SLC9A2/GLUT9, ABCG2/BCRP, ABCC4/MRP4 and SLC16A9/MCT9, but not SLC22A12/URAT1 (Figure 6). Taken together, we conclude that depletion of UA plays a pivotal role in endothelial dysfunction in renal hypouricemia.
Discussion
Hyperuricemia has been shown to be associated with an increased incidence of CV disease,19–21
indicating the role of UA as a casual, compensatory, or coincidental factor. Conversely, the J-shaped relation between SUA and CV event rates suggested that lower SUA results in an increase in CV events.2,3
Waring et al showed that acute UA treatment, like that of vitamin C, improved endothelial function in patients with type 1 diabetes and in smokers,1
indicating an antioxidant action of UA. Experimental studies showed that low UA caused oxidative stress to endothelial cells as demonstrated by induction of oxidative apoptosis, expression of adhesion molecules and microvascular rarefaction.22,23
In vascular endothelium, UA reacts with peroxynitrite anion, which could induce tetrahydrobiopterin oxidation to decrease nitric oxide (NO) generation, suggesting that UA could prevent oxidative damage to endothelial function in part by restoring NO generation. Thus, low SUA might cause vascular endothelial dysfunction by increasing oxidative stress and decreasing NO generation.
Renal hypouricemia is a heterogeneous genetic disorder defined as low SUA due to excess urinary excretion of UA. Genome-wide association study indicated the presence of several transporters in the renal proximal tubule that operate tubular reabsorption/secretion of UA. UA is reabsorbed into the tubular cells via URAT1 encoded by SLC22A12.24
It is subsequently exported to blood by GLUT9 encoded by SLC2A9.25
Both mutations of SLC22A12 and SLC2A9 cause renal hypouricemia.15,16,26,27
Renal hypouricemia causes exercise-induced acute renal failure due to the spasm of renal artery. This spasm is believed to be due to endothelial dysfunction caused by free radicals,10,28
which could be partly ameliorated by treatment with xanthine oxidase inhibitors.29–31
We found that FMD was positively correlated with SUA in renal hypouricemia patients, and that those with SUA below the median (0.8 mg/dl) had decreased FMD, suggesting that very low SUA is associated with impaired endothelial function. Mean SUA and FMD were significantly lower in renal hypouricemia patients with homozygous SLC22A12/URAT1 mutations and tended to be lower in compound heterozygote renal hypouricemia patients than those in other genotypes, and FEUA was higher in these groups. This phenomenon was independent from the function of SLC9A2/GLUT9, because they carried no mutation of this gene. There are 2 possibilities to explain this association: (1) the very low level of SUA is related to impaired FMD; and (2) impaired function of SLC22A12/URAT1 is related to impaired FMD, given that several reports showed that SLC22A12/URAT1 is expressed not only in renal tubule cells but also in vascular smooth muscle cells32
and fatty cells.33
We found that HUVEC expressed mRNA of UA transporters such as SLC9A2/GLUT9, ABCG2/BCRP, ABCC4/MRP4 and SLC16A9/MCT9 but not that of SLC22A12/URAT1, suggesting the null role of SLC22A12/URAT1 expressed in endothelial cells on endothelial function in renal hypouricemia. Taken together, we conclude that the very low level of SUA plays a pivotal role in endothelial dysfunction in renal hypouricemia.
There was a possibility, however, that genotype could influence endothelial function in renal hypouricemia via the following mechanism: URAT1 mutation may influence the gene expression and function of other UA transporters such as URATv1, BCRP, MRP4 as well as MCT9 to impair endothelial function. Further studies are necessary to clarify the underlying mechanisms.
Study Limitations
A limitation of the present study was the small number of patients, which is due to the low incidence of renal hypouricemia.34–36
The mutations in the SLC22A12 gene encoding URAT1 have been described only in Japanese,15,37,38
Korean39
and Iraqi Jewish people.40
We studied endothelial function in the renal hypouricemia patients but did not observe their clinical outcome. Further studies are required to monitor the occurrence of CV events and mortality in hypouricemia patients. There was a difference in BMI between the hypouricemia and control groups. Given that elevation of BMI is associated with reduced FMD,41
lower BMI in the hypouricemia group did not influence their impaired FMD.
Although there was no significant difference in FMD between the hypouricemia and control groups, we found a significant correlation between SUA <2.5 mg/dl in the hypouricemia group and FMD. In the present study, hypouricemia was defined as SUA <2.5 mg/dl. We cannot deny the possibility that for a true definition of hypouricemia, the SUA cut-off may be much lower than 2.5 mg/dl. Future studies are needed to confirm the role of extremely low SUA in vascular function.
Conclusions
Depletion of UA due to SLC22A12/URAT1 loss-of-function mutations causes endothelial dysfunction in hypouricemia patients.
Supplementary Files
Supplementary File 1
Figure S1.
Comparison of mean fractional excretion of uric acid (FEUA) between the control group and SLC22A12/URAT1 loss-of-function mutation group in the hypouricemia group.
Table S1.
cDNA primer list for UA transporters
Please find supplementary file(s);
http://dx.doi.org/10.1253/circj.CJ-14-1267
References
- 1.
Waring WS, McKnight JA, Webb DJ, Maxwell SR. Uric acid restores endothelial function in patients with type 1 diabetes and regular smokers. Diabetes 2006; 55: 3127–3132.
- 2.
Verdecchia P, Schillaci G, Reboldi G, Santeusanio F, Porcellati C, Brunetti P. Relation between serum uric acid and risk of cardiovascular disease in essential hypertension: The PIUMA study. Hypertension 2000; 36: 1072–1078.
- 3.
De Leeuw PW, Thijs L, Birkenhäger WH, Voyaki SM, Efstratopoulos AD, Fagard RH, et al; Systolic Hypertension in Europe (Syst-Eur) Trial Investigators. Prognostic significance of renal function in elderly patients with isolated systolic hypertension: Results from the Syst-Eur trial. J Am Soc Nephrol 2002; 13: 2213–2222.
- 4.
Kuo L, Davis MJ, Cannon MS, Chilian WM. Pathophysiological consequences of atherosclerosis extend into the coronary microcirculation: Restoration of endothelium-dependent responses by L-arginine. Circ Res 1992; 70: 465–476.
- 5.
Poredos P. Endothelial dysfunction in the pathogenesis of atherosclerosis. Int Angiol 2002; 21: 109–116.
- 6.
Ames BN, Cathcart R, Schwiers E, Hochstein P. Uric acid provides an antioxidant defense in humans against oxidant- and radical-caused aging and cancer: A hypothesis. Proc Natl Acad Sci USA 1981; 78: 6858–6862.
- 7.
Sevanian A, Davies KJ, Hochstein P. Serum urate as an antioxidant for ascorbic acid. Am J Clin Nutr 1991; 54: 1129S–1134S.
- 8.
Nieto FJ, Iribarren C, Gross MD, Comstock GW, Cutler RG. Uric acid and serum antioxidant capacity: A reaction to atherosclerosis? Atherosclerosis 2000; 148: 131–139.
- 9.
Lee SH, Heo SH, Kim JH, Lee D, Lee JS, Kim YS, et al. Effects of uric acid levels on outcome in severe ischemic stroke patients treated with intravenous recombinant tissue plasminogen activator. Eur Neurol 2013; 71: 132–139.
- 10.
Sperling O. Hereditary renal hypouricemia. Mol Genet Metab 2006; 89: 14–18.
- 11.
Pitocco D, Di Stasio E, Romitelli F, Zaccardi F, Tavazzi B, Manto A, et al. Hypouricemia linked to an overproduction of nitric oxide is an early marker of oxidative stress in female subjects with type 1 diabetes. Diabetes Metab Res Rev 2008; 24: 318–323.
- 12.
Thijssen DH, Black MA, Pyke KE, Padilla J, Atkinson G, Harris RA, et al. Assessment of flow-mediated dilation in humans: A methodological and physiological guideline. Am J Physiol Heart Circ Physiol 2011; 300: H2–H12.
- 13.
Inaba Y, Chen JA, Bergmann SR. Prediction of future cardiovascular outcomes by flow-mediated vasodilatation of brachial artery: A meta-analysis. Int J Cardiovasc Imaging 2010; 26: 631–640.
- 14.
Poredos P, Jezovnik MK. Testing endothelial function and its clinical relevance. J Atheroscler Thromb 2013; 20: 1–8.
- 15.
Ichida K, Hosoyamada M, Hisatome I, Enomoto A, Hikita M, Endou H, et al. Clinical and molecular analysis of patients with renal hypouricemia in Japan-influence of URAT1 gene on urinary urate excretion. J Am Soc Nephrol 2004; 15: 164–173.
- 16.
Anzai N, Ichida K, Jutabha P, Kimura T, Babu E, Jin CJ, et al. Plasma urate level is directly regulated by a voltage-driven urate efflux transporter URATv1 (SLC2A9) in humans. J Biol Chem 2008; 283: 26834–26838.
- 17.
Kato M, Hisatome I, Tomikura Y, Kotani K, Kinugawa T, Ogino K, et al. Status of endothelial dependent vasodilation in patients with hyperuricemia. Am J Cardiol 2005; 96: 1576–1578.
- 18.
Shirai K, Utino S, Otsuka K, Takata M. A novel blood pressure-independent arterial wall stiffness parameter; cardio-ankle vascular index (CAVI). J Atheroscler Thromb 2006; 13: 101–107.
- 19.
Fang J, Alderman MH. Serum uric acid and cardiovascular mortality, The NHANES 1 epidemiology follow-up study, 1971–1992. JAMA 2000; 283: 2404–2410.
- 20.
Niizeki T, Takeishi Y, Arimoto T, Okuyama H, Nozaki N, Hirono O, et al. Hyperuricemia associated with high cardiac event rates in the elderly with chronic heart failure. J Cardiol 2006; 47: 219–228.
- 21.
Lin GM, Li YH, Zheng NC, Lai CP, Lin CL, Wang JH, et al. Serum uric acid as an independent predictor of mortality in high-risk patients with obstructive coronary artery disease: A prospective observational cohort study from the ET-CHD registry, 1997–2003. J Cardiol 2013; 61: 122–127.
- 22.
Madamanchi NR, Vendrov A, Runge MS. Oxidative stress and vascular disease. Arterioscler Thromb Vasc Biol 2005; 25: 29–38.
- 23.
George J, Struthers AD. Role of urate, xanthine oxidase and the effects of allopurinol in vascular oxidative stress. Vasc Health Risk Manag 2009; 5: 265–272.
- 24.
Enomoto A, Kimura H, Chairoungdua A, Shigeta Y, Jutabha P, Cha SH, et al. Molecular identification of a renal urate anion exchanger that regulates blood urate levels. Nature 2002; 417: 447–452.
- 25.
Li S, Sanna S, Maschio A, Busonero F, Usala G, Mulas A, et al. The GLUT9 gene is associated with serum uric acid levels in Sardinia and Chianti cohorts. PLoS Genet 2007; 3: e194, doi:10.1371/journal.pgen.0030194.
- 26.
Dinour D, Gray NK, Campbell S, Shu X, Sawyer L, Richardson W, et al. Homozygous SLC2A9 mutations cause severe renal hypouricemia. J Am Soc Nephrol 2010; 21: 64–72.
- 27.
Kamatani Y, Matsuda K, Okada Y, Kubo M, Hosono N, Daigo Y, et al. Genome-wide association study of hematological and biochemical traits in a Japanese population. Nat Genet 2010; 42: 210–215.
- 28.
Berry CE, Hare JM. Xanthine oxidoreductase and cardiovascular disease: Molecular mechanisms and pathophysiological implications. J Physiol 2004; 555: 589–606.
- 29.
George J, Carr E, Davies J, Belch JJ, Struthers A. High-dose allopurinol improves endothelial function by profoundly reducing vascular oxidative stress and not by lowering uric acid. Circulation 2006; 114: 2508–2516.
- 30.
Farquharson CA, Butler R, Hill A, Belch JJ, Struthers AD. Allopurinol improves endothelial dysfunction in chronic heart failure. Circulation 2002; 106: 221–226.
- 31.
Das DK, Engelman RM, Clement R, Otani H, Prasad MR, Rao PS. Role of xanthine oxidase inhibitor as free radical scavenger: A novel mechanism of action of allopurinol and oxypurinol in myocardial salvage. Biochem Biophys Res Commun 1987; 148: 314–319.
- 32.
Price KL, Sautin YY, Long DA, Zhang L, Miyazaki H, Mu W, et al. Human vascular smooth muscle cells express a urate transporter. J Am Soc Nephrol 2006; 17: 1791–1795.
- 33.
Sautin YY, Nakagawa T, Zharikov S, Johnson RJ. Adverse effects of the classic antioxidant uric acid in adipocytes: NADPH oxidase-mediated oxidative/nitrosative stress. Am J Physiol Cell Physiol 2007; 293: C584–C596.
- 34.
Van Peenen HJ. Causes of hypouricemia. Ann Intern Med 1973; 78: 977–978.
- 35.
Hisatome I, Ogino K, Kotake H, Ishiko R, Saito M, Hasegawa J, et al. Cause of persistent hypouricemia in outpatients. Nephron 1989; 51: 13–16.
- 36.
Yanase M, Nakahama H, Mikami H, Fukuhara Y, Orita Y, Yoshikawa H. Prevalence of hypouricemia in apparently normal population. Nephron 1988; 48: 80.
- 37.
Komoda F, Sekine T, Inatomi J, Enomoto A, Endou H, Ota T, et al. The W258X mutation in SLC22A12 is the predominant cause of Japanese renal hypouricemia. Pediatr Nephrol 2004; 19: 728–733.
- 38.
Ichida K, Hosoyamada M, Kamatani N, Kamitsuji S, Hisatome I, Shibasaki T, et al. Age and origin of the G774A mutation in SLC22A12 causing renal hypouricemia in Japanese. Clin Genet 2008; 74: 243–251.
- 39.
Cheong HI, Kang JH, Lee JH, Ha IS, Kim S, Komoda F, et al. Mutational analysis of idiopathic renal hypouricemia in Korea. Pediatr Nephrol 2005; 20: 886–890.
- 40.
Dinour D, Bahn A, Ganon L, Ron R, Geifman-Holtzman O, Knecht A, et al. URAT1 mutations cause renal hypouricemia type 1 in Iraqi Jews. Nephrol Dial Transplant 2011; 26: 2175–2181.
- 41.
Matsuzawa Y, Sugiyama S, Sugamura K, Sumida H, Kurokawa H, Fujisue K, et al. Successful diet and exercise therapy as evaluated on self-assessment score significantly improves endothelial function in metabolic syndrome patients. Circ J 2013; 77: 2807–2815.