Abstract
Background:
There is a paucity of data on the sex differences in the prevalence, clinical presentation, and prognosis of aortic stenosis (AS).
Methods and Results:
A total of 3,815 consecutive patients with severe AS were enrolled in the multicenter CURRENT AS registry between January 2003 and December 2011. The registry included 1,443 men (38%) and 2,372 women (62%). Women were much older than men (79±10 vs. 75±10 years, P<0.0001), and the ratio of women to men increased with age. The cumulative 5-year incidence of all-cause death was significantly higher in men than in women (47% vs. 41%, P=0.003), although women were more symptomatic and much older. The 5-year mortality was similar between men and women at age <65 years (16% vs. 15%, P=0.99), whereas it was significantly higher in men than in women at age ≥65 years (65–74 years, 38% vs. 19%, P<0.0001; 75–84 years, 55% vs. 34%, P<0.0001; ≥85 years: 82% vs. 72%, P=0.03).
Conclusions:
A large Japanese multicenter registry of consecutive patients with severe AS included a much higher proportion of women than men, with the female:male sex ratio increasing with age. The 5-year mortality rate of women was lower than that of men. Lower 5-year mortality rates in women were consistently seen across all age groups >65 years.
Aortic stenosis (AS) has become the most common valvular heart disease in the developed countries.1,2
The prevalence of rheumatic heart disease has declined, and the type of AS has shifted from rheumatic to non-rheumatic etilogy.3
The lesion, referred to as degeneration, is now predominantly found in older patients. AS progresses more rapidly in patients with degenerative calcification than in those with congenital or rheumatic disease;4
furthermore, older patients have a trend toward more rapid progression than younger patients.5
The progressive aging of the population in the developed countries will result in increasing number of patients presenting with clinically significant AS in the near future.6
Sex differences have received increasing attention in cardiology.7
Women live longer than men, and longer life expectancy might influence the natural history of late-onset disease, but there is a paucity of data on the sex differences in the prevalence, clinical presentation, and prognosis of AS. The present study analyzed data from a large Japanese multicenter registry of consecutive patients with severe AS, focusing on comparison of the prevalence, clinical presentation and outcomes of severe AS between the sexes.
Methods
Subjects
The study design and patient enrollment for the Contemporary outcomes after sURgery and medical tREatmeNT in patients with severe Aortic Stenosis (CURRENT AS) registry have previously been described in detail.8
In brief, the CURRENT AS is a retrospective, multicenter registry that enrolled consecutive patients with severe AS at 27 centers in Japan between January 2003 and December 2011. We enrolled 3,815 consecutive patients who met the definition of severe AS (peak aortic jet velocity [Vmax] >4.0 m/s, mean aortic pressure gradient [PG] >40 mmHg, or aortic valve area [AVA] <1.0 cm2) for the first time during the study period.9
AVA was calculated using the standard continuity equation. Initial aortic valve replacement (AVR) strategy was chosen in 1,197 patients after index echocardiography, while the remaining 2,618 patients were managed conservatively. The institutional review boards of all 27 participating centers approved the protocol. Written informed consent from each patient was waived for this retrospective study, because clinical information used in the study was obtained during routine clinical practice; no patient refused to participate when contacted for follow-up.
Definitions
Angina, syncope, or heart failure including dyspnea were regarded as symptoms related to AS. The primary outcome measure for the current analysis was all-cause death. Causes of death were classified according to the Valve Academic Research Consortium (VARC).10,11
Sudden death was defined as unexplained death in previously stable patients. Aortic valve-related death included aortic procedure-related death, sudden death, and death due to heart failure possibly related to the aortic valve. Heart failure hospitalization was defined as hospitalization due to worsening heart failure requiring i.v. drug therapy. Symptoms of AS were defined as chest pain, syncope or pre-syncope, and heart failure possibly related to the AS as judged by the attending physicians.
Statistical Analysis
Baseline clinical and echocardiographic characteristics, and 5-year clinical outcomes were compared between the sexes. A separate analysis was performed including only the initial AVR group to evaluate the sex-related differences in the outcomes of AVR.
Categorical variables are presented as numbers and percentages, and were compared using the chi-squared test or Fisher’s exact test. Continuous variables are presented as mean±SD or median (IQR). Based on their distributions, continuous variables were compared using Student’s t-test or Wilcoxon rank sum test. The Kaplan-Meier method was used to estimate the cumulative incidence, and differences were assessed using log-rank test. On multivariable adjusted analysis, we included the 21 clinically relevant factors listed in
Table 1
in the Cox proportional hazard models as the risk-adjusting variables, and the centers were incorporated as the stratification variable, consistent with a previous report.8
The continuous variables other than age were dichotomized by their medians or clinically meaningful reference values. Because the difference in age between men and women was too large to allow the dichotomous approach, age was treated as a continuous variable in the Cox proportional hazard models. The risks of male relative to female sex for the clinical endpoints were expressed as hazard ratios with 95% CI. All statistical analyses were conducted by physicians (M.T., T. Taniguchi) and a statistician (T. Morimoto) using either JMP 10.0.2 or 11.2.0 (SAS Institute, Cary, NC, USA) or SAS 9.4 (SAS Institute, Cary, NC, USA). Two-tailed P<0.05 was considered to be statistically significant.
Table 1.
Subject Characteristics vs. Sex
| |
Men
(n=1,443) |
Women
(n=2,372) |
P value |
| Clinical characteristics |
| Age (years)† |
75.2±9.5 |
79.3±9.6 |
<0.0001 |
| ≤64 |
189 (13.1) |
157 (6.6) |
<0.0001 |
| 65–74 |
427 (29.6) |
484 (20.4) |
<0.0001 |
| 75–84 |
608 (42.1) |
996 (42.0) |
0.94 |
| ≥85 |
219 (15.2) |
735 (31.0) |
<0.0001 |
| Symptoms of aortic stenosis |
713 (49.4) |
1,292 (54.5) |
0.002 |
| Chest pain |
204 (14.1) |
294 (12.4) |
0.12 |
| Syncope |
72 (5.0) |
126 (5.3) |
0.70 |
| HF |
547 (37.9) |
1,056 (44.5) |
<0.0001 |
| NYHA II |
306 (21.2) |
540 (22.8) |
0.28 |
| NYHA III |
129 (8.9) |
232 (9.8) |
0.42 |
| NYHA IV |
102 (7.1) |
271 (11.4) |
<0.0001 |
| NYHA NA |
10 (0.7) |
13 (0.6) |
0.67 |
| Admission for HF at index echocardiography† |
244 (16.9) |
546 (23.0) |
<0.0001 |
| Initial AVR strategy† |
507 (35.1) |
690 (29.1) |
0.0001 |
| ≤64 years |
91 (48.2) |
69 (44.0) |
0.45 |
| 65–74 years |
194 (45.4) |
214 (44.2) |
0.74 |
| 75–84 years |
191 (31.4) |
330 (33.1) |
0.51 |
| ≥85 years |
24 (11.0) |
58 (7.9) |
0.17 |
| BMI (kg/m2) |
22.2±3.7 |
21.5±3.9 |
<0.0001 |
| <22† |
790 (54.8) |
1,536 (64.8) |
<0.0001 |
| BSA (m2) |
1.60±0.15 |
1.37±0.15 |
<0.0001 |
| Hypertension† |
1010 (70.0) |
1,657 (69.9) |
0.93 |
| Current smoking† |
670 (46.4) |
160 (6.8) |
<0.0001 |
| Diabetes mellitus |
399 (27.7) |
498 (21.0) |
<0.0001 |
| Receiving insulin† |
85 (5.9) |
103 (4.3) |
0.03 |
| Prior MI† |
163 (11.3) |
160 (6.8) |
<0.0001 |
| Prior open heart surgery |
136 (9.4) |
180 (7.6) |
0.05 |
| Prior stroke† |
238 (16.5) |
265 (11.2) |
<0.0001 |
| Atrial fibrillation or flutter† |
306 (21.2) |
522 (22.0) |
0.56 |
| Aortic/peripheral vascular disease |
164 (11.4) |
118 (5.0) |
<0.0001 |
| Serum creatinine (mg/dL)† |
1.01 (0.83–1.68) |
0.80 (0.62–1.1) |
<0.0001 |
| Hemodialysis† |
242 (16.8) |
163 (6.9) |
<0.0001 |
| Hemoglobin (g/dL) |
12.2±2.2 |
11.1±1.9 |
<0.0001 |
| Anemia†,‡ |
770 (53.4) |
1,347 (56.8) |
0.04 |
| Liver cirrhosis (Child-Pugh B or C)† |
16 (1.1) |
22 (0.9) |
0.58 |
| Malignancy |
259 (18.0) |
258 (10.9) |
<0.0001 |
| Current treatment† |
79 (5.5) |
70 (3.0) |
0.0001 |
| Chest wall irradiation |
10 (0.7) |
15 (0.6) |
0.82 |
| Immunosuppressive therapy |
36 (2.5) |
95 (4.0) |
0.01 |
| Chronic lung disease |
217 (15.0) |
183 (7.7) |
<0.0001 |
| Moderate-severe† |
49 (3.4) |
63 (2.7) |
0.19 |
| Coronary artery disease† |
553 (38.3) |
591 (24.9) |
<0.0001 |
| Logistic Euroscore (%) |
7.5 (4.5–13.9) |
10.9 (7.0–18.3) |
<0.0001 |
| Euroscore II (%) |
2.2 (1.3–4.0) |
3.3 (2.0–5.4) |
<0.0001 |
| STS score (PROM) (%) |
3.2 (1.8–5.9) |
4.1 (2.6–6.8) |
<0.0001 |
| Etiology of aortic stenosis |
| Degenerative |
1259 (87.3) |
2,120 (89.4) |
<0.0001 |
| Congenital (unicuspid, bicuspid, or quadricuspid) |
133 (9.2) |
125 (5.3) |
|
| Rheumatic |
38 (2.6) |
112 (4.7) |
|
| Infective endocarditis |
2 (0.1) |
5 (0.2) |
|
| Other |
11 (0.8) |
10 (0.4) |
|
| Echocardiograph characteristics |
| Vmax (m/s) |
4.1±0.9 |
4.2±1.0 |
0.07 |
| Vmax ≥4 m/s† |
822 (57.0) |
1,363 (57.5) |
0.76 |
| Mean gradient (mmHg) |
40.0±18.0 |
41.4±20.7 |
0.06 |
| AVA (cm2) |
0.76±0.17 |
0.69±0.18 |
<0.0001 |
| AVA index (cm2/m2) |
0.48±0.11 |
0.51±0.14 |
<0.0001 |
| LVEDD (mm) |
48.8±7.1 |
44.2±6.3 |
<0.0001 |
| LVESD (mm) |
33.0±8.6 |
28.6±7.0 |
<0.0001 |
| LVEF (%)† |
60.1±14.1 |
64.4±12.9 |
<0.0001 |
| Septal wall thickness (mm) |
11.7±2.2 |
11.2±2.3 |
<0.0001 |
| Posterior wall thickness (mm) |
11.3±2.1 |
10.8±2.0 |
<0.0001 |
| LVEF <40% |
149 (10.3) |
144 (6.1) |
<0.0001 |
| LVEF <50% |
303 (21.0) |
290 (12.2) |
<0.0001 |
| Any combined valvular disease (moderate-severe)† |
581 (40.3) |
977 (41.2) |
0.57 |
| Moderate-severe AR |
353 (24.5) |
438 (18.5) |
<0.0001 |
| Moderate-severe MS |
36 (2.5) |
97 (4.1) |
0.009 |
| Moderate-severe MR |
254 (17.6) |
509 (21.5) |
0.004 |
| Moderate-severe TR |
182 (12.6) |
446 (18.8) |
<0.0001 |
| TR pressure gradient ≥40 mmHg† |
193 (13.4) |
413 (17.4) |
0.001 |
Data given as n (%), mean±SD, or median (IQR). †Potential independent variables selected for Cox proportional hazard models. ‡Defined according to World Health Organization criteria (hemoglobin <12.0 g/dL in women and <13.0 g/dL in men). AR, aortic regurgitation; AVA, aortic valve area; AVR, aortic valve replacement; BMI, body mass index; BSA, body surface area; HF, heart failure; LV, left ventricular; LVEDD, LV end-diastolic diameter; LVEF, LV ejection fraction; LVESD, LV end-systolic diameter; MI, myocardial infarction; MR, mitral regurgitation; MS, mitral stenosis; NA, not assessed; NYHA, New York Heart Association; PROM, predicted risk of mortality; STS, Society of Thoracic Surgeons; TR, tricuspid regurgitation; Vmax, peak aortic jet velocity.
Results
Patient Characteristics
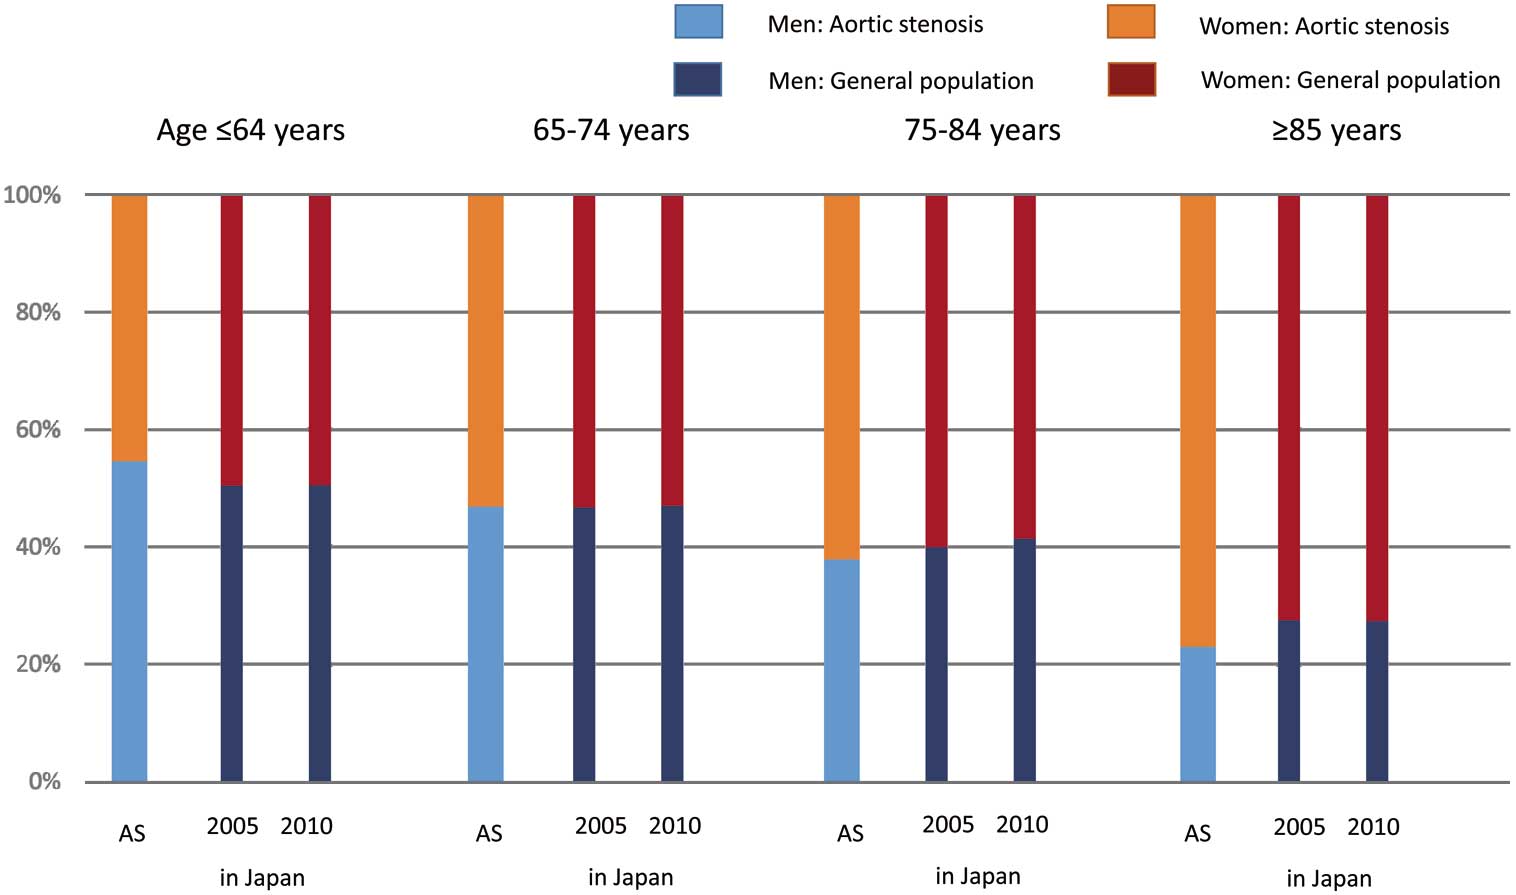
Among the 3,815 patients with severe AS enrolled in this registry, the prevalence of women (2,372 patients, 62.2%) was much higher than that of men (1,443 patients, 37.8%). Women were much older than men (79.3±9.6 vs. 75.2±9.5 years, P<0.0001), and the female:male sex ratio in the population increased with age (Table 1;
Figure 1). More than 50% of the AS patients diagnosed at ≤64 years were men, whereas >60% of severe AS patients diagnosed at ≥65 years were women. Notably, >70% of the severe AS patients diagnosed at ≥80 years were women (Figure 1).

Regarding the baseline clinical characteristics, a greater proportion of women than men had symptoms of AS at presentation (Table 1). Women more often had heart failure, and their New York heart association (NYHA) functional class was greater than that of men. Initial AVR strategy, however, was planned more often in men than in women. When stratified by age, the proportion of patients with the initial AVR strategy was similar between men and women in each age category (Table 1). Women had a smaller body mass index and body surface area (BSA); they were more likely to have anemia, and to have received immunosuppressive therapy. A greater proportion of men had a prior history of atherosclerotic diseases, such as myocardial infarction, stroke, and aortic/peripheral artery disease. Men also had a higher prevalence of comorbidities such as renal disease, malignant disease, and chronic obstructive pulmonary disease. Regarding the etiology of AS, degenerative AS accounted for the majority of both male and female patients.
Regarding the echocardiographic characteristics, women had greater Vmax and PG at presentation, as well as smaller valve areas indexed to BSA (Table 1). Women had smaller and less hypertrophied left ventricles, while men often had depressed left ventricular systolic function as reflected by lower left ventricular ejection fraction. Women more often had pulmonary hypertension as indicated by tricuspid valve regurgitation PG ≥40 mmHg (Table 1).
Sex-Related Differences in Clinical Outcomes
The cumulative 5-year incidence of all-cause death was significantly higher in men than in women (47% vs. 41%, P=0.003), although women as compared with men were significantly older, and less often treated with initial AVR (Figure 2;
Table 2). Even after adjusting for confounders, the excess mortality risk of male relative to female sex remained significant. Men were also associated with a significantly higher risk for sudden death and non-cardiovascular death than women. The adjusted risks of male relative to female sex were neutral for cardiovascular death and aortic valve-related death. Among patients initially treated with the conservative strategy, subsequent AVR was more often performed in men than in women during follow-up (Table 2).

Table 2.
Clinical Outcomes at 5-Years vs. Sex
| |
Men |
Women |
HR (95% CI) |
P value† |
Adjusted HR
(95% CI) |
P value† |
No. patients
with ≥1 event
(cumulative
5-year
incidence, %)
(n=1,443) |
No. patients
with ≥1 event
(cumulative
5-year
incidence, %)
(n=2,372) |
| Death |
589 (47.4) |
860 (40.5) |
1.17 (1.06–1.30) |
0.003 |
1.36 (1.20–1.54) |
<0.0001 |
| Cardiovascular death |
366 (32.7) |
586 (29.6) |
1.07 (0.94–1.22) |
0.32 |
1.15 (0.98–1.33) |
0.08 |
| Aortic valve-related death |
232 (22.0) |
377 (20.2) |
1.05 (0.89–1.24) |
0.55 |
1.20 (0.99–1.45) |
0.06 |
| Sudden death |
96 (9.7) |
100 (5.7) |
1.65 (1.24–2.18) |
0.0005 |
1.65 (1.19–2.27) |
0.003 |
| Non-cardiovascular death |
223 (21.9) |
274 (15.4) |
1.40 (1.17–1.66) |
0.0002 |
1.86 (1.52–2.29) |
<0.0001 |
| HF hospitalization |
268 (27.0) |
544 (30.7) |
0.83 (0.71–0.96) |
0.01 |
0.96 (0.81–1.13) |
0.60 |
Composite of aortic valve-related
death or hospitalization due to HF |
387 (34.7) |
685 (36.1) |
0.95 (0.83–1.07) |
0.38 |
1.01 (0.87–1.16) |
0.93 |
Surgical AVR or TAVI (initial AVR
group)‡ |
492/507 (99.1) |
671/690 (98.2) |
NA |
|
NA |
|
Surgical AVR or TAVI (conservative
group)‡ |
224/936 (44.5) |
317/1,682 (31.4) |
NA |
|
NA |
|
†Kaplan-Meier log rank. ‡TAVI performed during follow-up in 1 patient in the initial AVR group, and in 15 patients in the conservative group. The number of patients with at least 1 event was counted through the entire follow-up period, while the cumulative incidence was truncated at 5 years. TAVI, transcatheter aortic valve implantation; other abbreviations as in Table 1.
We analyzed the 5-year outcomes for all-cause death, cardiovascular death, and non-cardiovascular death stratified by age and sex (Figure 3;
Figures S1–S3). Male and female patients aged ≤64 years had similarly low 5-year mortality rates. In patients aged ≥65 years, the 5-year mortality was significantly higher in men than women across all age categories (Figure 3). Those sex-related mortality differences in the age groups >65 years remained significant even after adjusting for confounders (Table S1).
Sex-Related Differences in Outcome After AVR
In the initial AVR group, the sex differences in the patient characteristics were similar to those in the entire cohort, except that men and women had a similar symptomatic status at presentation (Table S2). Regarding the AVR procedural characteristics in the initial AVR group, the prosthetic valve size was smaller in women than in men, although the prevalence of type of valves used (prosthetic, bioprosthetic and mechanical valves) did not differ by sex (Table S3). In the initial AVR group, 30-day mortality rate after AVR was not significantly different between men and women (2.4% vs. 1.3%, P=0.16), but the cumulative 1-year and 5-year incidences of all-cause death was significantly higher in men than in women (10.5% vs. 5.6%, P=0.003, and 28.7% vs. 17.7%, P=0.0001, respectively;
Table S4). The cumulative incidences of cardiovascular death, aortic valve-related death, and aortic valve procedure-related death were similar between men and women, while the cumulative incidences of non-cardiovascular death were much lower in women than in men (Table S4). After adjusting for confounders, the sex-related differences in all-cause death were attenuated, whereas the risk for non-cardiovascular death remained strongly related to sex, with a significantly higher risk in male than in female patients (Table S5).
Discussion
The main findings of the present analysis were as follows; First, in this large Japanese multicenter registry of consecutive patients with severe AS, the number of women was much greater than that of men, with greater prevalence of women with increasing patient age; Second, the 5-year mortality rate was lower in women than in men, even though women were much older, and more often symptomatic; Third, lower 5-year mortality rates in women were consistently seen across all the age groups >65 years.
In this study, the proportion of women was much greater than in the previous registries, including those of conservatively treated patients12
or in the population based studies.6,13,14
In previous epidemiological studies on patients with late-onset AS,5,13,14
the number of women was equal to or greater than the number of men, but, after adjusting for age, the prevalence of AS was reported to be higher in men than in women.13,14
In the current study there were slightly more men than women in the <65 years age group, while in the >65 years group, there were more women than men, with the proportion of women increasing with age (Figure 1). The increase in the female:male sex ratio with aging in the present severe AS patients was similarly observed in the general population in Japan in 2005 and 2010 (Figure 4).15
Therefore, one explanation for the obvious female predominance in the present study would be the relatively longer life expectancy of women in Japan. Increasing prevalence of AS with age,1,5,13,16
and longer life expectancy of women might synergistically influence the predominance of elderly women with severe AS in the present study. Another explanation for the female predominance might be broader medical attention for the elderly and for women in the present study than in the earlier studies. It has been hypothesized that women receive medical attention less frequently than men. A comparison between a population-based study for valve disease among randomly selected adults from the general population and a community study using clinical data on valve diseases suggested that there was no difference between men and women in the frequency of valve diseases, but that valve disease was diagnosed less often in women than in men in the community group, indicating an important diagnostic gap between men and women.1
In contrast, the similar distribution of sex ratio by age between the present patients and the general population may indicate that any detection bias between men and women is small. Moreover, most Japanese adults receive periodical medical check-up, and this may be associated with the more frequent diagnosis of AS.17
Regarding the treatment strategies for AS, initial AVR was less frequently chosen in women than in men despite the greater prevalence of symptomatic patients in women. The prevalence of initial AVR, however, was similar between men and women when stratified by age categories, suggesting the absence of a large treatment gap between men and women in the decision for AVR.
In the present study, women were older and more often symptomatic than men at presentation. This is in agreement with previously published data.18,19
The advanced symptomatic status of women has been attributed to greater echocardiographic AS severity, as indicated by smaller AVA, as well as greater Vmax and mean PG.20
Furthermore, pulmonary hypertension was more prevalent in women. Despite these high-risk features and lower prevalence of initial AVR in women, the 5-year mortality rate was significantly lower in women than in men. Aging was strongly related to the 5-year mortality in both men and women. Male and female patients aged <65 years had similarly low 5-year mortality rates. In those >65 years, the 5-year mortality rate was significantly higher in men than in women. In women, the increase in mortality with aging was delayed as compared with men. Higher prevalence of a prior history of atherosclerotic diseases, renal disease, malignant disease, and chronic obstructive pulmonary disease in men as compared with women might influence the sex-related mortality difference even after the adjustment for these factors as confounders. Most of the sex-related mortality difference was due to the difference in non-cardiovascular death, indicating that the generally longer life expectancy in women strongly influences the prognosis in AS. In contrast, the risk for AS-related outcomes such as aortic valve-related death and heart failure hospitalization was neutral between men and women.
There have been a number of reports on sex-related differences in surgical outcomes in patients with severe AS. Morris et al reported increased short-term mortality in women,19
whereas other reports have indicated better long-term survival in women21
or no sex-related differences in outcomes.22
These varying results may be explained by the differences in comorbidities contributing to mortality risks. In the present study evaluating a large number of patients with AVR, the crude 30-day mortality rate was not different between men and women, while the crude 5-year mortality rate was much lower in women than in men. The better crude survival in women was presumably due to longer life expectancy. Fuchs et al reported a lower mortality in women after AVR in the ≥79-years age group.21
In the present study, sex-related differences in survival after AVR in the elderly were also observed in those aged ≥65 years (data not shown). Adjusted 5-year mortality risk of male relative to female patients, however, was neutral, suggesting that the better crude survival rate in women was related to the lower prevalence of measured morbidities in women.
Study Limitations
This study had several limitations. First, the comparison of the incidence of severe AS between men and women may have been affected by detection bias. Such bias cannot be fully excluded even though this was a large-scale multicenter registry and the female:male sex ratio stratified by age was similar between the present subjects and the general population. To further investigate this issue, a large-scale population-based study is required. Second, we enrolled patients who met the definition of severe AS for the first time during the study period. The mortality outcome after the enrollment may vary with duration from the onset of symptoms to enrollment in symptomatic patients.23
Third, in this observational study, the possibility of residual confounding and selection bias could not be ruled out. Fourth, surgical treatment was performed more often in men than in women. We could not deny a possible selection bias between men and women in decisions about surgical treatment, although the prevalence of initial AVR was similar between male and female patients when stratified by age. Fifth, elderly patients often had complex comorbidities, significant physical or cognitive disabilities, and frailty. Such factors possibly could potentially influence patient detection and treatment decision making. Although we thoroughly reviewed all patient charts and the hospital databases to evaluate patient condition, factors specific to the elderly were not included in the pre-specified protocol. Finally, when interpreting the current study results, ethnicity, health-care systems, and social systems in Japan should be considered, because these could influence patient detection and outcomes.
Conclusions
A large Japanese multicenter registry of consecutive patients with severe AS had a much higher proportion of women than men, with the female:male sex ratio increasing with age. The 5-year mortality rate of women was lower than that of men. Lower 5-year mortality rates in women were consistently seen across all age categories >65 years.
Acknowledgments
This work was supported by an educational grant from the Research Institute for Production Development (Kyoto, Japan).
Disclosures
The authors declare no conflict of interest.
Supplementary Files
Supplementary File 1
Figure S1.
Kaplan-Meier curves for all-cause death stratified by age: male vs. female sex.
Figure S2.
Kaplan-Meier curves for cardiovascular death stratified by age: male vs. female sex.
Figure S3.
Kaplan-Meier curves for non-cardiovascular death stratified by age: male vs. female sex.
Table S1.
Crude and adjusted mortality risk of male relative to female sex vs. age
Table S2.
Initial AVR group subject characteristics vs. age
Table S3.
Initial AVR group: preoperative information and procedure characteristics
Table S4.
Clinical outcome of initial AVR
Table S5.
Crude and adjusted effects of male relative to female sex for clinical outcome of initial AVR
Please find supplementary file(s);
http://dx.doi.org/10.1253/circj.CJ-16-1244
References
- 1.
Nkomo VT, Gardin JM, Skelton TN, Gottdiener JS, Scott CG, Enriquez-Sarano M. Burden of valvular heart diseases: A population-based study. Lancet 2006; 368: 1005–1011.
- 2.
Vahanian A, Alfieri O, Andreotti F, Antunes MJ, Baron-Esquivias G, Baumgartner H, et al. Guidelines on the management of valvular heart disease (version 2012). Eur Heart J 2012; 33: 2451–2496.
- 3.
Selzer A. Changing aspects of the natural history of valvular aortic stenosis. N Engl J Med 1987; 317: 91–98.
- 4.
Wagner S, Selzer A. Patterns of progression of aortic stenosis: A longitudinal hemodynamic study. Circulation 1982; 65: 709–712.
- 5.
Eveborn GW, Schirmer H, Heggelund G, Lunde P, Rasmussen K. The evolving epidemiology of valvular aortic stenosis. The Tromso study. Heart 2013; 99: 396–400.
- 6.
Osnabrugge RL, Mylotte D, Head SJ, Van Mieghem NM, Nkomo VT, LeReun CM, et al. Aortic stenosis in the elderly: Disease prevalence and number of candidates for transcatheter aortic valve replacement: A meta-analysis and modeling study. J Am Coll Cardiol 2013; 62: 1002–1012.
- 7.
McSweeney JC, Rosenfeld AG, Abel WM, Braun LT, Burke LE, Daugherty SL, et al. Preventing and experiencing ischemic heart disease as a woman: State of the science: A scientific statement from the American Heart Association. Circulation 2016; 133: 1302–1331.
- 8.
Taniguchi T, Morimoto T, Shiomi H, Ando K, Kanamori N, Murata K, et al. Initial surgical versus conservative strategies in patients with asymptomatic severe aortic stenosis. J Am Coll Cardiol 2015; 66: 2827–2838.
- 9.
Nishimura RA, Otto CM, Bonow RO, Carabello BA, Erwin JP 3rd, Guyton RA, et al. 2014 AHA/ACC guideline for the management of patients with valvular heart disease: A report of the American College of Cardiology/American Heart Association Task Force on Practice Guidelines. Circulation 2014; 129: e521–e643.
- 10.
Leon MB, Piazza N, Nikolsky E, Blackstone EH, Cutlip DE, Kappetein AP, et al. Standardized endpoint definitions for transcatheter aortic valve implantation clinical trials: A consensus report from the Valve Academic Research Consortium. J Am Coll Cardiol 2011; 57: 253–269.
- 11.
Kappetein AP, Head SJ, Genereux P, Piazza N, van Mieghem NM, Blackstone EH, et al. Updated standardized endpoint definitions for transcatheter aortic valve implantation: The Valve Academic Research Consortium-2 consensus document. J Am Coll Cardiol 2012; 60: 1438–1454.
- 12.
Pilgrim T, Englberger L, Rothenbuhler M, Stortecky S, Ceylan O, O’Sullivan CJ, et al. Long-term outcome of elderly patients with severe aortic stenosis as a function of treatment modality. Heart 2015; 101: 30–36.
- 13.
Stewart BF, Siscovick D, Lind BK, Gardin JM, Gottdiener JS, Smith VE, et al. Clinical factors associated with calcific aortic valve disease: Cardiovascular health study. J Am Coll Cardiol 1997; 29: 630–634.
- 14.
Martinsson A, Li X, Andersson C, Nilsson J, Smith JG, Sundquist K. Temporal trends in the incidence and prognosis of aortic stenosis: A nationwide study of the Swedish population. Circulation 2015; 131: 988–994.
- 15.
Ministry of Health, Labour and Welfare. http://www.mhlw.go.jp, accessed http://www.e-stat.go.jp/SG1/estat/GL08020101.do?_toGL08020101_&tstatCode=000001028897&requestSender=dsearch (accessed July 17, 2016).
- 16.
Lindroos M, Kupari M, Heikkila J, Tilvis R. Prevalence of aortic valve abnormalities in the elderly: An echocardiographic study of a random population sample. J Am Coll Cardiol 1993; 21: 1220–1225.
- 17.
Krogsboll LT, Jorgensen KJ, Gotzsche PC. General health checks in adults for reducing morbidity and mortality from disease. JAMA 2013; 309: 2489–2490.
- 18.
Carroll JD, Carroll EP, Feldman T, Ward DM, Lang RM, McGaughey D, et al. Sex-associated differences in left ventricular function in aortic stenosis of the elderly. Circulation 1992; 86: 1099–1107.
- 19.
Morris JJ, Schaff HV, Mullany CJ, Morris PB, Frye RL, Orszulak TA. Gender differences in left ventricular functional response to aortic valve replacement. Circulation 1994; 90: II183–189.
- 20.
Douglas PS, Otto CM, Mickel MC, Labovitz A, Reid CL, Davis KB. Gender differences in left ventricle geometry and function in patients undergoing balloon dilatation of the aortic valve for isolated aortic stenosis: NHLBI Balloon Valvuloplasty Registry. Br Heart J 1995; 73: 548–554.
- 21.
Fuchs C, Mascherbauer J, Rosenhek R, Pernicka E, Klaar U, Scholten C, et al. Gender differences in clinical presentation and surgical outcome of aortic stenosis. Heart 2010; 96: 539–545.
- 22.
Kulik A, Lam BK, Rubens FD, Hendry PJ, Masters RG, Goldstein W, et al. Gender differences in the long-term outcomes after valve replacement surgery. Heart 2009; 95: 318–326.
- 23.
Chizner MA, Pearle DL, deLeon AC Jr. The natural history of aortic stenosis in adults. Am Heart J 1980; 99: 419–424.

