Abstract
Background:
High prevalence of frailty and of diastolic dysfunction (DD) in heart failure and high mortality in frail adults have been noted. We characterized frailty by quantifying differences on echocardiography, and assessed the added prognostic utility of frailty and DD grade in an elderly population.
Methods and Results:
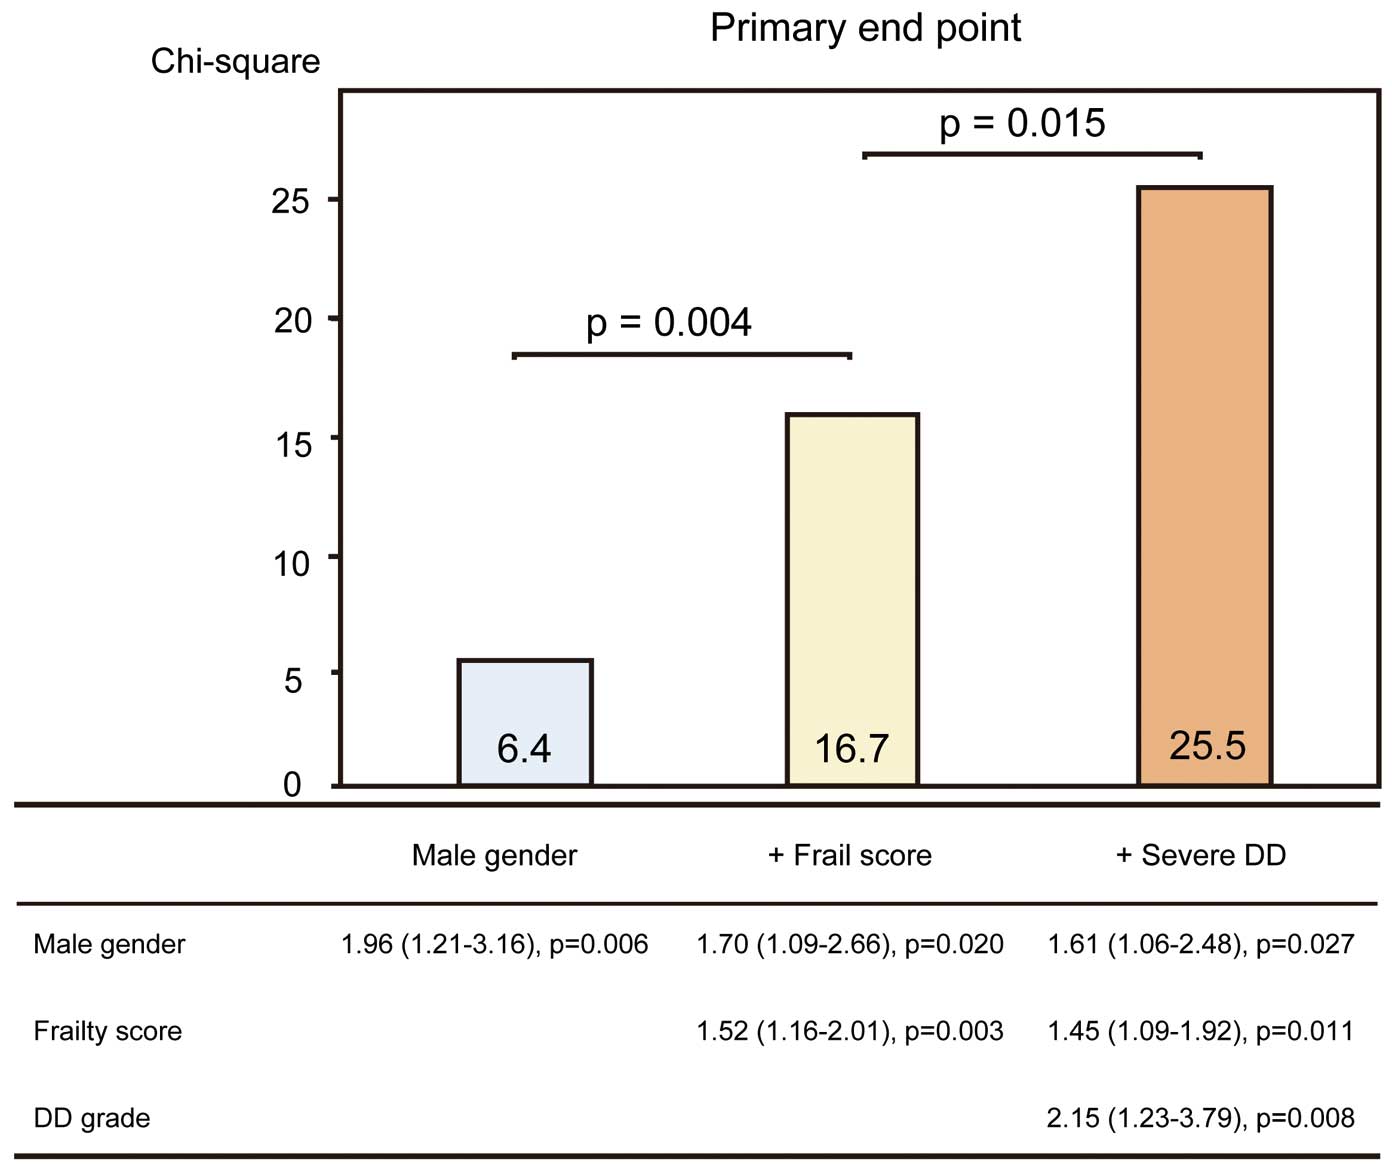
One hundred and ninety-one patients ≥65 years who had at least 1 cardiovascular risk factor were prospectively recruited for clinically indicated echocardiography at the present institute. Weight loss, exhaustion, and deficits in physical activity, gait speed, and handgrip strength were used to categorize patients as frail (≥3 features), intermediately frail (1 or 2 features), or non-frail (0 features). DD grade ≥2 was defined as severe. Frailty was associated with larger left atrial volume, smaller stroke volume, and worse DD grade after adjustment for age. In a period of 14 months, 29 patients (15%) had cardiovascular events. The addition of frailty score and severe DD significantly improved the prognostic power of a model containing male gender (model 1, male gender, χ2=6.4; model 2, model 1 plus frailty score, χ2=16.7, P=0.004; model 3, model 2 plus severe DD, χ2=25.5, P=0.015).
Conclusions:
Both frailty and DD grade were significantly associated with future cardiovascular events in an elderly population with preserved ejection fraction and ≥1 risk factor of cardiovascular disease.
Aging of the population and life prolongation have led to an increased prevalence of heart failure (HF), especially in Japan.1,2
Despite advances in modern therapy, mortality and rehospitalization rates for HF remain unacceptably high.3
The crucial task is to develop new lines of examination in HF and identify patients who can benefit from preventive treatment before the onset of overt HF. Frailty is defined as a reduced capability to recover from pathological or iatrogenic stressors due to aging-related impairments.4–6
Frailty is a highly prevalent condition in older adults and specifically among those with cardiovascular disease.7
High prevalence of frailty in HF and high mortality have been noted in frail adults.8,9
Frailty might be useful to detect the early stage of cardiac dysfunction, but the relationship between frailty and cardiac function is not well recognized.
Editorial p ????
Echocardiography can determine the underlying background pathophysiology and severity of HF, and it also helps clinicians to estimate prognosis.10–14
In the evaluation of HF and of the progression of cardiovascular disease, classification of left ventricular (LV) diastolic dysfunction (DD) is important. Also, a simplified algorithm and clarification of the gray zone in the evaluation of diastolic function are also needed.15
This new classification of DD might be useful to predict outcome in older adults. The purpose of this study was therefore to characterize frailty by quantifying differences in echocardiography and to determine the added prognostic utility of frailty and newly diagnosed DD grade in an elderly population.
Methods
Subjects
From December 2015 to July 2016, 216 patients ≥65 years who had at least 1 cardiovascular risk factor such as hypertension, dyslipidemia, diabetes mellitus, or a history of cardiovascular disease (myocardial infarction [MI], stroke or HF), were prospectively recruited for clinically indicated echocardiography. We excluded patients with atrial fibrillation/flutter, LV ejection fraction (LVEF) <45%, severe valvular disease or incomplete echocardiography. We also excluded patients with a limited life expectancy due to non-cardiac causes (i.e., terminal malignancy, hemorrhagic stroke, and advanced lung disease), unstable clinical condition, or death ≤30 days of the initial echocardiography. Frailty assessment and echocardiography were carried out on the same day. A total of 191 consecutive patients were included for the final analysis, and there were no missing data during follow-up (Figure 1). The Institutional Review Board of Tokushima University Hospital approved the study protocol, and written informed consent was obtained from all subjects.

Echocardiography was performed using a commercially available ultrasound machine (iE33; Philips Healthcare, Amsterdam, The Netherlands; Vivid E9; GE Healthcare, Waukesha, WI, USA; and SSA-770A; Toshiba Medical, Otawara, Japan). All echocardiography measurements were carried out according to American Society of Echocardiography recommendations.16
LV and left atrial (LA) size were calculated using the biplane method of disks on 2-D imaging and indexed to body surface area. Stroke volume was calculated as the product of the cross-sectional area of the LV outflow tract and the time-velocity integral in the LV outflow tract and indexed to body surface area (SVi). The early diastolic (e’) mitral annular tissue velocity was also measured in the apical 4-chamber view with the sample volume positioned at the lateral and septum mitral annulus. Systolic pulmonary artery pressure (SPAP) was measured from the maximum continuous-wave Doppler velocity of the tricuspid regurgitant jet using the systolic transtricuspid pressure gradient calculated using the modified Bernoulli equation. Right atrial pressure was estimated from the inferior vena cava diameter and collapsibility.17
Because all patients ≥65 years had at least 1 cardiovascular risk factor, the DD was ≥grade I in this cohort. DD was graded according to the recent guideline algorithm (Figure S1) by 2 trained cardiologists as grade I, grade II or grade III.15
There were no patients with undetermined DD grade because we excluded patients with incomplete echocardiography. Severe DD was defined as DD grade ≥2. All measurements were performed and averaged over 3 cardiac cycles. These measurements were independently performed in a blinded manner by 2 observers not involved in the image acquisition and who had no knowledge of frailty data.
Frailty Assessment
Frailty phenotype was assessed using a multidimensional construct as previously reported by Fried et al in the Cardiovascular Health Study.18
The determination of frailty incorporates abnormalities in musculoskeletal, nutritional, and functional domains. For each participant, 5 criteria were measured: weight loss (>4.5 kg in the preceding year); exhaustion; low physical activity; slow gait speed (walking time <6 m/s); and weak handgrip strength. Handgrip strength was tested in the participant’s dominant hand with a handgrip dynamometer and recorded in kilograms.18
Abnormal handgrip strength was adjusted for gender. Patients were classified as “frail” if they fulfilled ≥3 criteria; as “intermediately frail” if they fulfilled 1 or 2 criteria; and as “non-frail” if they did not fulfill any of the 5 criteria.
Clinical Outcomes
All patients were followed at Tokushima University Hospital (clinical follow-up visits at least every 3 months). Clinical management was independent of frailty and DD grade. Follow-up started at the time of the initial tests and ended in September 2017. The primary endpoint was the incidence of major adverse cardiovascular events (MACE), defined as cardiac death, non-fatal MI/newly developed coronary stenosis requiring revascularization, acute pulmonary edema with symptom confirmed on chest radiograph, or stroke.
Statistical Analysis
Data are presented as mean±SD for normally distributed data according to Kolmogorov-Smirnov test. Otherwise, median (IQR) was used. One-way general linear model analysis of variance, followed by Dunnett T3 post-hoc test analysis, was used to assess the difference in parameters between the frail, intermediately frail and non-frail groups. We stratified groups as frail, intermediately frail, and non-frail for comparisons and tested the association of baseline clinical and echocardiography parameters across frailty groups using Pearson coefficient analysis. The association of several parameters with endpoints was identified on Cox proportional-hazards modeling on univariable and multivariable analysis. Clinical and echocardiography variables were incorporated into the multivariable models using a stepwise variable selection method in which variables were either entered or removed for P<0.05 or P>0.1, respectively. Sequential Cox models were used to determine the added prognostic benefit of frailty and DD grade over the baseline model, with increased prognostic value defined as a significant increase in global chi-squared. Hazard ratio (HR) and 95% CI were calculated for each variable. The assumption of proportional hazards was assessed by plotting the scaled Schoenfeld residuals for each independent variable against time; these correlations were found to be non-significant. To assess prognostic value, patients were divided into groups using frailty and DD grade for Kaplan-Meier analysis, with event-free survival compared using 2-sided log-rank test. Time-dependent receiver operating characteristic (ROC) curves were used to calculate the C statistic using the R package survival ROC. The DeLong method was used to compare the C statistic.19
The improvement in predictive accuracy was evaluated by calculating the net reclassification improvement using the R package PredictABEL. Statistical analysis was performed using SPSS 21.0 (SPSS, Chicago, IL, USA), MedCalc 15.8 (Mariakerke, Belgium), and R 3.3.3 (R Foundation for Statistical Computing, Vienna, Austria) and statistical significance was defined as P<0.05.
Results
Patient Characteristics
Baseline subject characteristics are listed in
Table 1. The subjects consisted of 191 patients (mean age, 75±7 years; 58% male) who underwent echocardiography. A total of 62% of patients with hypertension, 51% had diabetes, and 13% had prior myocardium infarction. In this cohort, 36 patients (19%) were non-frail, 117 patients were intermediately frail (61%), and 38 (20%) were frail. According to laboratory data, frailty was associated with lower hemoglobin. With regard to echocardiographic variables, frailty was associated with larger LV mass, larger LA volume, smaller stroke volume, higher E/e’, higher SPAP and worse DD grade.
Table 1.
Clinical Subject Characteristics vs. Frailty Status
| Variable |
Non-frail |
Intermediately frail |
Frail |
P-value |
| n |
36 |
117 |
38 |
|
| Age (years) |
72±6 |
74±6 |
79±6 |
<0.001 |
| Men |
53 |
56 |
66 |
0.61 |
| BMI (kg/m2) |
24±3 |
24±4 |
23±3 |
0.27 |
| SBP (mmHg) |
138±19 |
134±20 |
128±19 |
0.09 |
| Heart rate (beats/min) |
75±17 |
74±12 |
72±12 |
0.47 |
| Medical history |
| Hypertension |
56 |
65 |
58 |
0.52 |
| Hyperlipidemia |
36 |
41 |
37 |
0.82 |
| Diabetes mellitus |
50 |
54 |
45 |
0.62 |
| Prior heart failure |
25 |
43 |
45 |
0.13 |
| Prior MI |
8 |
13 |
16 |
0.63 |
| Stroke |
11 |
10 |
11 |
0.98 |
| Medication |
| β-blocker |
14 |
23 |
26 |
0.40 |
| ACEi or ARB |
17 |
28 |
31 |
0.29 |
| Calcium blocker |
28 |
37 |
37 |
0.30 |
| Antiplatelet |
11 |
25 |
34 |
0.07 |
| Laboratory data |
| Hemoglobin (g/dL) |
12.9±1.8 |
12.4±1.6 |
11.6±1.1 |
0.02 |
| Creatinine (mg/dL) |
0.8±0.2 |
1.0±0.4 |
1.0±0.3 |
0.14 |
| BNP (pg/mL) |
46 (25–92) |
109 (41–210) |
60 (20–194) |
0.49 |
| Frailty index |
| Total score |
0 |
1.4±0.5 |
3.5±0.7 |
– |
| Handgrip strength (kg) |
31±8 |
26±8 |
20±8 |
<0.001 |
| Echocardiography |
| LVEDVi (mL/m2) |
55±12 |
59±19 |
57±17 |
0.34 |
| LVESVi (mL/m2) |
20±7 |
24±14 |
22±13 |
0.32 |
| LVEF (%) |
64±7 |
62±8 |
62±8 |
0.53 |
| LV mass index (g/m2) |
74±16 |
84±17 |
84±26 |
0.04 |
| LA volume index (mL/m2) |
30±9 |
35±12 |
39±19 |
0.012 |
| SVi (mL/m2) |
40±6 |
37±7 |
35±7 |
0.01 |
| E/A ratio |
0.71 (0.55–0.87) |
0.75 (0.64–0.84) |
0.76 (0.63–0.89) |
0.63 |
| e’ |
9±3 |
8±2 |
7±3 |
0.028 |
| E/e’ ratio |
8±3 |
9±4 |
11±6 |
0.03 |
| SPAP (mmHg) |
30±6 |
32±7 |
36±6 |
0.004 |
| Severe DD |
6 |
21 |
31 |
0.019 |
Data given as %, mean±SD or median (IQR). A, late diastolic transmitral flow velocity; ACEi, angiotensin-converting enzyme inhibitor; ARB, angiotensin II receptor antagonist; BMI, body mass index; BNP, brain natriuretic peptide; DD, diastolic dysfunction; E, early diastolic transmitral flow velocity; e’, early diastolic mitral annular motion; LA, left atrial; LVEDVi, left ventricular end-diastolic volume index; LVEF, left ventricular ejection fraction; LVESVi, left ventricular end-systolic volume index; MI, myocardial infarction; SBP, systolic blood pressure; SPAP, systolic pulmonary artery pressure; SVi, stroke volume index.
Parameters of LV systolic and diastolic function correlated with frailty score (Table 2). After adjustment for age and SVi, LA volume index (standardized β=0.248, P=0.001) and severe DD (standardized β=0.180, P=0.015) were associated with frailty score. This suggested that frail adults (vs. non-frail and intermediately frail adults) were more likely to have larger LA volume, lower stroke volume, and worse DD grade.
Table 2.
Correlation Between Frailty and Echocardiographic Variables
| Variables |
Univariate analysis |
After adjustment for age and stroke volume index |
| R-value |
P-value |
Standardized β |
P-value |
Standardized β |
P-value |
| Age |
0.282 |
<0.001 |
0.188 |
0.003 |
0.218 |
0.003 |
| Gender |
0.072 |
0.323 |
|
|
|
|
| BMI (kg/m2) |
−0.039 |
0.594 |
|
|
|
|
| SBP (mmHg) |
−0.147 |
0.045 |
|
|
|
|
| Heart rate (beats/min) |
−0.062 |
0.397 |
|
|
|
|
| Hemoglobin (g/dL) |
−0.219 |
0.002 |
|
|
|
|
| Creatinine (mg/dL) |
0.489 |
0.059 |
|
|
|
|
| BNP (pg/mL) |
−0.013 |
0.945 |
|
|
|
|
| Echocardiography |
| LVEDVi (mL/m2) |
0.036 |
0.624 |
|
|
|
|
| LVESVi (mL/m2) |
0.045 |
0.539 |
|
|
|
|
| LVEF (%) |
−0.057 |
0.433 |
|
|
|
|
| LV mass index (g/m2) |
0.17 |
0.019 |
|
|
|
|
| LA volume index (mL/m2) |
0.246 |
0.001 |
0.248 |
0.001 |
|
|
| SVi (mL/m2) |
−0.175 |
0.015 |
−0.213 |
0.003 |
−1.777 |
0.013 |
| E/A ratio |
0.077 |
0.318 |
|
|
|
|
| e’ |
0.206 |
0.004 |
|
|
|
|
| E/e’ ratio |
0.248 |
0.001 |
|
|
|
|
| SPAP (mmHg) |
0.217 |
0.003 |
|
|
|
|
| Severe DD |
0.236 |
0.001 |
|
|
0.180 |
0.015 |
Abbreviations as in Table 1.
Over a period of 14 months (range, 2–20 months), 29 patients (15%) experienced the primary endpoint. Primary endpoint causes included cardiac death (n=3; 1.5%), MI/newly developed coronary stenosis requiring revascularization (n=8; 4%), acute pulmonary edema (n=13; 7%), and stroke/transient ischemic attack (n=5; 2.5%). There was no association of medication with primary endpoint. On univariate analysis, male gender, systolic blood pressure, prior HF, hemoglobin, frailty score, LA volume index, E/e’, SPAP and DD grade were associated with the primary endpoint (Table 3). On stepwise multivariate analysis, frailty score (HR, 1.45; 95% CI: 1.09–1.92, P=0.011) and DD grade (HR, 2.15; 95% CI: 1.23–3.79, P=0.008) were associated with the primary endpoint after adjustment for gender (Table 3).
Figure 2
shows the time to primary endpoint stratified according to frail phenotype and DD grade. Frailty appeared to be associated with worse outcome (P=0.022), but there was no significant difference in event-free survival curves between the non-frail and intermediately frail. Patients with severe DD (DD grade ≥2) had significantly shorter event-free survival than those with mild DD (P=0.008). Patients with both frailty and severe DD had significantly shorter event-free survival than those without frailty or severe DD (P=0.001).
Table 3.
Univariable and Multivariate Indicators of Primary Outcome
| |
Univariate analysis |
Stepwise multivariate analysis |
| HR |
95% CI |
P-value |
HR |
95% CI |
P-value |
| Age |
1.05 |
0.99–1.11 |
0.07 |
|
|
|
| Male |
1.96 |
0.55–7.99 |
0.006 |
1.62 |
1.06–2.48 |
0.027 |
| BMI (kg/m2) |
0.92 |
0.84–1.01 |
0.06 |
|
|
|
| SBP (mmHg) |
0.98 |
0.96–1.00 |
0.05 |
|
|
|
| Heart rate (beats/min) |
0.99 |
0.97–1.02 |
0.69 |
|
|
|
| Medical history |
| Hypertension |
2.09 |
0.89–4.89 |
0.07 |
|
|
|
| Hyperlipidemia |
1.45 |
0.70–2.99 |
0.32 |
|
|
|
| Diabetes mellitus |
1.87 |
0.87–4.03 |
0.1 |
|
|
|
| Prior heart failure |
2.66 |
1.26–5.63 |
0.011 |
|
|
|
| Prior MI |
1.92 |
0.78–4.72 |
0.16 |
|
|
|
| Stroke |
1.96 |
0.75–5.11 |
0.17 |
|
|
|
| Hemoglobin (g/dL) |
0.74 |
0.58–0.95 |
0.02 |
|
|
|
| Creatinine (mg/dL) |
1.49 |
0.45–4.89 |
0.51 |
|
|
|
| BNP (pg/mL) |
1.01 |
0.99–1.01 |
0.64 |
|
|
|
| Frailty score |
1.57 |
1.19–2.06 |
0.001 |
1.45 |
1.09–1.92 |
0.011 |
| Echocardiography |
| LVEDVi (mL/m2) |
1.01 |
0.99–1.03 |
0.08 |
|
|
|
| LVESVi (mL/m2) |
1.02 |
0.99–1.03 |
0.09 |
|
|
|
| LVEF (%) |
0.97 |
0.93–1.01 |
0.11 |
|
|
|
| LV mass index (g/m2) |
1.01 |
0.99–1.03 |
0.11 |
|
|
|
| LA volume index (mL/m2) |
1.03 |
1.01–1.05 |
0.005 |
|
|
|
| SVi (mL/m2) |
0.96 |
0.91–1.01 |
0.1 |
|
|
|
| E/A ratio |
3.69 |
0.95–14.3 |
0.06 |
|
|
|
| e’ |
0.89 |
0.77–1.04 |
0.16 |
|
|
|
| E/e’ ratio |
1.08 |
1.01–1.14 |
0.02 |
|
|
|
| SPAP (mmHg) |
1.07 |
1.02–1.12 |
0.003 |
|
|
|
| Diastolic grade |
2.35 |
1.40–3.95 |
0.001 |
2.15 |
1.23–3.79 |
0.008 |
Abbreviations as in Table 1.

The added benefit of echocardiographic parameters in the prediction of the primary endpoint is shown in
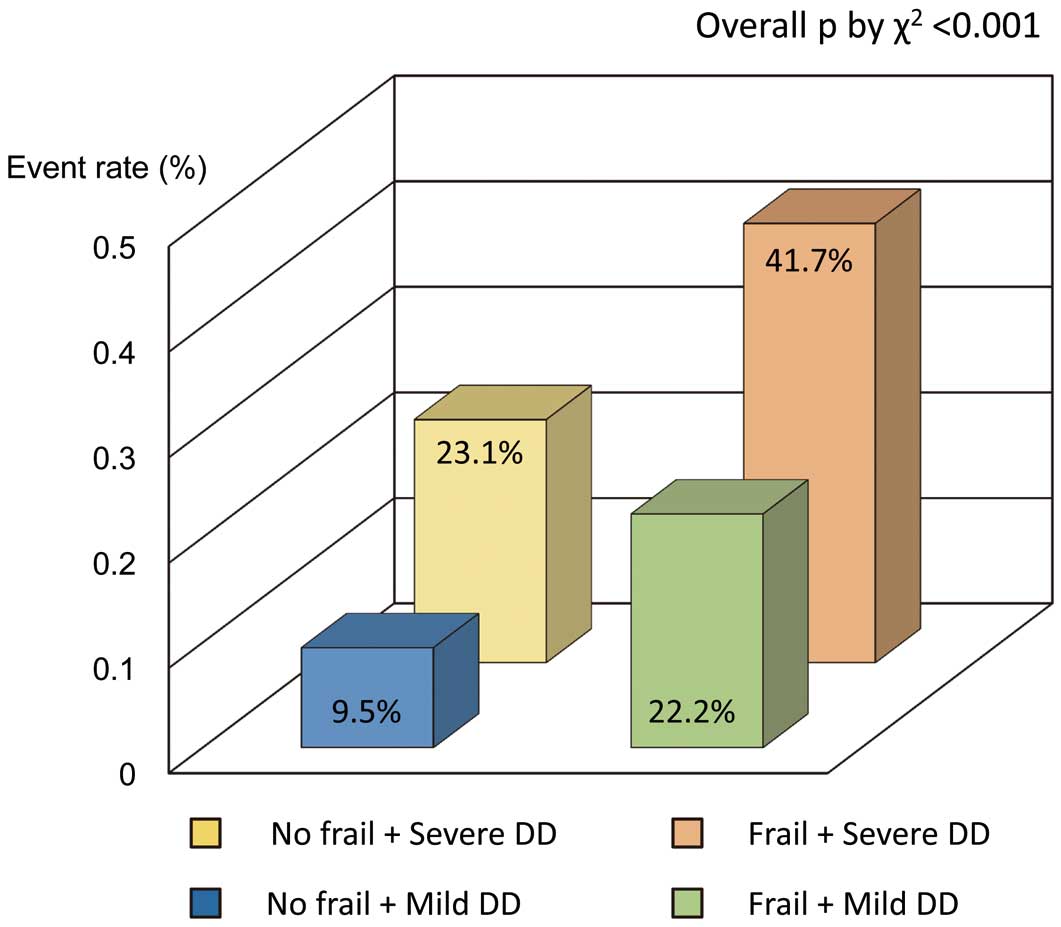
Figure 3. The addition of frailty score and DD grade significantly improved the prognostic power of a model containing male gender (model 1, male gender, χ2=6.4; model 2, plus frailty score, χ2=16.7, P=0.004; model 3, plus DD grade, χ2=25.5, P=0.015). Harrell’s C concordance statistic in model 3 was significantly higher than in model 2 (C statistic, 0.69 for model 3; C statistic, 0.61 for model 2; P=0.04). By incorporating severe DD into frailty, net reclassification index for MACE was 0.18 (95% CI: 0.03–0.32; P=0.02). Patients with severe DD and frailty had significantly higher MACE rates compared with those without frailty and with mild DD (overall P<0.001, χ2
test;
Figure 4). Thus, DD grade and frailty might be useful to predict adverse outcome in an elderly population.
Discussion
In the present study, in elderly patients with preserved EF and cardiovascular risk factors, patients with frailty and DD had worse outcomes. In patients who underwent echocardiography, there was a relatively high prevalence of frailty (19%). This simple and economical assessment of frailty is an additional test that can be used to detect a high-risk cohort in patients who underwent clinically indicated echocardiography. Moreover, the new DD grading is also a simple and reproducible technique in echocardiographic assessment to predict outcome. The combination of frailty and DD grade might be easy to use even in a busy clinical setting.
Frailty and Cardiac Structure/Function
Multiple age-related changes occur in the cardiovascular system. Frailty has been defined as a state of late life decline and vulnerability, identified as physical weakness and decreased physiologic reserve.18
Differences between normal age-related change and frailty-related change in the cardiac structure and function have not been well described.20
From the Cardiovascular Health Study, Newman et al showed that an increase in LV mass was noted in frail patients compared with non-frail.21
In the present study, LA volume, stroke volume, and DD grade were associated with frailty score after adjustment for age. Although we did find important differences in LA volume, stroke volume, and DD grade, there was no association between LV mass and frailty. A possible explanation could be that lower stroke volume is related to smaller LV cavities (r=0.32, P<0.001) because of hypertensive heart disease in patients with frailty. Leibowitz et al evaluated cardiac function in elderly patients with features of disability and observed that patients with frailty were more likely to have lower EF, higher LV mass, and larger LA volume.22
They concluded that systolic function was mainly associated with frailty,22
but they did not include the DD grade and pulmonary artery pressure. We observed abnormalities of diastolic function in frailty, suggesting some overlap in echocardiographic findings. This important association between cardiac morphology/function and the frailty phenotype, observed in the present study, therefore contributes to and advances the understanding of the biologic basis of frailty.4
Frailty and DD as Predictors of Outcome
Frailty is associated with an increased risk for mortality and morbidity. A number of studies have noted high prevalence rates of frailty in HF.23
In addition, grading of LV DD is an independent predictor of exercise capacity,24,25
and of outcomes for cardiovascular disease with normal LV systolic function.26
The present findings are consistent with those of previously published work. Frailty is simple and easy to assess with regard to physical activity and condition in the busy clinical setting. More importantly, new DD in 2016 might have additional value in the prediction of cardiovascular disease. Several reports showed that the new DD 2016 grades are well correlated with LV filling pressures compared with the old 2009 grades,27,28
but there are few reports to assess the prognostic value of the new DD grades. The present study suggests that the new DD grades may predict clinical outcome. In the current study, when frailty and LV DD were considered for survival analysis, known predictors such as LV systolic function did not maintain statistical significance. This is likely because LV diastolic function becomes abnormal earlier in the elderly population, as compared with LV systolic function markers such as LVEF. Additionally, frailty and DD grade assessment have the advantages of ease of use and reproducibility.
Clinical Implications
This is the first investigation of the use of the combination of frailty and DD to predict worse outcome in an elderly population in Japan. Assessment of frailty is an easy method to evaluate the risk of cardiac events. Patients with frailty and moderate-severe DD should have an additional assessment and careful treatment including cardioprotective medication. The assessment of frailty and diastolic grading on echocardiography could be used to risk-stratify these older populations with risk factors of cardiovascular diseases. The possibility of indexing “frailty” on echocardiography may constitute a relatively simple, affordable, and reproducible technique to predict outcome in patients with HF with preserved EF.
Study Limitations
The sample size was relatively small during a shorter period, which poses a potential risk of model overfit. Because we enrolled only an elderly population with ≥1 risk factor of cardiovascular disease, the present results cannot be extrapolated to a younger population. Atrial fibrillation was also excluded in this study. Stroke volume was measured on the basis of echocardiographic parameters, which have inherent measurement variability. Finally, we did not assess an external validation cohort. According to these limitations, the present study should be considered a proof of concept, and larger prospective multicenter studies are therefore warranted.
Conclusions
Both frailty and echocardiographic DD were significantly associated with future cardiovascular events in an elderly population with ≥1 risk factor of cardiovascular disease. These simple methods might be useful to predict outcome.
Acknowledgments
The authors acknowledge Kathryn Brock, BA, for editing a version of the manuscript. We are grateful to Taiki Sakaue and Keisuke Yasuda for gathering data.
Disclosures
The authors declare no conflicts of interest.
Grants
This work was partially supported by JSPS Kakenhi Grants (no. 17K09506 to K.K. and 16H05299 & 26248050 to M.S.), Uehara Memorial Foundation, and Takeda Science Foundation to M.S.
Supplementary Files
Supplementary File 1
Figure S1.
Algorithm for estimation of grading left ventricular diastolic function.
Please find supplementary file(s);
http://dx.doi.org/10.1253/circj.CJ-18-0017
References
- 1.
Roger VL, Weston SA, Redfield MM, Hellermann-Homan JP, Killian J, Yawn BP, et al. Trends in heart failure incidence and survival in a community-based population. JAMA 2004; 292: 344–350.
- 2.
Rosamond WD, Johnson A. Trends in heart failure incidence in the community: A gathering storm. Circulation 2017; 135: 1224–1226.
- 3.
Benjamin EJ, Blaha MJ, Chiuve SE, Cushman M, Das SR, Deo R, et al. Heart disease and stroke statistics – 2017 update: A report from the American Heart Association. Circulation 2017; 135: e146–e603.
- 4.
Fedarko NS. The biology of aging and frailty. Clin Geriatr Med 2011; 27: 27–37.
- 5.
Takabayashi K, Ikuta A, Okazaki Y, Ogami M, Iwatsu K, Matsumura K, et al. Clinical characteristics and social frailty of super-elderly patients with heart failure: The Kitakawachi Clinical Background and Outcome of Heart Failure Registry. Circ J 2016; 81: 69–76.
- 6.
Kodama A, Koyama A, Sugimoto M, Niimi K, Banno H, Komori K. Association between preoperative frailty and mortality in patients with critical limb ischemia following infrainguinal bypass surgery: Usefulness of the Barthel index. Circ J 2017; 82: 267–274.
- 7.
Afilalo J, Mottillo S, Eisenberg MJ, Alexander KP, Noiseux N, Perrault LP, et al. Addition of frailty and disability to cardiac surgery risk scores identifies elderly patients at high risk of mortality or major morbidity. Circ Cardiovasc Qual Outcomes 2012; 5: 222–228.
- 8.
Gharacholou SM, Roger VL, Lennon RJ, Rihal CS, Sloan JA, Spertus JA, et al. Comparison of frail patients versus nonfrail patients >/=65 years of age undergoing percutaneous coronary intervention. Am J Cardiol 2012; 109: 1569–1575.
- 9.
Cacciatore F, Abete P, Mazzella F, Viati L, Della Morte D, D’Ambrosio D, et al. Frailty predicts long-term mortality in elderly subjects with chronic heart failure. Eur J Clin Invest 2005; 35: 723–730.
- 10.
Kusunose K, Yamada H, Nishio S, Hirata Y, Seno H, Saijo Y, et al. Echocardiographic predictors for worsening of six-minute walk distances in patients with systemic sclerosis (scleroderma). Am J Cardiol 2017; 120: 315–321.
- 11.
Yamada H, Tanaka A, Kusunose K, Amano R, Matsuhisa M, Daida H, et al. Effect of sitagliptin on the echocardiographic parameters of left ventricular diastolic function in patients with type 2 diabetes: A subgroup analysis of the PROLOGUE study. Cardiovasc Diabetol 2017; 16: 63.
- 12.
Kwon DH, Kusunose K, Obuchowski NA, Cavalcante JL, Popovic ZB, Thomas JD, et al. Predictors and prognostic impact of progressive ischemic mitral regurgitation in patients with advanced ischemic cardiomyopathy: A multimodality study. Circ Cardiovasc Imaging 2016; 9: e004577.
- 13.
Senapati A, Sperry BW, Grodin JL, Kusunose K, Thavendiranathan P, Jaber W, et al. Prognostic implication of relative regional strain ratio in cardiac amyloidosis. Heart 2016; 102: 748–754.
- 14.
Kusunose K, Yamada H. Rest and exercise echocardiography for early detection of pulmonary hypertension. J Echocardiogr 2016; 14: 2–12.
- 15.
Nagueh SF, Smiseth OA, Appleton CP, Byrd BF 3rd, Dokainish H, Edvardsen T, et al. Recommendations for the evaluation of left ventricular diastolic function by echocardiography: An update from the American Society of Echocardiography and the European Association of Cardiovascular Imaging. J Am Soc Echocardiogr 2016; 29: 277–314.
- 16.
Lang RM, Badano LP, Mor-Avi V, Afilalo J, Armstrong A, Ernande L, et al. Recommendations for cardiac chamber quantification by echocardiography in adults: An update from the American Society of Echocardiography and the European Association of Cardiovascular Imaging. J Am Soc Echocardiogr 2015; 28: 1–39.e14.
- 17.
Rudski LG, Lai WW, Afilalo J, Hua L, Handschumacher MD, Chandrasekaran K, et al. Guidelines for the echocardiographic assessment of the right heart in adults: A report from the American Society of Echocardiography endorsed by the European Association of Echocardiography, a registered branch of the European Society of Cardiology, and the Canadian Society of Echocardiography. J Am Soc Echocardiogr 2010; 23: 685–713; quiz 786–788.
- 18.
Fried LP, Tangen CM, Walston J, Newman AB, Hirsch C, Gottdiener J, et al. Frailty in older adults: Evidence for a phenotype. J Gerontol A Biol Sci Med Sci 2001; 56: M146–M156.
- 19.
DeLong ER, DeLong DM, Clarke-Pearson DL. Comparing the areas under two or more correlated receiver operating characteristic curves: A nonparametric approach. Biometrics 1988; 44: 837–845.
- 20.
Chen MA. Frailty and cardiovascular disease: Potential role of gait speed in surgical risk stratification in older adults. J Geriatr Cardiol 2015; 12: 44–56.
- 21.
Newman AB, Arnold AM, Burke GL, O’Leary DH, Manolio TA. Cardiovascular disease and mortality in older adults with small abdominal aortic aneurysms detected by ultrasonography: The cardiovascular health study. Ann Intern Med 2001; 134: 182–190.
- 22.
Leibowitz D, Jacobs JM, Stessman-Lande I, Cohen A, Gilon D, Ein-Mor E, et al. Cardiac structure and function and dependency in the oldest old. J Am Geriatr Soc 2011; 59: 1429–1434.
- 23.
Joyce E. Frailty in advanced heart failure. Heart Fail Clin 2016; 12: 363–374.
- 24.
Kusunose K, Motoki H, Popovic ZB, Thomas JD, Klein AL, Marwick TH. Independent association of left atrial function with exercise capacity in patients with preserved ejection fraction. Heart 2012; 98: 1311–1317.
- 25.
Kusunose K, Yamada H, Nishio S, Ishii A, Hirata Y, Seno H, et al. RV myocardial strain during pre-load augmentation is associated with exercise capacity in patients with chronic HF. JACC Cardiovasc Imaging 2017; 10: 1240–1249.
- 26.
Kitzman DW, Little WC. Left ventricle diastolic dysfunction and prognosis. Circulation 2012; 125: 743–745.
- 27.
Andersen OS, Smiseth OA, Dokainish H, Abudiab MM, Schutt RC, Kumar A, et al. Estimating left ventricular filling pressure by echocardiography. J Am Coll Cardiol 2017; 69: 1937–1948.
- 28.
Nagueh SF, Appleton CP, Gillebert TC, Marino PN, Oh JK, Smiseth OA, et al. Recommendations for the evaluation of left ventricular diastolic function by echocardiography. J Am Soc Echocardiogr 2009; 22: 107–133.