Abstract
Background:
Numerous studies have demonstrated a reduction in cardiovascular events when the low-density lipoprotein cholesterol (LDL) level is decreased by statin therapy. However, despite good control of LDL, cardiovascular events may increase if the triglyceride (TG) level is high. We conducted a long-term comparison of treatment of hypertriglyceridemia with ethyl icosapentate (EPA) vs. omega-3-acid ethyl (EPA+docosahexaenoic acid [DHA]).
Methods and Results:
Cardiac surgery patients with hypertriglyceridemia were randomized to an EPA group (1.8 g t.i.d.) or an EPA+DHA group (2 g s.i.d.) and observed for 3 years. The primary endpoints were the serum TG level and its percent change. Secondary endpoints included lipid markers, fatty acid parameters, serum creatinine, cystatin-C, oxidized LDL, high-sensitivity C-reactive protein, and MACCE. An interview to assess study drug adherence was conducted 6 months after completing the study. TG levels were significantly lower in the EPA+DHA group than in the EPA group. Levels of remnant-like particles-cholesterol, oxidized LDL, and cystatin-C were also significantly lower in the EPA+DHA group than in the EPA group. Compliance with treatment was significantly worse in the EPA group.
Conclusions:
Better results were obtained in the EPA+DHA group, but more patients showed poor compliance with treatment in the EPA group, making detailed comparison of the 2 groups difficult. Even so, TG were reduced while EPA and DHA levels were increased in the EPA+DHA group, together with a reduction in oxidative stress and remnant-like particles-cholesterol. Decreased compliance with medication in the EPA group significantly affected the results of this study, clearly indicating the importance of good compliance.
There is ample evidence supporting the role of statin therapy for reducing low-density lipoprotein cholesterol (LDL) in the prevention of cardiovascular disease.1–3
However, cardiovascular events still occur even when LDL is strictly controlled.4
In patients with dyslipidemia, the incidence of cardiovascular events increases when the triglyceride (TG) level is ≥200 mg/dL, despite strict control of LDL to ≤70 mg/dL.4
Accordingly, it is important to reduce the levels of both LDL and TG.
Treatment for hypertriglyceridemia is (1) fibrate drugs, (2) nicotinic acid drugs, (3) probucol and (4) polyunsaturated fatty acids. As a polyunsaturated fatty acid, ethyl icosapentate is a highly-pure EPA formulation and omega-3-acid ethyl is an EPA+docosahexaenoic acid (DHA) formulation. In Japan, EPA has been available clinically since 1999, and EPA+DHA from 2013 for clinical use. However, there are few comparative studies of these fatty acids, so we compared them for treatment of hypertriglyceridemia (the DEFAT trial).
Methods
Study Protocol
The subjects of this study were stable outpatients with untreated hypertriglyceridemia who had a serum TG level ≥150 mg/dL and who had undergone cardiac surgery at the study hospital (n=80). Stable outpatients were defined as patients in whom surgery had been performed at least 1 year before enrollment and whose oral medications had not been changed during the past year.
The age range of eligible patients was ≥20 years to <90 years. Exclusion criteria were (1) hemorrhagic disease, (2) renal dysfunction with an estimated glomerular filtration rate (eGFR) ≤20 mL/min/1.73 m2, (3) hepatic dysfunction, and (4) any other reason that made patients unsuitable for this study as judged by the attending physician. Patients were assigned to oral treatment with EPA (1.8 g t.i.d.; Epadel®, Mochida Pharmaceutical Co., Ltd, Tokyo, Japan) or EPA+DHA (2.0 g s.i.d.; Lotoliga®, Takeda Pharmaceutical Co., Ltd, Osaka, Japan) by the envelope method. The study was single-blind (i.e., the treatment assigned was not known by the investigators) and patients were observed for 3 years. Extraction of laboratory data was done by a third party that was not involved in statistical analysis. Blood sampling was conducted while fasting in the morning. The details of the study were explained to each patient and informed consent was obtained. Approval by the institutional review board was also obtained and the study was registered with the University Hospital Medical Information Network (study ID: UMIN000025227).
Endpoints
The primary endpoints were the serum TG level, the percent decrease in serum TG, and the percentage of patients who achieved a TG level ≤150 mg/dL. The secondary endpoints were: serum lipid markers (total cholesterol (T-chol), high-density lipoprotein cholesterol (HDL), LDL, LDL/HDL ratio, remnant-like particles-cholesterol (RLP-chol), lipoprotein (a) (Lp(a)), fatty acid parameters (dihydrogammalinolenic acid (DHLA), arachidonic acid (AA), EPA, DHA, EPA/AA ratio, DHA/AA ratio and EPA+DHA/AA ratio), oxidized LDL (ox-LDL), cystatin-C, blood urea nitrogen (BUN), creatinine (Cr), eGFR, cystatin-C, aspartate aminotransferase (AST), alanine aminotransferase (ALT), high-sensitivity C-reactive protein (hs-CRP), hemoglobin A1c (HbA1c), and major adverse cardiac and cerebrovascular events (MACCE). Furthermore, the relationship between changes in each fatty acid parameter and the changes in TG was investigated. The definition of MACCE was death or any of the following that required hospitalization or medical treatment: ischemic heart disease, cerebrovascular disease, heart failure, or arrhythmia.
At each monthly visit, patients received compliance instructions from the attending doctor and it was verbally confirmed that medications were being taken in an appropriate manner. All patients were interviewed within 6 months of completion of the study. During the interview, patients rated their compliance with study treatment on a 5-point Likert scale:5
(1) took all medication appropriately, (2) sometimes failed to take medication, (3) often failed to take medication, (4) sometimes took medication, and (5) did not take any medication. Patients who selected option (1) or (2) were classified as having good compliance, while those selecting option (3), (4) or (5) were classified as having poor compliance.
To assess safety, serious adverse events were defined as events resulting in death, events that were life-threatening, events requiring hospitalization for treatment, and events causing permanent or significant disability or functional impairment. All events that occurred during the study were reviewed and classified by the event adjudication committee.
The blood tests were performed before the start of treatment as well as after 6 months, 1 year, 2 years and 3 years of treatment. Adverse reactions were classified as renal dysfunction (increase in Cr by ≥50%), hepatic dysfunction (increase in AST/ALT by ≥50%), bleeding events, and allergic reactions. Management of the reactions was decided by the attending physician. The patients were managed without increasing statins or adding TG treatment drugs.
Statistical Analysis
The mean±standard deviation was calculated for continuous variables. For comparison of the changes in laboratory values between EPA and EPA+DHA groups over time (before treatment vs. 6 months, 1 year, 2 years, and 3 years), repeated measures ANOVA was used. The influence of interaction (treatment group×time) was also evaluated. Comparison of data between the 2 study groups was conducted with the unpaired t-test, while between-group comparisons over time were performed by the paired t-test. Adjustment for multiplicity was done with Bonferroni’s correction (two-sided). To investigate the relationship between changes in TG and fatty acid parameters, linear regression analysis was conducted using the change on TG as a dependent variable. In addition to analysis of the whole patient population, the relationship between changes in TG and fatty acid parameters was investigated in each treatment group. The MACCE-free rate was determined by the Kaplan-Meier method and differences between groups were assessed for significance with the log-rank test. Compliance with treatment was compared by the chi-square test. SPSS Statistics version 23.0 (IBM Japan, Ltd., Tokyo, Japan) was used for all analyses and statistical significance was accepted at P<0.05. Statistical analysis was conducted by SATISTA (Kyoto, Japan), a company not involved in the conduct of this study.
Results
It was planned to enroll 80 patients inn this study, and 87 patients were actually registered. Endpoints were measured in all 87 patients and they were all followed for 3 years.
Of the 87 patients recruited, none refused to take part in this study and they all continued the study after registration, with 43 being assigned to the EPA group and 44 to the EPA+DHA group. Baseline characteristics of the 2 groups are shown in
Table 1, revealing that the demographic profiles were well balanced (Figure 1).
Table 1.
Patients’ Characteristics
| |
EPA group |
EPA+DHA group |
| n |
43 |
44 |
| Age (years) |
68.5±9.6 |
69.4±11.2 |
| Sex (male:female) |
29:14 |
30:14 |
| Basic disease |
| Ischemic heart disease |
17 (39%) |
20 (45%) |
| Valvular disease |
14 (33%) |
15 (34%) |
| Aortic disease |
10 (23%) |
7 (16%) |
| Other |
2 (5%) |
2 (5%) |
| Risk factors |
| Diabetes mellitus |
21 (48%) |
20 (45%) |
| Hypertension |
38 (88%) |
41 (95%) |
| Dyslipidemia |
43 (100%) |
44 (100%) |
| Hyperuricemia |
27 (62%) |
23 (52%) |
| Chronic kidney disease |
20 (46%) |
22 (50%) |
| Medications |
| ACEI |
1 (2%) |
3 (6%) |
| Aldosterone blocker |
20 (46%) |
19 (43%) |
| ARB |
26 (60%) |
25 (56%) |
| β-blocker |
24 (55%) |
30 (68%) |
| Calcium antagonist |
25 (58%) |
23 (52%) |
| Renin inhibitor |
5 (11%) |
2 (4%) |
| Statin |
43 (100%) |
44 (100%) |
| Atrovastatin |
25 (58%) |
29 (65%) |
| Fluvastatin |
1 (2%) |
0 (0%) |
| Rosuvastatin |
17 (39%) |
15 (34%) |
| Febuxostat |
21 (48%) |
21 (47%) |
| Toxpiroxostat |
6 (13%) |
2 (4%) |
ACEI, angiotensin-converting enzyme inhibitor; ARB, angiotensin II receptor blocker; DHA, docosahexaenoic acid; EPA, ethyl icosapentate.
TG (Figure 2)
There was no significant difference in TG between the 2 groups before the start of treatment (P=0.958), but the TG level was significantly lower in the EPA+DHA group than in the EPA group at 2 and 3 years after starting administration (2 years: P=0.045; 3 years: P=0.004). In both groups, the TG level after treatment was significantly lower than before treatment (EPA group; P<0.0001, EPA+DHA group; P<0.0001).
Change in TG (Figure 2)
After 2 and 3 years, the percent decrease in TG was significantly larger in the EPA+DHA group compared with the EPA group (2 years: P=0.032; 3 years: P=0.005). In addition, the rate of achieving a TG level ≤150 mg/dL was significantly higher in the EPA+DHA group than in the EPA group after both 2 and 3 years (2 years: P=0.030; 3 years: P=0.0085).
Secondary Endpoint: Lipid Markers (Table 2)
T-chol
There was no significant difference in T-chol between the 2 groups either before or after treatment (pre: P=0.478, 6 months: P=0.244, 1 year: P=0.175, 2 years: P=0.364, 3 years: P=0.584). For intra-group comparison, the EPA group was significantly deceased before treatment vs. 6 months and 2 years after treatment, the EPA+DHA group was associated with a significant decrease before treatment vs. 6 month, 2 years, and 3 years after treatment (EPA group: 6 months (P=0.001), 2 years (P=0.021), EPA+DHA group: 6 months (P=0.011), 2 years (P=0.044), 3 years (P=0.043).
Table 2.
Changes in Each Blood Test
| |
Pre |
6 months |
1 year |
2 years |
3 years |
| T-chol (mg/dL) |
| EPA group |
175.4±28.8 |
163.7±28.2# |
168.6±29.2 |
166.3±28.8# |
168.7±26.7 |
| EPA+DHA group |
179.1±19.3 |
170.7±27.4# |
177.8±33.2 |
172.0±28.9# |
172.1±29.5# |
| HDL (mg/dL) |
| EPA group |
55.6±16.6 |
56.2±16.4 |
55.1±14.4 |
56.0±15.1 |
57.9±16.7 |
| EPA+DHA group |
55.6±15.6 |
57.1±15.5 |
58.6±18.3# |
59.6±16.4# |
63.0±15.6# |
| LDL (mg/dL) |
| EPA group |
92.7±20.4 |
88.5±20.0 |
93.1±17.8 |
91.6±22.2 |
89.6±17.9 |
| EPA+DHA group |
100.2±23.7 |
92.8±23.0# |
96.6±24.8 |
94.4±23.2 |
92.0±22.4# |
| LDL/HDL |
| EPA group |
1.78±0.56 |
1.69±0.53 |
1.78±0.52 |
1.75±0.66 |
1.67±0.54 |
| EPA+DHA group |
1.97±0.79 |
1.75±0.64# |
1.81±0.72# |
1.72±0.68# |
1.56±0.60# |
| Lp(a) (mg/dL) |
| EPA group |
26.7±33.4 |
27.1±34.5 |
27.7±34.2 |
27.8±33.3 |
27.3±34.4 |
| EPA+DHA group |
28.3±32.1 |
26.3±29.3# |
26.3±28.8# |
27.1±29.4 |
26.5±29.9# |
| hs-CRP (mg/dL) |
| EPA group |
0.12±0.22 |
0.20±0.39# |
0.18±0.31# |
0.19±0.47 |
0.21±0.51# |
| EPA+DHA group |
0.14±0.20 |
0.12±0.13 |
0.11±0.11 |
0.13±0.14 |
0.13±0.13 |
| DHLA (μg/mL) |
| EPA group |
42.7±18.8 |
34.8±9.4*,# |
34.6±9.8# |
33.9±10.6*,# |
34.9±11.6*,# |
| EPA+DHA group |
41.3±9.4 |
30.5±9.5*,# |
30.9±10.3# |
27.7±8.9*,# |
28.5±9.5*,# |
| AA (μg/mL) |
| EPA group |
192.8±46.8 |
181.7±47.5 |
179.0±41.3# |
181.4±47.8# |
177.9±51.0# |
| EPA+DHA group |
195.9±62.3 |
174.7±44.3# |
170.0±48.4# |
168.2±48.5# |
170.6±48.0# |
| EPA (μg/mL) |
| EPA group |
62.8±37.8 |
135.4±51.9# |
136.6±46.1# |
143.3±48.6# |
143.9±55.4# |
| EPA+DHA group |
62.5±27.5 |
138.8±57.6# |
148.4±57.3# |
148.1±66.1# |
149.5±58.8# |
| DHA (μg/mL) |
| EPA group |
133.3±46.6 |
138.5±46.5* |
131.0±45.0* |
128.0±43.1* |
131.6±47.0* |
| EPA+DHA group |
129.7±32.1 |
166.1±44.9*,# |
168.1±45.1*,# |
158.0±34.6*,# |
161.4±37.6*,# |
*P<0.05, EPA vs. EPA+DHA group; #P<0.05, pre vs. 6 months, 1 year, 2 years, 3 years. AA, arachidonic acid; DHLA, dihydrogammalinolenic acid; HDL, high-density lipoprotein; hs-CRP, high-sensitivity C-reactive protein; LDL, low-density lipoprotein; Lp(a), lipoprotein (a); T-chol, total cholesterol. Other abbreviations as in Table 1.
HDL
There was no significant difference in HDL between the 2 groups either before or after treatment (pre: P=0.998, 6 months: P=0.783, 1 year: P=0.324, 2 years: P=0.293, 3 years: P=0.141). For intra-group comparison, although there was no significant difference between before and after treatment in the EPA group, there was a significant increase before treatment vs. 1year, 2 years, and 3 years after treatment in the EPA+DHA group (EPA+DHA group: 1 year (P=0.014), 2 years (P=0.003), 3 years (P<0.001)).
LDL
There was no significant difference in LDL between the 2 groups either before or after treatment (pre: P=0.121, 6 months: P=0.358, 1 year: P=0.454, 2 years: P=0.561, 3 years: P=0.585). For intra-group comparison, although there was no significant difference between before and after treatment in the EPA group, there was a significant decrease before treatment vs. 6 months and 3 years after treatment in the EPA+DHA group (EPA+DHA group: 6 months (P=0.007), 3 years (P=0.009)).
LDL/HDL Ratio
There was no significant difference in the LDL/HDL ratio between the 2 groups either before or after treatment (pre: P=0.198, 6 months: P=0.633, 1 year: P=0.831, 2 years: P=0.791, 3 years: P=0.396). For intra-group comparison, although there was no significant difference between before and after treatment in the EPA group, there was a significant difference before treatment vs. after treatment (EPA+DHA group: 6 months (P<0.001), 1 year (P=0.001), 2 years (P<0.001), 3 years (P<0.001)).
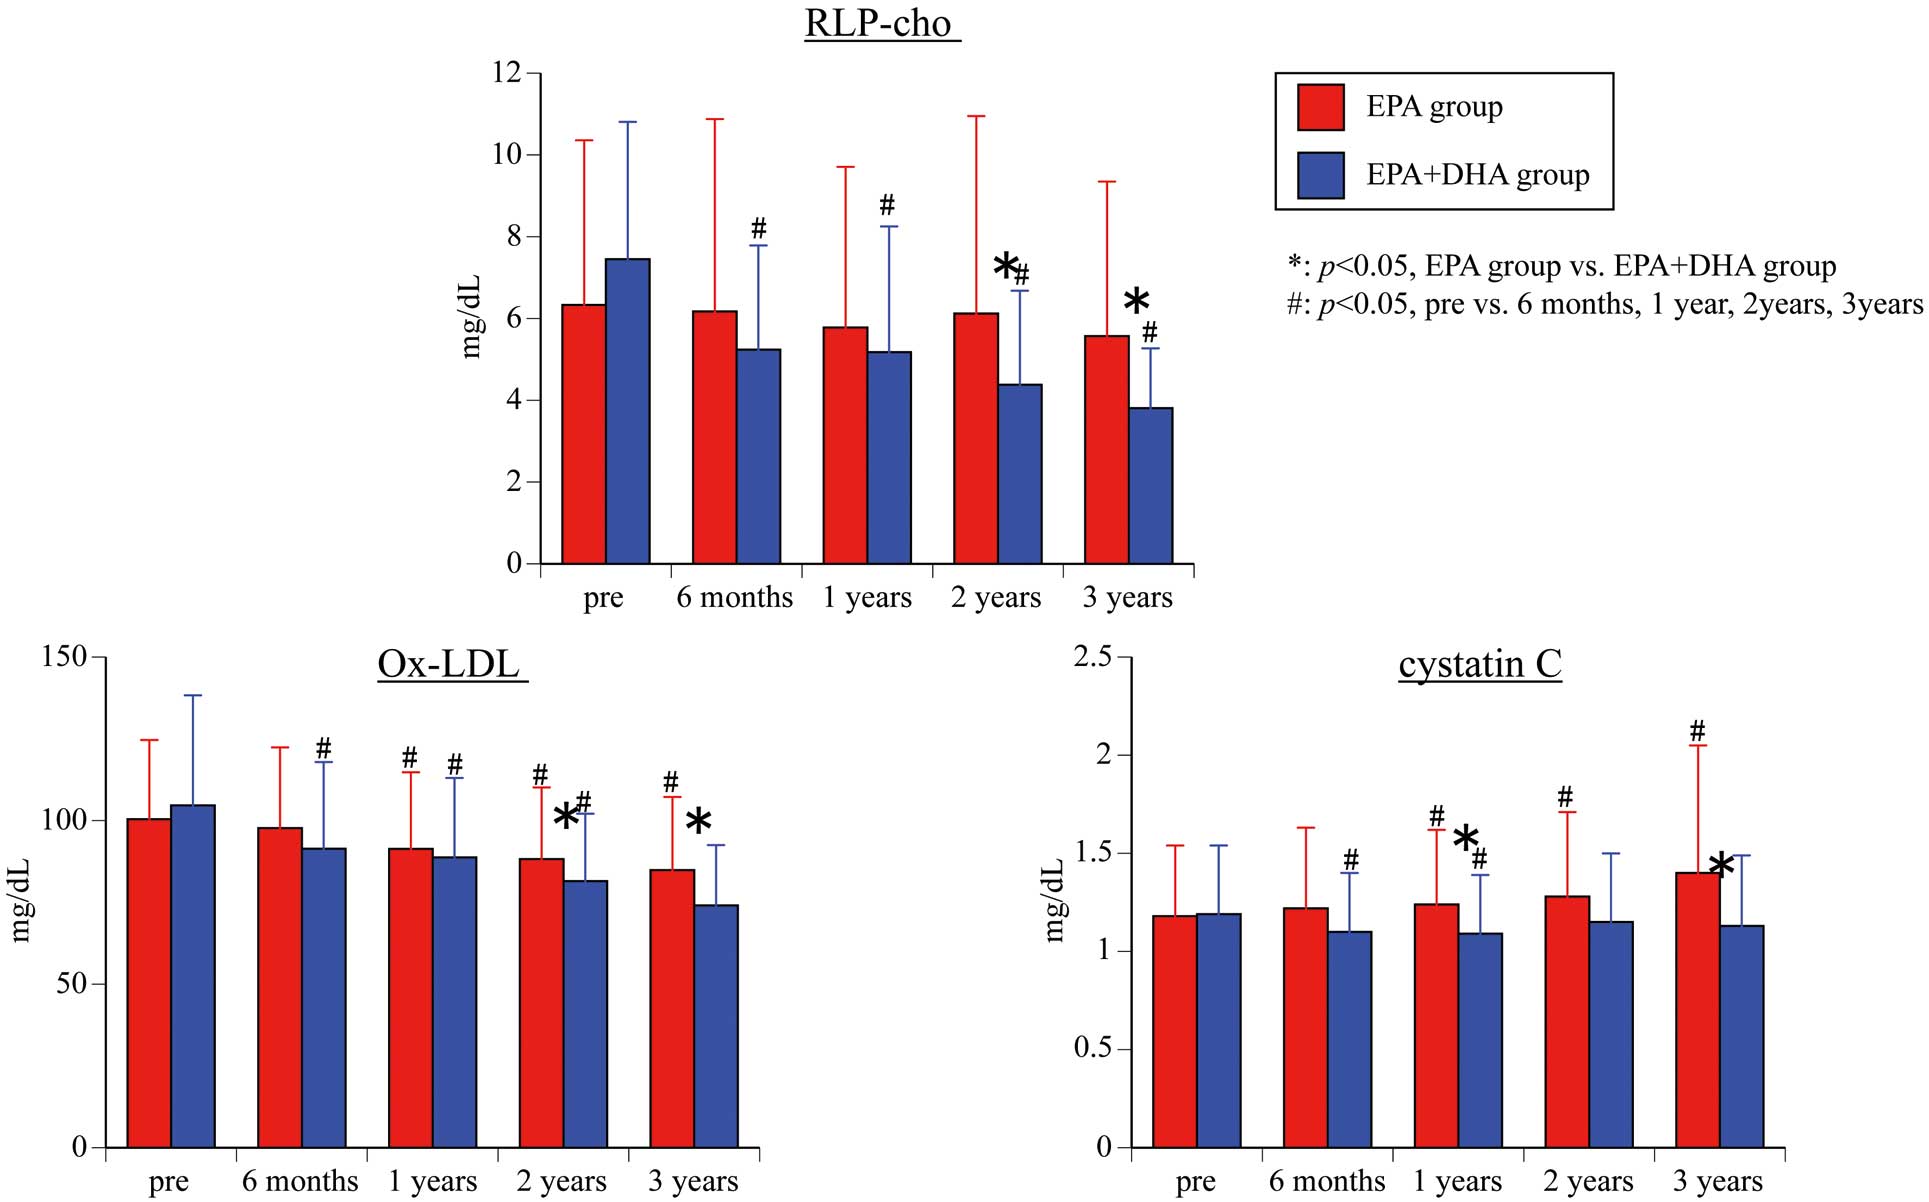
RLP-chol (Figure 3)
There was no significant difference in RLP-chol between the 2 groups before the start of treatment (P=0.160), but the RLP-chol level was significantly lower in the EPA+DHA group than in the EPA group at 2 and 3 years after starting administration (2 years: P=0.034; 3 years: P=0.005). For intra-group comparison, although there was no significant difference between before and after treatment in the EPA group, there was a significant difference before treatment vs. after treatment (EPA+DHA group: 6 months (P<0.001), 1 year (P<0.001), 2 years (P<0.001), 3 years (P<0.001)).
Lp(a) (Table 2)
There was no significant difference in Lp(a) between the 2 groups either before or after treatment (pre: P=0.828, 6 months: P=0.900, 1 year: P=0.831, 2 years: P=0.915, 3 years: P=0.910). For intra-group comparison, although there was no significant difference between before and after treatment in the EPA group, there was a significant difference before treatment vs. 6 months, 1 year, and 3 years after treatment in the EPA+DHA group (EPA+DHA group: 6 months (P=0.034), 1 years (P=0.045), 3 years (P=0.049)).
Secondary Endpoint: Fatty Acid Parameters (Tables 2,3; Figure 4)
DHLA
There was no significant difference in DHLA between the 2 groups before the start of treatment (P=0.659), but the DHLA level was significantly lower in the EPA+DHA group than in the EPA group on 6 months, 2 and 3 years after starting administration (6 months: P=0.039, 2 years: P=0.004, 3 years: P=0.006). For intra-group comparison, both groups showed a significant difference before and after treatment (EPA group: 6 months (P=0.002), 1 years (P=0.002), 2 years (P=0.001), 3 years (P=0.004). EPA+DHA group: 6 months (P<0.001), 1 years (P<0.001), 2 years (P<0.001), 3 years (P<0.001)).
Table 3.
Influence of Each Fatty Acid Parameter on the Change in TG in Year 3
| |
B |
SE |
β |
P value |
| All patients (n=87) |
| AA |
0.54 |
0.27 |
0.212 |
0.047 |
| EPA |
−0.70 |
0.10 |
−0.587 |
<0.001 |
| DHA |
−0.81 |
0.27 |
−0.313 |
0.003 |
| EPA+DHA |
−0.51 |
0.08 |
−0.558 |
<0.001 |
| EPA/AA |
−99.33 |
15.94 |
−0.558 |
<0.001 |
| DHA/AA |
−145.11 |
37.56 |
−0.385 |
<0.001 |
| EPA+DHA/AA |
−67.92 |
11.69 |
−0.531 |
<0.001 |
| EPA group (n=43) |
| AA |
0.09 |
0.40 |
0.037 |
0.813 |
| EPA |
−0.43 |
0.16 |
−0.383 |
0.010 |
| DHA |
−0.18 |
0.43 |
−0.064 |
0.678 |
| EPA+DHA |
−0.33 |
0.14 |
−0.343 |
0.023 |
| EPA/AA |
−52.57 |
25.13 |
−0.307 |
0.043 |
| DHA/AA |
−26.51 |
69.34 |
−0.059 |
0.704 |
| EPA+DHA/AA |
−35.33 |
20.18 |
−0.261 |
0.087 |
| EPA+DHA group (n=44) |
| AA |
0.82 |
0.37 |
0.325 |
0.030 |
| EPA |
−0.91 |
0.13 |
−0.734 |
<0.001 |
| DHA |
−1.14 |
0.34 |
−0.457 |
0.002 |
| EPA+DHA |
−0.61 |
0.10 |
−0.690 |
<0.001 |
| EPA/AA |
−134.11 |
19.01 |
−0.732 |
<0.001 |
| DHA/AA |
−190.50 |
43.95 |
−0.551 |
<0.001 |
| EPA+DHA/AA |
−85.58 |
13.61 |
−0.692 |
<0.001 |
AA, arachidonic acid; B, regression coefficient; β, standardized partial regression coefficient; SE, standard error of coefficient. Other abbreviations as in Tables 1,2.

AA
There was no significant difference in AA between the 2 groups either before or after treatment (pre: P=0.791, 6 months: P=0.480, 1 year: P=0.355, 2 years: P=0.205, 3 years: P=0.492). For intra-group comparison, EPA group was significantly deceased before treatment vs. 1 year, 2 years, and 3 years after treatment (1 years (P=0.020), 2 years (P=0.043), 3 years (P=0.018)), whereas the EPA+DHA group was associated with a significant decreased before treatment vs. after treatment (all time points P<0.001).
EPA
There was no significant difference in EPA between the 2 groups either before or after treatment (pre: P=0.973, 6 months: P=0.777, 1 year: P=0.294, 2 years: P=0.699, 3 years: P=0.647). For intra-group comparison, both groups were significantly increased before and after treatment (all time points P<0.001).
DHA
There was no significant difference in DHA between the 2 groups before the start of treatment (P=0.676), but the DHA level was significantly higher in the EPA+DHA group than in the EPA group after treatment (6 months: P=0.006, 1 year: P<0.001, 2 years: P=0.001; 3 years: P=0.011). For intra-group comparison, although there was no significant difference between before and after treatment in the EPA group (6 months: P=0.319, 1 year: P=0.686, 2 years: P=0.335; 3 years: P=0.458), there was a significantly increase before treatment vs. after treatment in the EPA+DHA group (all time points P<0.001).
EPA/AA
There was no significant difference in the EPA/AA ratio between the 2 groups either before or after treatment (pre: P=0.848, 6 months: P=0.732, 1 year: P=0.111, 2 years: P=0.422, 3 years: P=0.460). For intra-group comparison, both groups were significantly higher before and after treatment (all time points P<0.001).
DHA/AA
There was no significant difference in the DHA/AA ratio between the 2 groups before the start of treatment (P=0.933), but the DHA/AA level was significantly higher in the EPA+DHA group than in the EPA group after treatment (6 months: P=0.013, 1 year: P<0.001, 2 years: P<0.001; 3 years: P=0.011). For intra-group comparison, although there was no significant difference between before and after treatment in the EPA group (6 months: P=0.117, 1 year: P=0.139, 2 years: P=0.246; 3 years: P=0.104), it was significantly higher before treatment vs. after treatment in the EPA+DHA group (all time points P<0.001).
EPA+DHA/AA
There was no significant difference in the EPA+DHA/AA ratio between the 2 groups before the start of treatment (P=0.933), but the EPA+DHA/AA level was significantly higher in the EPA+DHA group than in the EPA group after treatment at 1, 2 and 3 years after starting administration (1 year: P=0.004, 2 years: P=0.037; 3 years: P=0.044). For intra-group comparison, both groups were significantly decreased before and after treatment (all time points P<0.001).
Changes in Each Fatty Acid Parameter vs. Change in TG
In the entire patient population, changes in EPA were most strongly correlated with changes in TG, followed by changes in EPA+DHA. Correlations between a change in TG and changes in each fatty acid parameter were stronger in the EPA+DHA group than in the EPA group.
Secondary Endpoint: ox-LDL (Figure 3)
There was no significant difference in ox-LDL between the 2 groups before the start of treatment (P=0.502), but the ox-LDL level was significantly lower in the EPA+DHA group than in the EPA group at 2 and 3 years after starting administration (2 years: P=0.045; 3 years: P=0.015). For intra-group comparison, the EPA group was significantly deceased before treatment vs. 1 year, 2 years, and 3 years after treatment (1 year: P=0.013; 2 years: P=0.005; 3 years: P=0.015), whereas the EPA+DHA group was associated with a significant decrease before treatment vs. after treatment (all time points P<0.001).
Secondary Endpoint: Cystatin-C (Figure 3)
There was no significant difference in cystatin-C between the 2 groups before the start of treatment (P=0.940), but the cystatin-C level was significantly lower in the EPA+DHA group than in the EPA group at 1 and 3 years after starting administration (1 year: P=0.019; 3 years: P=0.049). For intra-group comparison, the EPA group was significantly increased before treatment vs. 1 year, 2 years, and 3 years after treatment (1 year: P=0.049; 2 years: P=0.001; 3 years: P=0.024), whereas the EPA+DHA group was associated with a significant decrease before treatment vs. 6 months and 1 year after treatment (6 months: P=0.001; 1 year: P=0.001).
Secondary Endpoint: hs-CRP (Table 2)
There was no significant difference in hs-CRP between the 2 groups either before or after treatment (pre: P=0.628, 6 months: P=0.200, 1 year: P=0.166, 2 years: P=0.417, 3 years: P=0.329). For intra-group comparison, the EPA group was significantly increased before treatment vs. 6 months, 1 year, and 3 years after treatment (6 months: P=0.034; 1 year: P=0.023; 3 years: P=0.033), but there was no significant difference between before and after treatment in the EPA+DHA group.
Secondary Endpoint: Other Blood Tests
There were no differences in BUN, Cr, eGFR, AST, ALT, and HbA1c between the 2 groups before or after treatment.
Secondary Endpoint: MACCE
Adverse events occurred in 4 patients (arrhythmia in 2 patients, heart failure and cerebral infarction in 1 patient each) in the EPA group and in 1 patient (heart failure) in the EPA+DHA group. There were no deaths. Among the 5 patients with MACCE, the 2 who developed arrhythmias did not require hospitalization and improved following administration of anti-arrhythmic agents. There were also 2 patients with NYHA class II chronic heart failure who were admitted to hospital for exacerbation of heart failure. After admission and adjustment of medications, both patients improved rapidly. The patient with cerebral infarct had underlying atrial fibrillation, and it was considered that warfarin was not in the therapeutic range when the stroke occurred. After 2 weeks of conservative treatment, the patient was discharged with no sequelae. In all patients, treatment with EPA or EPA+DHA was continued. All events were judged to be unrelated to the study drugs by the event adjudication committee. The MACCE-free rate was 95.3±3.2% at 1 year, 90.7±4.4% at 2 years, and 90.7±4.4% at 3 years in the EPA group; 100% at 1 year, 100% at 2 years, and 97.7±2.2% at 3 years in the EPA+DHA group. There was no significant difference between groups (P=0.155).
Compliance With Treatment
In the EPA group, the answer was (1) (took all medication) for 17 patients (39.5%), 2) (sometimes failed to take medication) for 20 patients (46.5%), and 3) (only took medication sometimes) for 6 patients (14.0%). In the EPA+DHA group, the answer was (1) for 39 patients (88.6%) and (2) for 5 patients (11.4%). There was a significant difference in compliance between the 2 groups (P<0.0001). In the EPA group, 37 patients (86%) showed good compliance and 6 patients (14%) had poor compliance. In contrast, all 44 patients (100%) displayed good compliance in the EPA+DHA group and there were no patients (0%) with poor compliance. The compliance rate was significantly higher in the EPA+DHA group than in the EPA group (P=0.012).
Discussion
This study revealed a significant decrease in TG, RLP-chol, ox-LDL, and cystatin-C in the EPA+DHA group compared with the EPA group, while the DHA/AA and EPA+DHA/AA ratios were increased. Thus, treatment with EPA+DHA was significantly better than treatment with EPA alone in this long-term (3-year) study. Additionally, there were no cardiovascular events and good safety was demonstrated. The EPA group was treated with 1.8 g of Epadel®
containing 1.8 g of EPA, while the EPA+DHA group received 2 g of Lotliga®
containing 0.93 g of EPA and 0.75 g of DHA. If patients took these medications correctly, the blood EPA concentration should have been higher in the EPA group, but we found that it was similar in both groups. In previous clinical studies of treatment with Epadel®
or Lotliga®
for 3 months, the reduction in TG by both drugs was reported to be similar.6,7
After analysis of the data following completion of this study, it was considered that there might have been issues regarding compliance with treatment. Therefore, the subjects were interviewed to investigate compliance and it was found to be significantly lower in the EPA group than in the EPA+DHA group. However, because the interview was conducted after completion of the 3-year study, it was unclear exactly when compliance declined in the EPA group. This difference in compliance was considered to have occurred because Lotliga®
was administered once daily, whereas Epadel®
was taken three times daily. Our findings emphasize the importance of good compliance with treatment, but also suggest some difficulty with making detailed comparisons between the EPA and EPA+DHA groups. Despite this limitation, we found a significant decrease in TG in the EPA+DHA group (which showed good compliance), as well as significant decreases in AA, RLP-chol, and ox-LDL, while the EPA and DHA levels were increased. We also demonstrated significant decreases in cystatin-C, LDL, and the LDL/HDL ratio in the EPA+DHA group, while HDL showed an increase. These findings have not been reported before. Results obtained in the EPA group (which had compliance issues) were inferior to those for the EPA+DHA group. However, EPA was increased and TG showed a significant decrease in the EPA group, together with significant decreases in AA, RLP-chol, and ox-LDL.
Many studies have shown that treatment with EPA and DHA can reduce TG, and the present results were consistent with such reports. However, the effects of EPA and DHA treatment on HDL and LDL have varied in previous studies.8
There have been reports that treatment with EPA, EPA+DHA, or DHA does not increase HDL,9,10
but other authors have found elevation of HDL.10,11
LDL was reported to be increased or to show no change after treatment with EPA or EPA+DHA.9
On the other hand, Yusof et al found that treatment with EPA+DHA decreased both HDL and LDL,12
and a subanalysis of the JELIS study revealed a decrease in LDL with EPA treatment but no change in HDL.13
Thus, there is no consensus about the effects of EPA and DHA treatment on LDL or HDL. Many of the previous studies only involved several weeks or months of treatment and did not assess long-term effects. In this study, there was no difference after 6 months vs. baseline in patients without an increase in statin dose or the addition of medication targeting TG. However, the EPA+DHA group demonstrated an increase in HDL after 1 year and a decrease in LDL was only seen after 3 years. Moreover, RLP-chol showed a significant decrease after 6 months vs. baseline in the EPA+DHA group and was significantly decreased vs. the EPA group at 2 years. Tatsuno et al compared Epadel®
to Lotliga®
and reported that there was a greater decrease of small dense LDL with Epadel®, whereas Lotliga®
indirectly caused an increase in LDL particle size rather than a decrease in TG and was suggested to produce a favorable change in LDL particle size.14
Because there was no difference in the EPA level between the 2 groups in the present study, HDL might have been increased and LDL decreased by DHA. Despite a similar EPA concentration, TG was significantly lower in the EPA+DHA group than in the EPA group, which might have resulted in an increase in HDL and a decrease in LDL. In future studies, investigation of the EPA and DHA concentrations should be performed, together with detailed assessment of HDL and LDL as well as LDL particle size.
The JELIS study investigated EPA therapy in Japanese subjects, and showed that the mean EPA/AA ratio increased to 1.23 after treatment vs. 0.6 before treatment.13
All patients received statins in the present study, but the mean value was very low (0.3). After treatment with EPA or EPA+DHA, the mean value increased to 0.8 on average in both groups. Domei et al investigated the relationship between the EPA/AA and DHA/AA ratios before percutaneous coronary intervention and the incidence of major adverse cardiac events after intervention. They reported that a high EPA/AA ratio was associated with a lower incidence of cardiac events, but the DHA/AA ratio was unrelated to events.15
There have been many reports about the EPA/AA ratio, but reports about the DHA /AA and EPA+DHA/AA ratios are infrequent. Takahashi et al reported that the DHA/AA ratio was 0.91±0.3 in patients with a history of myocardial infarction and 0.96±0.4 in patients without infarction, being significantly higher in the former, but there was no difference in the EPA/AA ratio.16
In the present study, the DHA/AA ratio was 0.72 and the EPA+DHA/AA ratio was 1.05 before treatment. After treatment, the DHA/AA ratio did not change in the EPA group, but its mean value increased by 1.0 in the EPA+DHA group. Also, the mean value of the EPA+DHA/AA ratio increased to 1.57–1.68 in the EPA group and to 1.82–1.96 in the EPA+DHA group after treatment. It is apparent that administration of DHA increased the DHA/AA and EPA+DHA/AA ratios, but it is necessary to identify abnormal values of these parameters and investigate target levels in the future. We also investigated the relationship between changes in TG and changes in the fatty acid parameters. The EPA group received 1.8 g of EPA daily, while the EPA+DHA group received 0.93 g of EPA and 0.75 g of DHA daily. In the overall analysis, changes in EPA were most strongly correlated with changes in TG (β: −0.587), closely followed by changes in EPA+DHA (β: −0.558). When each group was assessed, correlations between the changes in TG and the changes in all fatty acid parameters were found in the EPA+DHA group. Furthermore, the β value was higher for changes in EPA+DHA in the EPA+DHA group than for changes in EPA in the EPA group (β: −0.690 vs. −0.383). Because a stronger correlation was observed in the EPA+DHA group, the data suggested that EPA+DHA reduced TG more effectively than EPA alone. It has already been reported that EPA is useful for reducing TG levels, and this study demonstrated that EPA+DHA is also effective.
In this study, ox-LDL and RLP-chol were measured. Both parameters showed a significant decrease in the EPA+DHA group compared with baseline, and were also significantly lower compared with the EPA group after 2 and 3 years. Although ox-LDL also decreased significantly in the EPA group, RLP-chol was unchanged. These results suggested that DHA inhibits oxidative stress more strongly than EPA and may be more effective for preventing arteriosclerosis.
The results of this study emphasized the importance of good compliance with treatment. Compliance was significantly better in the EPA+DHA group than in the EPA group and this was reflected in the study outcomes. Administration of the study drug was once daily in the EPA+DHA group vs. three times daily in the EPA group, which presumably led to the difference in compliance. According to a subanalysis of the JELIS study using EPA, 33% of patients had a treatment adherence rate of less than 80%, and secondary prevention was better in patients with an adherence rate ≥80% than in those with a rate <80%. Risk factors for poor adherence were age ≥60 years, current smoker, ischemic heart disease, diabetes mellitus, hypertension and multiple medications.17
A meta-analysis of studies on statin therapy showed poor adherence in female patients, as well as by patients with a low income and those aged ≤50 years or ≥70 years. Moreover, the adherence rate was lower among patients receiving primary prevention than among patients treated for secondary prevention. In general, the adherence rate decreases as the number of daily doses increases.18,19
The subjects of the present study were cardiac surgery patients who were conscious of disease prevention, so the adherence rate was relatively good. However, the importance of a lower dosing frequency was still demonstrated in this population. Moreover, our results suggested that more emphasis on compliance education may be required because DHA+EPA or EPA is administered for secondary prevention. Adherence is defined as patients understanding the necessity for medications based on explanations provided by healthcare professionals and voluntarily taking their medications. On the other hand, compliance is defined as taking medications according to the instructions of a healthcare professional (http://whqlibdoc.who.int/publications/2003/9241545992.pdf). In the present study, we explained the importance of the medications to the patients before and during the treatment period and confirmed whether compliance was appropriate. However, patients in the EPA group still showed relatively poor compliance compared with those in the EPA+DHA group. This suggests that the explanation provided by the healthcare professional was not sufficient to maintain good compliance in the EPA group and emphasizes the importance of compliance education. In addition, the compliance status should be verified by counting unused tablets rather than by interview.
Study Limitations
Because of the difference in compliance, it was somewhat difficult to directly compare the DHA+EPA and EPA groups. Patients were interviewed to investigate the level of compliance with medications after the study had been completed and the data had been analyzed. Consequently, there is a possibility of bias with regard to recall of compliance and such assessment should have been conducted during the study period. Because compliance with medication was assessed after completion of the study, it was also unclear exactly when compliance decreased during the treatment period. Because of the apparent influence of compliance on the present results, we plan to conduct a subanalysis of patients with good compliance.
In addition, the sample size was small. To confirm our findings, a larger cohort with hypertriglyceridemia should be investigated based on a similar study design.
Conclusion
We compared EPA+DHA with EPA for the treatment of hypertriglyceridemia by monitoring biomarkers such as fatty acids, lipids, and oxidative stress parameters. The results indicated that EPA+DHA was superior to EPA, but adherence to treatment was worse in the EPA group, making accurate comparison between the 2 groups somewhat difficult. However, treatment with EPA+DHA decreased TG levels, as well as reducing oxidative stress and RLP-chol.
The lower compliance rate of the EPA group had a significant influence on the study results, emphasizing the importance of compliance education.
Conflict of Interest Statement
None of the authors have any conflicts of interest associated with this study.
Financial Support
There are no relationships with industry.
References
- 1.
Stone NJ, Robinson JG, Lichtenstein AH, Bairey Merz CN, Blum CB, Eckel RH, et al. 2013 ACC/AHA guideline on the treatment of blood cholesterol to reduce atherosclerotic cardiovascular risk in adults: A report of the American College of Cardiology/American Heart Association Task Force on Practice Guidelines. J Am Coll Cardiol 2014; 63: 2889–2934.
- 2.
Piepoli MF, Hoes AW, Agewall S, Albus C, Brotons C, Catapano AL, et al. 2016 European guidelines on cardiovascular disease prevention in clinical practice: The sixth joint task force of the European society of cardiology and other societies on cardiovascular disease prevention in clinical practice (constituted by representatives of 10 societies and by invited experts) developed with the special contribution of the European Association for Cardiovascular Prevention & Rehabilitation (EACPR). Eur Heart J 2016; 37: 2315–2381.
- 3.
JCS Joint Working Group. Guidelines for secondary prevention of myocardial infarction (JCS 2011): Digest version. Circ J 2013; 77: 231–248.
- 4.
Miller M, Cannon CP, Murphy SA, Qin J, Ray KK, Braunwald E; PROVE IT-TIMI 22 Investigators. Impact of triglyceride levels beyond low-density lipoprotein cholesterol after acute coronary syndrome in the PROVE IT-TIMI 22 trial. J Am Coll Cardiol 2008; 51: 724–730.
- 5.
Likert R. A technique for the measurement of attitudes. Arch Psychol 1932; 22: 5–55.
- 6.
Tatsuno I, Saito Y, Kudou K, Ootake J. Efficacy and safety of TAK-085 compared with eicosapentaenoic acid in Japanese subjects with hypertriglyceridemia undergoing lifestyle modification: The Omega-3 fatty acids Randomized Double-blind (ORD) study. J Clin Lipidol 2013; 7: 199–207.
- 7.
Tatsuno I, Saito Y, Kudou K, Ootake J. Long-term safety and efficacy of TAK-085 in Japanese subjects with hypertriglyceridemia undergoing lifestyle modification: The Omega-3 fatty acids Randomized Long-term (ORL) study. J Clin Lipidol 2013; 7: 615–625.
- 8.
Wei MY, Jacobson TA. Effects of eicosapentaenoic acid versus docosahexaenoic acid on serum lipids: A systematic review and meta-analysis. Curr Atheroscler Rep 2011; 13: 474–483.
- 9.
Harris WS. n-3 fatty acids and serum lipoproteins: Human studies. Am J Clin Nutr 1997; 65(Suppl): 1645S–1654S.
- 10.
Stalenhoef AF, de Graaf J, Wittekoek ME, Bredie SJ, Demacker PN, Kastelein JJ. The effect of concentrated n-3 fatty acids versus gemfibrozil on plasma lipoproteins, low density lipoprotein heterogeneity and oxidizabilly in patients with hypertriglyceridemia. Atherosclerosis 2000; 153: 129–138.
- 11.
Harris WS, Ginsberg HN, Arunakul N, Shachter NS, Windor SL, Adams M, et al. Safety and efficacy of omacor in severe hypertriglyceridemia. J Cardiovasc Risk 1997; 4: 385–391.
- 12.
Yusof HM, Cawood AL, Ding R, Williams JA, Napper FL, Shearman CP, et al. Limited impact of 2 g/day omega-3 fatty acid ethyl esters (Omacor®) on plasma lipids and inflammatory markers in patients awaiting carotid endarterectomy. Mar Drugs 2013; 11: 3569–3581.
- 13.
Tanaka K, Ishikawa Y, Yokoyama M, Origasa H, Matsuzaki M, Saito Y, et al; JELIS Investigators, Japan. Reduction in the recurrence of stroke by eicosapentaenoic acid for hypercholesterolemic patients: Subanalysis of the JELIS trial. Stroke 2008; 39: 2052–2058.
- 14.
Tatsuno I, Kudou K, Kagawa T. Effect of TAK-085 on low-density lipoprotein particle size in patients with hypertriglyceridemia: A double-blind randomized clinical study. Cardiovasc Ther 2016; 33: 317–323.
- 15.
Domei T, Yokoi H, Kuramitsu S, Soga Y, Arita T, Ando K, et al. Ratio of serum n-3 to n-6 polyunsaturated fatty acids and the incidence of major adverse cardiac events in patients undergoing percutaneous coronary intervention. Circ J 2012; 76: 423–429.
- 16.
Takahashi M, Ando J, Shimada K, Nishizaki Y, Tani S, Ogawa T, et al. The ratio of serum n-3 to n-6 polyunsaturated fatty acids is associated with diabetes mellitus in patients with prior myocardial infarction: A multicenter cross-sectional study. BMC Cardiovasc Disord 2017; 17: 41.
- 17.
Origasa H, Yokoyama M, Matsuzaki M, Saito Y, Matsuzawa Y; JELIS Investigators. Clinical importance of adherence to treatment with eicosapentaenoic acid by patients with hypercholesterolemia. Circ J 2010; 74: 510–517.
- 18.
Osterberg L, Blaschke T. Adherence to medication. N Engl J Med 2005; 353: 487–497.
- 19.
Claxton AJ, Cramer J, Pierce C. A systematic review of the associations between dose regimens and medication compliance. Clin Ther 2001; 23: 1296–1310.


