Abstract
Background:
The clinical significance of osteoporosis in chronic heart failure (CHF) remains unclear.
Methods and Results:
A total of 303 CHF patients (75 years, [interquartile range (IQR) 66–82 years]; 41% female) were retrospectively examined. Bone mineral densities (BMDs) at the lumbar spine, femoral neck, and total femur were measured by using dual-energy X-ray absorptiometry (DEXA), and osteoporosis was diagnosed when the BMD at any of the 3 sites was <70% of the Young Adult Mean percentage (%YAM). The prevalence of osteoporosis in CHF patients was 40%. Patients with osteoporosis were older (79 [IQR, 74–86] vs. 72 [IQR, 62–80] years), included a large percentage of females, had slower gait speed and had a lower body mass index. Multivariate logistic regression analysis indicated that sex, BMI, gait speed, loop diuretics use and no use of direct oral anticoagulants (DOACs) were independently associated with osteoporosis. Kaplan-Meier survival curves showed that the rate of death and heart failure hospitalization was higher in patients with osteoporotic BMD at 2 or 3 sites than in patients without osteoporosis (hazard ratio 3.45, P<0.01). In multivariate Cox regression analyses, osteoporotic BMD at 2 or 3 sites was an independent predictor of adverse events after adjustment for prognostic markers.
Conclusions:
Loop diuretics use and no DOACs use are independently associated with osteoporosis in CHF patients. Osteoporosis is a novel predictor of worse outcome in patients with CHF.
Chronic heart failure (CHF) is a major public health problem, with a prevalence of over 23 million cases worldwide, and it is a leading cause of morbidity and mortality.1,2
In addition, CHF has a negative effect on the quality of life through physical, psychological, and social difficulties. Importantly, cardiac dysfunction is not the sole mechanism of poor health-related quality of life. The presence of comorbidities such as sarcopenia, chronic kidney disease (CKD), metabolic and orthopedic diseases and adverse actions of pharmacological agents contribute to the poor quality of life for CHF patients.3,4
Earlier large epidemiological studies showed that CHF was closely associated with an increased risk of hip fracture,5,6
which has a profound effect on health-related quality of life. Several mechanisms that underlie the association between CHF and incidence of hip fracture have been proposed. A retrospective cross-sectional study and a case-control study indicated a greater risk of falling, a common trigger of hip fracture, in CHF patients, presumably through decline in physical function, hypotension, and unfavorable effects of medications.7
In addition, Anker et al reported that bone mineral density (BMD), measured by a dual-energy X-ray absorptiometry (DEXA) scan, decreases during the development of a cachexic state in CHF patients.8
Results of a meta-analysis showed that whole body BMD is lower in patients with CHF than in patients without CHF, and that the change in BMD is dependent on CHF severity, indicating potential bone fragility and susceptibility to fracture in CHF patients.9
Thus, reduced BMD together with an increased incidence of fall events are likely to be responsible for the high prevalence of fractures in CHF patients.
Despite accumulating evidence of a close association between orthopedic fractures and CHF, the clinical risk factors of osteoporosis, defined as reduction in BMD, in CHF patients, have not been systematically analyzed. In addition to such risk factors, the effect of osteoporosis on prognosis of CHF remains unclear, though there is only one study that has shown a relationship between reduced BMD and adverse outcome without adjustment for established prognostic markers.10
Therefore, we aimed to clarify the prevalence, clinical risk factors, and prognostic effect of osteoporosis in CHF patients.
Methods
This study was conducted in strict adherence with the principles of the Declaration of Helsinki and was approved by the Clinical Investigation Ethics Committee of Sapporo Medical University Hospital (Number 302-243).
Study Subjects
This study was a single-center, retrospective, and observational study. We enrolled consecutive patients who were admitted to our institute for diagnosis and management of CHF during the period from 1 November 2015 to 30 October 2019. This period was selected because CHF patients routinely received body composition analysis by a DEXA scan and assessment of physical function for the diagnosis of sarcopenia and osteoporosis during that period. The inclusion criterium was diagnosis of CHF according to Japanese Circulation Society / Japanese Heart Failure Society Guidelines for Heart Failure by several cardiologists.11
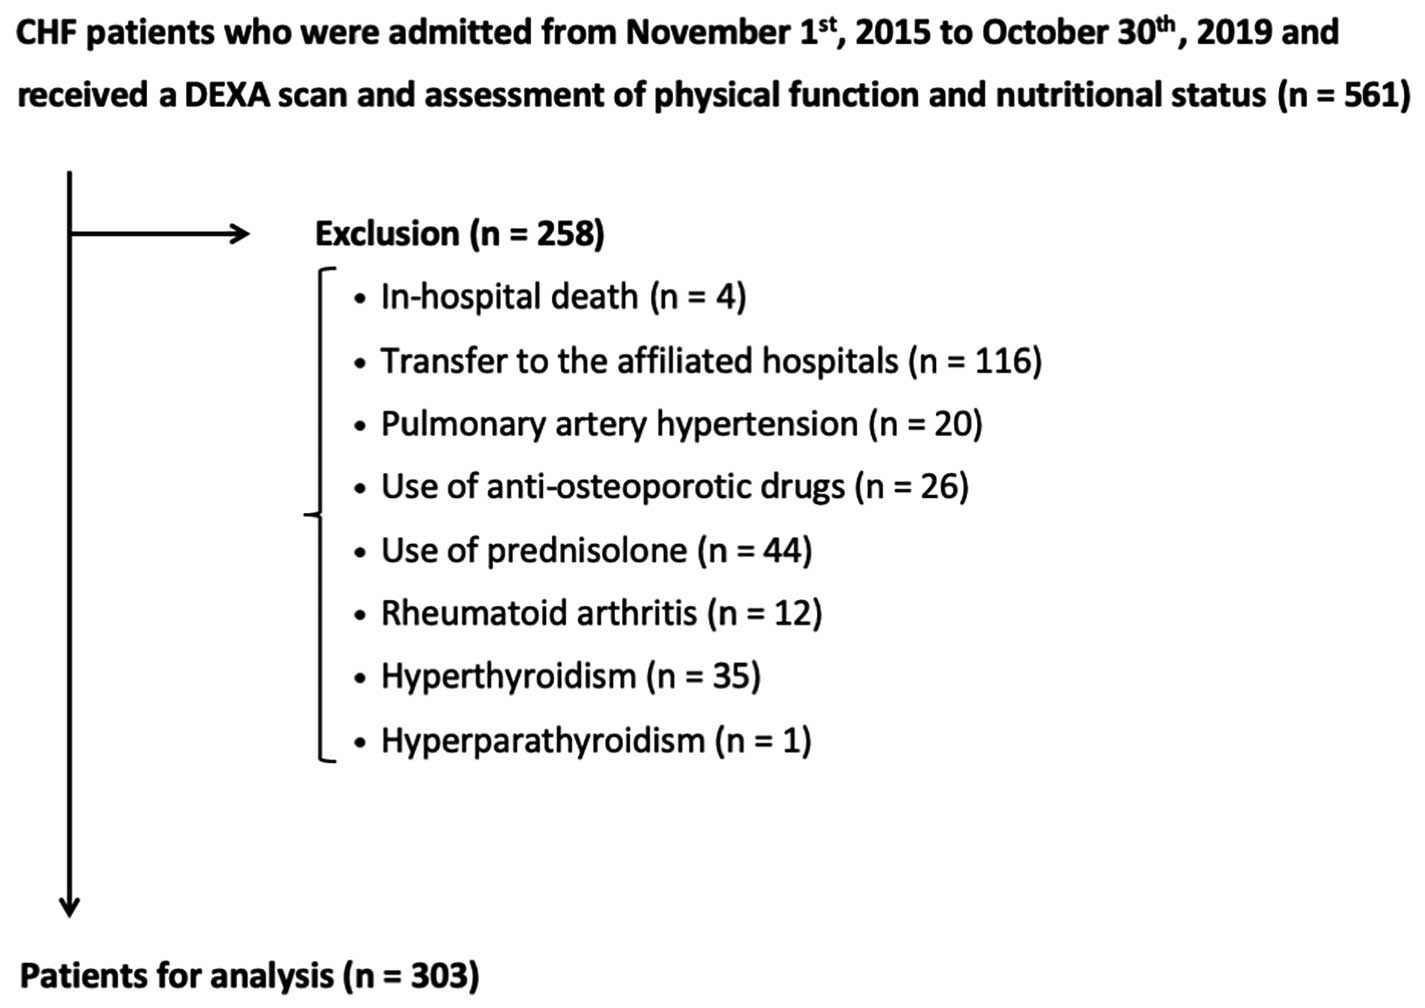
Patients who died in hospital and patients who were transferred to affiliated hospitals were excluded. Patients with pulmonary artery hypertension, rheumatoid arthritis, hyperthyroidism, hyperparathyroidism, or Cushing disease, and patients receiving concurrent treatment with steroid or anti-osteoporotic drugs were excluded. In patients who had New York Heart Association (NYHA) functional class IV symptoms at the time of admission, DEXA measurements were performed after their symptoms had improved to NYHA functional class III.
Body Composition Analysis and Definition of Osteoporosis
Body composition was analyzed by using a DEXA scan (Horizon A DXA System; HOLOGIC, Waltham, MA, USA), as previously reported.12
BMDs at the hip with the femoral neck, total femoral bones, and the lumbar spine over the L2–L4 regions were measured and expressed as g/cm2. Diagnosis of osteoporosis was made according to the criteria for primary osteoporosis by the Japanese Society for Bone and Mineral Research and Japan Osteoporosis Society Joint Review Committee; osteoporosis was defined as <70% of the Young Adult Mean percentage (%YAM), the mean BMD in healthy young people, at any sites of the lumbar spines, femoral neck, or total femoral bones.13
Appendicular skeletal muscle mass (ASM) was calculated as the sum of bone-free lean masses in the arms and legs. ASM index (ASMI) and fat mass index (FMI) were defined as ASM/height2
and total fat mass/height2, respectively.
Assessment of Nutrition Status and Functional Status
Nutritional status was assessed using the Mini Nutritional Assessment Short Form (MNA-SF), as previously described.14
As an index of functional fitness, 10-m gait speed was determined. Fourteen meters walking without assistance was performed and the time was measured for the intermediate 10 meters to avoid the effect of acceleration or deceleration on walking speed in 2 meters at the beginning and end of the course.
Laboratory Data and Echocardiography
Data for blood tests and left ventricular ejection fraction (LVEF), measured by using the modified Simpson method, within 14 days of DEXA measurements, were retrieved from the patients’ medical records. Estimated glomerular filtration rate (eGFR) was calculated by using the cystatin-C-based equation developed by the Japanese Society of Nephrology (eGFRcys): eGFRcys = 104 × CystatinC−1.019 × 0.996age ( × 0.929 if female) − 8.15
Clinical Endpoints
Adverse events were defined as death and unscheduled readmission due to worsening heart failure or arrhythmia. Data for clinical endpoints in the study patients were obtained for 2 months after enrollment of the last patient; the mean follow-up period was 285±255 days.
Statistical Analysis
Data are presented as means±standard deviation or medians (interquartile range [IQR]: 25th–75th
percentile) and expressed as frequency and percentage. The Welch test or Mann-Whitney U-test were used for a comparison of continuous variables in the 2 groups, and 1-way analysis of variance or the Kruskal-Wallis test was used for a comparison of continuous variables in ≥3 groups. Differences in categorical variables between the 2 groups were examined by using the chi-squared test. The trends in proportions between categorical variables and between ordinal variables were assessed by using Pearson’s chi-squared test and the Cochran-Armitage test, respectively. To determine the clinical risk factors of osteoporosis, in addition to traditional risk factors, variables that had statistical significance or a trend toward significance (P<0.10) in the analyses of prevalence of osteoporosis in sub-groups were incorporated into multivariate regression models. Smoking habits and history of fracture, well-known risk factors of osteoporosis, were not incorporated into multivariate regression models because multicollinearity among these variables, including sex, was found. Effects of anticoagulants on BMD were analyzed using analysis of covariance (ANCOVA), with generalized propensity score as the covariate. Survival curves were calculated by using the Kaplan-Meier method, and statistical significance of differences between the curves was assessed by using log-rank statistics. Univariate and multivariate Cox proportional hazard analyses were used to evaluate predictive ability. A P value <0.05 was considered statistically significant. Statistical analyses were carried out by using JMP version 14.3.0 (SAS Institute Inc., Cary, NC, USA).
Results
Five-hundred and sixty-one patients met the inclusion criterion, and 258 patients were excluded by the exclusion criteria; thus, data for 303 patients were used for analyses, as shown in
Figure 1.
Baseline Clinical Characteristics
As shown in
Table 1, the median age of the patients (n=303) was 75 years (IQR, 66–82 years) and 41% of the patients were female. The median BMI was 22.5 kg/m2
(IQR, 20.2–25.0 kg/m2). Thirty-one percent of the patients were classified as NYHA III. The median LVEF was 47% (IQR, 33–62%) and 39% of the patients met the criteria for heart failure with reduced ejection fraction (HFrEF). The most frequent etiology of CHF was valvular heart disease (33%), followed by cardiomyopathy (30%) and ischemic cardiomyopathy (17%).
Table 1.
Patient Characteristics
| Parameter |
All patients
(n=303) |
Osteoporosis
(n=122) |
Non-osteoporosis
(n=181) |
P value |
| Age, years |
75 (66–82) |
79 (74–86) |
72 (62–80) |
<0.01 |
| ≥65 years, n (%) |
235 (78) |
107 (88) |
128 (71) |
<0.01 |
| Female, n (%) |
124 (41) |
80 (66) |
44 (24) |
<0.01 |
| Height, cm |
159±10 |
153±9 |
163±9 |
<0.01 |
| Body weight, kg |
57.2 (49.8–66.2) |
50.0 (42.4–55.6) |
61.8 (55.7–70.8) |
<0.01 |
| BMI, kg/m2 |
22.5 (20.2–25.0) |
21.2 (19.1–23.2) |
23.5 (21.5–26.2) |
<0.01 |
| NYHA-FC, n (%) |
| I |
32 (11) |
2 (2) |
30 (17) |
<0.01 |
| II |
177 (58) |
68 (56) |
109 (60) |
|
| III |
94 (31) |
52 (43) |
42 (23) |
|
| LVEF, % |
47 (33–62) |
49 (34–64) |
46 (33–61) |
0.15 |
| HFrEF, n (%) |
117 (39) |
45 (37) |
72 (40) |
0.61 |
| Etiology, n (%) |
|
|
|
0.35 |
| Valvular heart disease |
99 (33) |
46 (38) |
53 (29) |
|
| Cardiomyopathy |
90 (30) |
34 (28) |
56 (31) |
|
| Ischemic heart disease |
53 (17) |
22 (18) |
31 (17) |
|
| Comorbidity, n (%) |
| Hypertension |
196 (65) |
88 (72) |
108 (60) |
0.03 |
| Dyslipidemia |
154 (51) |
60 (49) |
94 (52) |
0.64 |
| Diabetes mellitus |
111 (37) |
48 (39) |
63 (35) |
0.42 |
| Chronic kidney disease |
176 (58) |
87 (71) |
89 (49) |
<0.01 |
| Atrial fibrillation |
154 (51) |
61 (50) |
93 (51) |
0.81 |
| Anemia |
112 (37) |
58 (48) |
54 (30) |
<0.01 |
| History of fracture, n (%) |
33 (11) |
18 (15) |
15 (8) |
0.08 |
| Former or current smoker, n (%) |
156 (51) |
44 (36) |
112 (62) |
<0.01 |
| Fitness habits, n (%) |
112 (37) |
42 (34) |
70 (39) |
0.45 |
| 10-m gait speed, m/s |
0.88±0.27 |
0.75±0.21 |
0.97±0.26 |
<0.01 |
| MNA-SF score, points |
9 (7–11) |
8 (7–11) |
9 (8–11) |
0.02 |
| Malnutrition, n (%) |
92 (30) |
48 (39) |
44 (24) |
<0.01 |
| Laboratory data |
| NT-proBNP level, pg/mL |
1,197 (629–2,799) |
1,886 (826–3,779) |
984 (464–2,003) |
<0.01 |
| Albumin, g/dL |
3.6 (3.4–4.0) |
3.6 (3.4–3.9) |
3.7 (3.5–4.0) |
0.02 |
| Hemoglobin, g/dL |
12.0 (10.6–13.8) |
11.3 (10.3–12.5) |
12.8 (11.1–14.2) |
<0.01 |
| Creatinine, mg/dL |
1.02 (0.78–1.34) |
1.03 (0.76–1.54) |
1.01 (0.80–1.25) |
0.38 |
| Cystatin C, mg/dL |
1.19 (0.99–1.67) |
1.35 (1.02–2.10) |
1.13 (0.96–1.43) |
<0.01 |
| eGFRcys, mL/min/1.73 m2 |
55 (35–70) |
45 (27–62) |
60 (44–72) |
<0.01 |
| Corrected calcium, mg/dL |
9.2 (9.0–9.5) |
9.2 (9.0–9.5) |
9.2 (9.0–9.5) |
0.83 |
| Phosphorus, mg/dL |
3.4 (3.1–3.9) |
3.4 (3.1–3.9) |
3.5 (3.1–3.9) |
0.91 |
| Medication, n (%) |
| ACEI or ARB |
154 (51) |
60 (49) |
94 (52) |
0.64 |
| β-blocker |
196 (65) |
76 (62) |
120 (66) |
0.47 |
| MRA |
133 (44) |
56 (46) |
77 (43) |
0.56 |
| Loop diuretics |
182 (60) |
87 (71) |
95 (52) |
<0.01 |
| Thiazide |
14 (5) |
7 (6) |
7 (4) |
0.45 |
| Statin |
143 (47) |
58 (48) |
85 (47) |
0.92 |
| Anticoagulant therapy |
|
|
|
<0.01 |
| Warfarin |
82 (27) |
41 (34) |
41 (23) |
|
| DOACs |
82 (27) |
22 (18) |
60 (33) |
|
| XOIs |
89 (29) |
42 (34) |
47 (26) |
0.11 |
| PPIs |
205 (68) |
94 (77) |
111 (61) |
<0.01 |
| Body composition |
| ASMI, kg/m2 |
5.99 (5.22–7.02) |
5.44 (4.71–6.06) |
6.58 (5.66–7.24) |
<0.01 |
| FMI, kg/m2 |
6.24 (4.89–8.19) |
5.82 (4.63–8.04) |
6.36 (5.05–8.66) |
0.04 |
| BMD, g/cm2 |
| Lumber spines |
0.96 (0.81–1.14) |
0.75 (0.65–0.93) |
1.05 (0.95–1.23) |
<0.01 |
| Femoral neck (n=299) |
0.64 (0.51–0.75) |
0.48 (0.42–0.53) |
0.73 (0.66–0.80) |
<0.01 |
| Total femoral (n=299) |
0.80 (0.65–0.92) |
0.62 (0.54–0.69) |
0.90 (0.82–0.98) |
<0.01 |
| %YAM, % |
| Lumber spines |
94±25 |
77±18 |
106±22 |
<0.01 |
| Femoral neck (n=299) |
76±19 |
59±8 |
89±13 |
<0.01 |
| Total femoral (n=299) |
85±18 |
69±10 |
97±13 |
<0.01 |
Data are presented as mean±standard deviation or median (interquartile range) or n (%). N, number of patients for whom the parameter was available. P<0.05 was considered statistically significant. HFrEF was defined as <40% of LVEF. Anemia was defined as a hemoglobin level <13 g/dL in males and <12 g/dL in females. CKD was defined as <60 mL/min/1.73 m2 of eGFRcys. Malnutrition was defined as ≤7 points of MNA-SF score. ACEI, angiotensin-converting enzyme inhibitor; ARB, angiotensin receptor blocker; ASM, appendicular skeletal muscle mass; ASMI, appendicular skeletal muscle mass index; BMD, bone mineral density; BMI, body mass index; DOACs, direct oral anticoagulants; eGFRcys, estimated glomerular filtration rate calculated using cystatin C; FMI, fat mass index; HFrEF, heart failure with reduced ejection fraction; LVEF, left ventricular ejection fraction; MNA-SF, Mini-Nutritional Assessment Short Form; MRA, mineralocorticoid receptor antagonist; NT-proBNP, N-terminal pro-brain natriuretic peptide; NYHA-FC, New York Heart Association functional class; PPIs, proton pump inhibitors; XOIs, xanthine oxidase inhibitors; %YAM, the Young Adult Mean percentage.
The prevalence of osteoporosis and results of BMD measurements are summarized in
Figure 2
and
Supplementary Table 1. The numbers of patients with %YAM of less than 70% at the lumbar spine, femoral neck, and total femoral sites were 52 (17%), 116 (39%), and 61 (20%), respectively (Figure 2A–C). As a result, the overall prevalence of osteoporosis in the CHF patients was 40%, and the prevalences were 23% in males and 65% in females (Figure 2E,F). Of 122 patients who were diagnosed as having osteoporosis, 76 patients showed osteoporotic BMDs at ≥2 sites of BMD measurements (Figure 2D).
Clinical Characteristics of CHF Patients With Osteoporosis
As shown in
Table 1, patients with osteoporosis were older than those without osteoporosis (79 [IQR, 74–86] vs. 72 [IQR, 62–80] years) and the percentage of females was higher in patients with osteoporosis (66% vs. 24%). In addition, patients with osteoporosis had a lower BMI and higher prevalence of NYHA III symptoms compared with those patients without osteoporosis, though values of LVEF and prevalence of HFrEF were comparable in the 2 groups. The proportions of patients with osteoporosis who had hypertension, CKD, and anemia were significantly higher than the proportions of patients without osteoporosis, but the proportions of patients with dyslipidemia, diabetes mellitus (DM), and atrial fibrillation were similar in patients with and without osteoporosis. Ten-meter gait speed was significantly slower in patients with osteoporosis than in patients without osteoporosis. Plasma levels of N-terminal pro B-type natriuretic peptide (NT-proBNP) and cystatin C were higher and levels of hemoglobin and eGFRcys were lower in patients with osteoporosis than in patients without osteoporosis, though serum creatinine levels were similar in the 2 groups. Loop diuretics and proton pump inhibitors (PPIs) were more frequently used in patients with osteoporosis than in patients without osteoporosis. In addition, warfarin was more frequently used and direct oral anticoagulants (DOACs) were less frequently used in patients with osteoporosis than in patients without osteoporosis.
Clinical Determinants of Osteoporosis in CHF Patients
Results of univariate logistic regression analysis showed that age, female sex, BMI, presence of hypertension and anemia, eGFRcys, NT-proBNP, 10-m gait speed, use of loop diuretics, no use of DOACs, and use of PPIs were associated with the presence of osteoporosis (Table 2). In multivariate logistic regression analysis, female sex, BMI, 10-m gait speed, use of loop diuretics and no use of DOACs were selected as independent explanatory factors of the presence of osteoporosis (Table 2). Considering the possible association of osteoporosis with cachexia,8
ASMI, FMI, and MNA-SF scores instead of BMI were incorporated into the multivariate logistic regression model. ASMI and FMI, but not MNA-SF, were independent predictors for the presence of osteoporosis (Table 2).
Table 2.
Univariate and Multivariate Logistic Regression Analysis for Osteoporosis
| |
Univariate model |
P value |
Multivariate model 1 |
P value |
Multivariate model 2 |
P value |
Multivariate model 3 |
P value |
Multivariate model 4 |
P value |
| OR (95% CI) |
OR (95% CI) |
OR (95% CI) |
OR (95% CI) |
OR (95% CI) |
| Age, per 10 years increase |
1.66 (1.35–2.09) |
<0.01 |
1.11 (0.82–1.51) |
0.49 |
1.19 (0.89–1.59) |
0.23 |
1.13 (0.84–1.51) |
0.44 |
1.21 (0.91–1.61) |
0.19 |
| Female |
5.93 (3.58–9.83) |
<0.01 |
5.07 (2.68–9.61) |
<0.01 |
3.25 (1.62–6.55) |
<0.01 |
7.42 (3.74–14.7) |
<0.01 |
5.11 (2.76–9.48) |
<0.01 |
| BMI, per 1.0 kg/m2 increase |
0.80 (0.74–0.87) |
<0.01 |
0.83 (0.75–0.91) |
<0.01 |
|
|
|
|
|
|
| ASMI, per 1.0 kg/m2 increase |
0.41 (0.32–0.54) |
<0.01 |
|
|
0.67 (0.48–0.94) |
0.02 |
|
|
|
|
| FMI, per 1.0 kg/m2 increase |
0.90 (0.83–0.99) |
0.03 |
|
|
|
|
0.80 (0.71–0.91) |
<0.01 |
|
|
| MNA-SF score, per 1 point increase |
0.91 (0.83–0.99) |
0.02 |
|
|
|
|
|
|
1.05 (0.94–1.17) |
0.37 |
| Hypertension |
1.75 (1.07–2.87) |
0.03 |
1.38 (0.69–2.78) |
0.36 |
1.31 (0.66–2.59) |
0.44 |
1.38 (0.69–2.75) |
0.36 |
1.21 (0.62–2.38) |
0.57 |
| Diabetes mellitus |
1.21 (0.76–1.95) |
0.42 |
0.71 (0.38–1.35) |
0.30 |
0.71 (0.38–1.34) |
0.29 |
0.77 (0.41–1.44) |
0.41 |
0.87 (0.47–1.61) |
0.66 |
| eGFRcys, per 5.0 mL/min/1.73 m2 increase |
0.88 (0.83–0.93) |
<0.01 |
0.99 (0.90–1.08) |
0.80 |
1.01 (0.93–1.10) |
0.84 |
0.99 (0.91–1.09) |
0.87 |
1.02 (0.94–1.11) |
0.68 |
| Anemia |
2.13 (1.32–3.43) |
<0.01 |
1.16 (0.58–2.31) |
0.68 |
1.36 (0.70–2.63) |
0.36 |
1.15 (0.58–2.89) |
0.68 |
1.28 (0.67–2.47) |
0.46 |
| Log NT-proBNP, per 1.0 increase |
1.44 (1.19–1.75) |
<0.01 |
1.04 (0.78–1.39) |
0.78 |
1.15 (0.87–1.52) |
0.32 |
1.05 (0.79–1.40) |
0.74 |
1.22 (0.92–1.61) |
0.18 |
| 10-m gait speed, per 0.1 m/s increase |
0.68 (0.60–0.76) |
<0.01 |
0.80 (0.70–0.92) |
<0.01 |
0.83 (0.72–0.95) |
<0.01 |
0.79 (0.68–0.90) |
<0.01 |
0.80 (0.70–0.91) |
<0.01 |
| Loop diuretics |
2.76 (1.61–4.72) |
<0.01 |
2.52 (1.20–5.27) |
0.01 |
2.59 (1.27–5.28) |
<0.01 |
2.56 (1.23–5.31) |
0.01 |
2.70 (1.32–5.52) |
<0.01 |
| Anticoagulant therapy |
| Nothing |
1.00 (Ref.) |
|
1.00 (Ref.) |
|
1.00 (Ref.) |
|
1.00 (Ref.) |
|
1.00 (Ref.) |
|
| Warfarin |
1.36 (0.78–2.35) |
0.28 |
1.07 (0.50–2.28) |
0.86 |
1.05 (0.50–2.19) |
0.89 |
1.06 (0.50–2.24) |
0.88 |
1.11 (0.54–2.29) |
0.78 |
| DOACs |
0.50 (0.27–0.90) |
0.02 |
0.43 (0.19–0.96) |
0.04 |
0.40 (0.19–0.87) |
0.02 |
0.39 (0.18–0.86) |
0.02 |
0.36 (0.17–0.79) |
0.01 |
| PPIs |
2.12 (1.26–3.55) |
<0.01 |
1.41 (0.71–2.80) |
0.33 |
1.24 (0.63–2.43) |
0.54 |
1.39 (0.70–2.76) |
0.34 |
1.42 (0.72–2.78) |
0.31 |
P<0.05 was considered statistically significant. Anemia was defined as a hemoglobin level <13 g/dL in males and <12 g/dL in females. CI, confidence interval; OR, odds ratio. Other abbreviations as in Table 1.
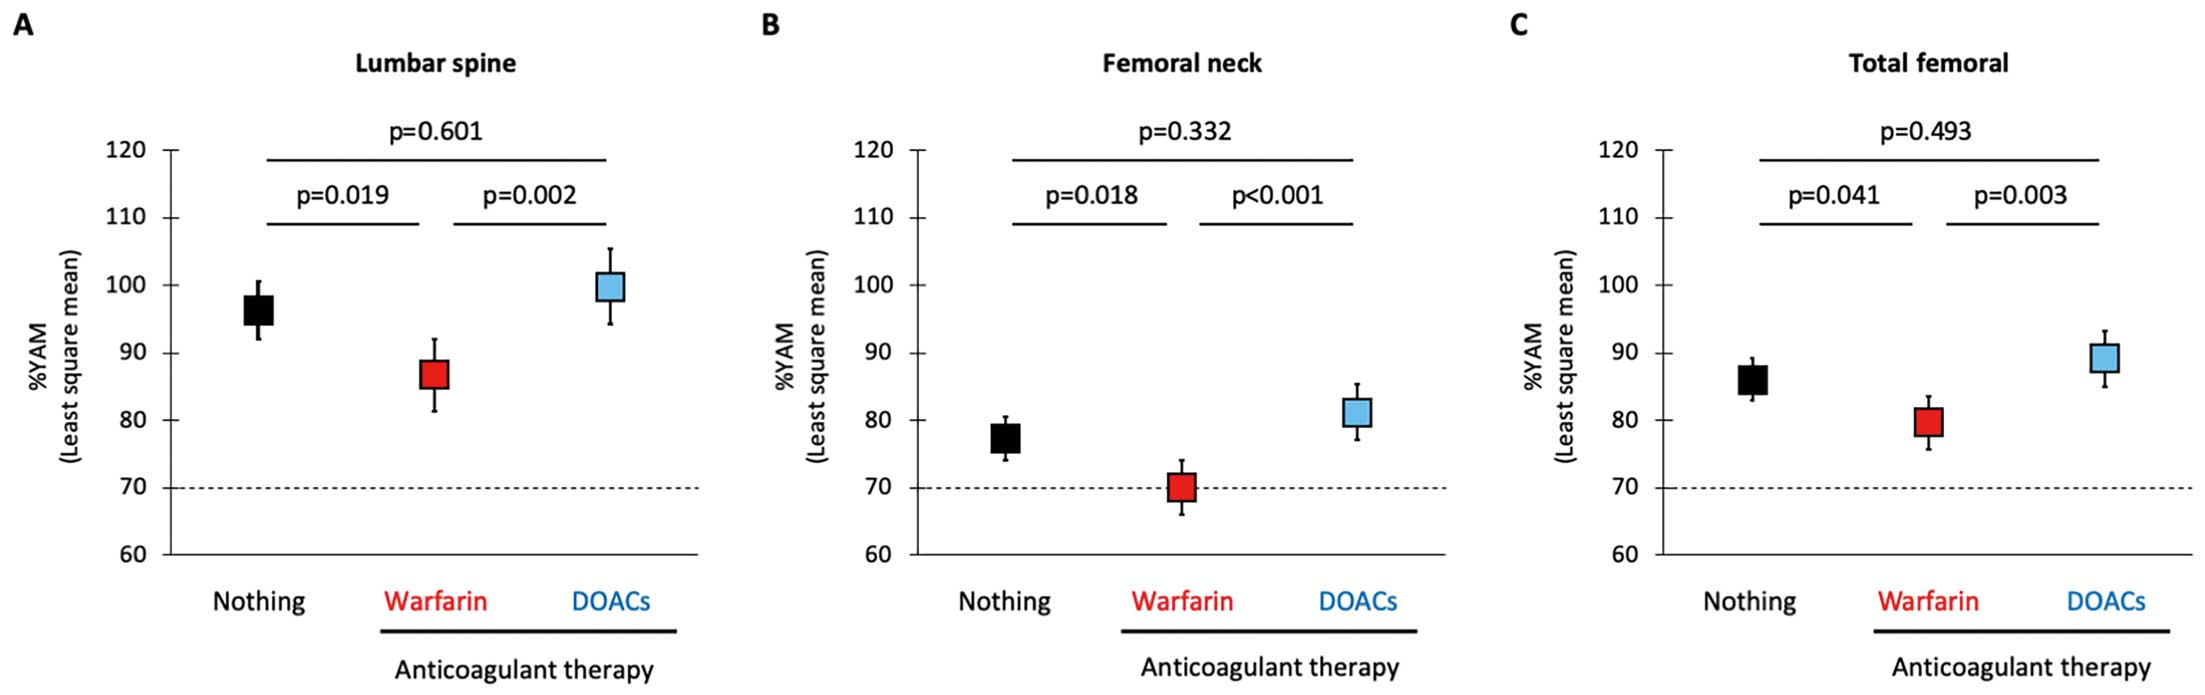
Although these findings suggested favorable effect of DOACs on BMD, there were differences in the clinical characteristics and prescribed drugs among patients receiving warfarin and DOACS and patients not receiving anticoagulants (Supplementary Table 2). Therefore, the effect of anticoagulants on BMD was analyzed by using ANCOVA with the generalized propensity score as the covariate to minimize the effect of cofounding factors on the analyses. A general propensity score was estimated using variables that had statistical significance or a trend toward significance (P<0.10) in the analyses of prevalence of osteoporosis (Table 2) and in the sub-groups analyses of clinical characteristics (Supplementary Table 2); that is, age, sex, BMI, NYHA functional class, HFrEF, hypertension, diabetes mellitus, CKD, anemia, fitness habit, 10-m gait speed, MNA-SF score, NT-proBNP, mineralocorticoid receptor antagonists, loop diuretics, thiazide, statin, xanthine oxidase inhibitors, and PPIs. Least square mean of %YAM was significantly lower in patients receiving warfarin than in patients who were not receiving treatments, whereas it was comparable in patients who were not receiving treatments and patients taking DOACs (Figure 3).
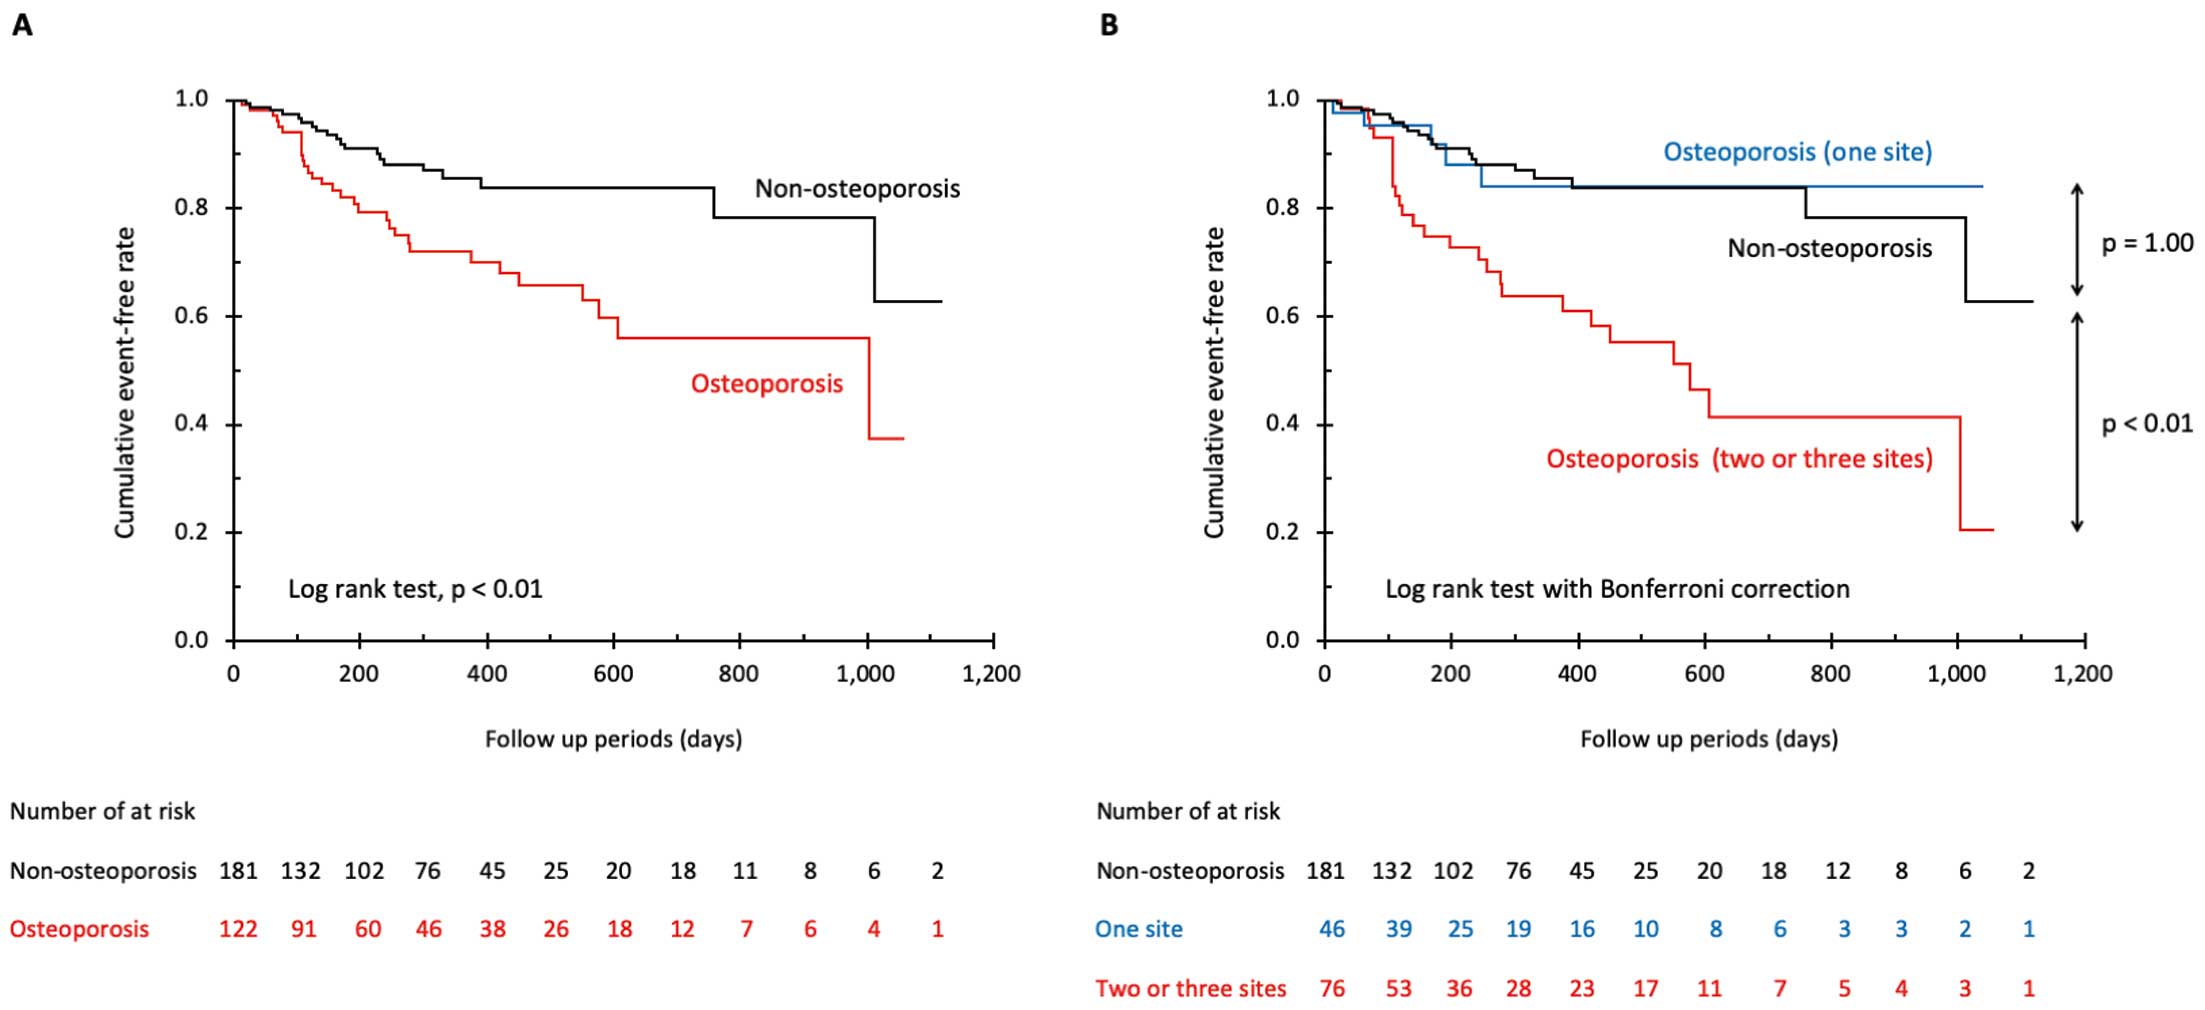
During the mean follow-up period of 285±255 days, 51 patients (16.8%) had adverse events. Kaplan-Meier survival curves showed that patients with osteoporosis had a significantly higher event rate than did patients without osteoporosis (HR, 2.40; 95% CI, 1.36–4.22; P<0.01,
Figure 4A). When patients with osteoporosis were divided into sub-groups according to the number of sites with BMD of an osteoporosis level, the sub-group with osteoporotic BMD at 2 or 3 sites had a significantly higher event rate than that in patients without osteoporosis (HR, 3.45; 95% CI, 1.92–6.20; P<0.01,
Figure 4B), though the event rates did not differ between the sub-group with osteoporotic BMD at only 1 site and patients without osteoporosis.
In multivariate Cox proportional hazard analyses, presence of osteoporosis was not selected as an independent predictor of adverse events. In contrast, presence of osteoporotic BMD at 2 or 3 sites was independently associated with a higher adverse event rate in the model adjusted for age, sex, and NT-proBNP (Table 3; HR, 2.21; 95% CI, 1.10–4.43; P=0.03). An independent association between presence of osteoporotic BMD at 2 or 3 sites and adverse event rate was also found in the model adjusted for the propensity score estimated using explanatory variables in
Table 2; that is, age, sex, BMI, hypertension, diabetes mellitus, eGFRcys, anemia, log NT-proBNP, 10-m gait speed, loop diuretics, anticoagulant therapy, and PPIs (HR, 3.09; 95% CI, 1.62–5.60; P<0.01). In contrast, presence of osteoporotic BMD at only 1 site was not selected as an independent determinant of adverse events in multivariate analyses.
Table 3.
Univariate and Multivariate Cox Proportional Hazard Analysis for Composite Outcome
| |
Univariate model |
P value |
Multivariate model 1 |
P value |
Multivariate model 2 |
P value |
Multivariate model 3 |
P value |
| HR (95% CI) |
HR (95% CI) |
HR (95% CI) |
HR (95% CI) |
| Non-osteoporosis |
1.00 (Ref.) |
|
1.00 (Ref.) |
|
1.00 (Ref.) |
|
1.00 (Ref.) |
|
| Osteoporosis |
2.40 (1.36–4.22) |
<0.01 |
1.89 (0.997–3.57) |
0.05 |
1.60 (0.84–3.05) |
0.15 |
0.93 (0.45–1.91) |
0.84 |
| Non-osteoporosis |
1.00 (Ref.) |
|
1.00 (Ref.) |
|
1.00 (Ref.) |
|
1.00 (Ref.) |
|
| Osteoporosis (1 site) |
0.93 (0.35–2.47) |
0.93 |
0.83 (0.30–2.27) |
0.71 |
0.92 (0.47–1.80) |
0.81 |
0.77 (0.28–2.13) |
0.62 |
| Osteoporosis (2 or 3 sites) |
3.45 (1.92–6.20) |
<0.01 |
2.82 (1.41–5.64) |
<0.01 |
2.21 (1.10–4.43) |
0.03 |
3.09 (1.62–5.60) |
<0.01 |
P<0.05 was considered statistically significant. Diagnosis of osteoporosis was made according to the criteria for primary osteoporosis by the Japanese Society for Bone and Mineral Research and Japan Osteoporosis Society Joint Review Committee, with osteoporosis being defined as <70% of %YAM, mean bone mineral density in healthy young people, at any sites of lumbar spines, femoral neck, or total femoral.16 Adjusted multivariate models: model 1, included age, gender; model 2, model 1+NT-proBNP; model 3, propensity score estimated using explanatory variables described in Table 2 (i.e., age, gender, BMI, hypertension, diabetes mellitus, anemia, log NT-proBNP, 10-m gait speed, loop diuretics, anticoagulant therapy and PPIs). HR, hazard ratio. Other abbreviations as in Tables 1,2.
Considering prognostic importance of osteoporotic BMD at 2 or 3 sites, clinical factors to determine presence of osteoporosis at 2 or 3 sites were analyzed. Detailed differences in clinical characteristics among groups are shown in
Supplementary Table 3. Results of univariate logistic regression analysis showed that age, female sex, BMI, ASMI, MNA-SF, NT-proBNP, 10-m gait speed, and use of loop diuretics and warfarin were associated with the presence of osteoporosis at 2 or 3 sites (Table 4). Results of multivariate logistic regression analyses showed that female sex, BMI, ASMI, FMI, 10-m gait speed, and use of loop diuretics were selected as independent explanatory factors of the presence of osteoporosis at 2 or 3 sites (Table 4), which was consistent with independent risk factors of osteoporosis (Table 2). In contrast, warfarin use was not selected in this analysis.
Table 4.
Univariate and Multivariate Logistic Regression Analysis for Osteoporosis at 2 or 3 Sites
| |
Univariate model |
P value |
Multivariate model 1 |
P value |
Multivariate model 2 |
P value |
Multivariate model 3 |
P value |
Multivariate model 4 |
P value |
| OR (95% CI) |
OR (95% CI) |
OR (95% CI) |
OR (95% CI) |
OR (95% CI) |
| Age, per 10 years increase |
1.56 (1.22–2.01) |
<0.01 |
1.20 (0.88–1.65) |
0.27 |
1.24 (0.91–1.68) |
0.17 |
1.18 (0.87–1.60) |
0.29 |
1.21 (0.90–1.63) |
0.21 |
| Female |
7.86 (4.31–14.3) |
<0.01 |
6.91 (3.31–14.4) |
<0.01 |
4.04 (1.87–8.74) |
<0.01 |
9.66 (4.39–21.3) |
<0.01 |
6.47 (3.21–13.0) |
<0.01 |
| BMI, per 1.0 kg/m2 increase |
0.78 (0.71–0.85) |
<0.01 |
0.80 (0.72–0.89) |
<0.01 |
|
|
|
|
|
|
| ASMI, per 1.0 kg/m2 increase |
0.36 (0.26–0.49) |
<0.01 |
|
|
0.63 (0.42–0.94) |
0.02 |
|
|
|
|
| FMI, per 1.0 kg/m2 increase |
0.90 (0.81–1.00) |
0.06 |
|
|
|
|
0.80 (0.69–0.92) |
<0.01 |
|
|
| MNA-SF score, per 1 point increase |
0.89 (0.81–0.98) |
0.02 |
|
|
|
|
|
|
1.05 (0.93–1.20) |
0.43 |
| Log NT-proBNP, per 1.0 increase |
1.51 (1.21–1.88) |
<0.01 |
1.07 (0.80–1.42) |
0.66 |
1.17 (0.89–1.55) |
0.26 |
1.07 (0.80–1.43) |
0.66 |
1.21 (0.91–1.62) |
0.19 |
| 10-m gait speed, per 0.1 m/s increase |
0.73 (0.65–0.81) |
<0.01 |
0.78 (0.66–0.91) |
<0.01 |
0.80 (0.69–0.94) |
<0.01 |
0.77 (0.66–0.90) |
<0.01 |
0.77 (0.66–0.90) |
<0.01 |
| Loop diuretics |
2.93 (1.61–5.34) |
<0.01 |
3.20 (1.40–7.29) |
<0.01 |
2.92 (1.34–6.40) |
<0.01 |
3.12 (1.39–6.98) |
<0.01 |
3.05 (1.39–6.69) |
<0.01 |
| Anticoagulant therapy |
| Nothing |
1.00 (Ref.) |
|
1.00 (Ref.) |
|
1.00 (Ref.) |
|
1.00 (Ref.) |
|
1.00 (Ref.) |
|
| Warfarin |
2.03 (1.12–3.69) |
0.02 |
1.91 (0.83–4.37) |
0.13 |
1.72 (0.77–3.84) |
0.19 |
1.87 (0.83–4.24) |
0.13 |
1.88 (0.85–4.19) |
0.12 |
| DOACs |
0.63 (0.31–1.28) |
0.20 |
0.59 (0.24–1.44) |
0.24 |
0.53 (0.22–1.26) |
0.15 |
0.53 (0.22–1.29) |
0.16 |
0.51 (0.21–1.20) |
0.12 |
P<0.05 was considered statistically significant. Diagnosis of osteoporosis was made according to the criteria for primary osteoporosis by the Japanese Society for Bone and Mineral Research and Japan Osteoporosis Society Joint Review Committee, with osteoporosis being defined as <70% of %YAM, mean bone mineral density in healthy young people, at any sites of lumbar spines, femoral neck, or total femoral.16 Abbreviations as in Tables 1,2.
Discussion
This is the first study to analyze, specifically, frequency, clinical risk factors, and prognostic effect of osteoporosis in the same cohort. The novel findings obtained from this study were as follows: (1) the overall prevalence of osteoporosis in the CHF patients was 40%, which was higher than that found in a previous study (40% in females with heart failure and 12% in males with heart failure);16
(2) in addition to traditional risk factors such as female sex, low BMI and poor physical function, use of loop diuretics was independently associated with presence of osteoporosis in CHF patients; (3) DOAC use was associated with reduced risk of osteoporosis compared with warfarin use; and (4) osteoporotic BMD at 2 or 3 sites was an independent predictor of adverse events after adjustment for prognostic markers including BNP.
The prevalence of osteoporosis was higher in patients with NYHA functional class III than in patients with NYHA functional class I or II (Table 1). These findings are consistent with the results of a meta-analysis showing lower BMD in CHF patients with NYHA functional class III or IV, and with results of previous studies showing that reduced BMD is frequently observed in patients with advanced-stage CHF, such as cachexic patients and candidates for cardiac transplantation.8,9
We found that osteoporosis in CHF patients was associated with poor prognosis and reduction in ASMI and FMI. In contrast, the results of a previous study in which a low number of patients with acute heart failure was included, showed that peak oxygen consumption, an index of exercise capacity,16
but not NT-proBNP, was an independent determinant of osteoporosis presence; this is consistent with the results of the present study showing that 10-m gait speed but not NT-proBNP was selected as an explanatory factor of osteoporosis (Table 2). In addition, a worse prognostic effect of osteoporosis remained after adjustment for NT-proBNP level (Table 3). These findings suggest that severity of CHF,
per se, is unlikely to be a determinant of osteoporosis or effect osteoporosis prognosis in CHF patients.
Multiple mechanisms for the increased incidence of osteoporosis in CHF patients have been proposed.17
Malnutrition, chronic systemic inflammation, oxidative stress, and physical inactivity, which are typically observed in patients with advanced-stage CHF,18
are all known to negatively influence BMD.17
Circulating level of vitamin D, a crucial regulator of calcium homeostasis and bone mineralization, was reported to be reduced in CHF patients.17,19
Signaling of receptor activator of nuclear factor κ-B ligand (RANKL), an inflammatory cytokine that activates bone resorption, was shown to be upregulated in the serum, myocardium, and bone marrow of the experimental models of heart failure and CHF patients.17,20,21
Shared risk factors and genetic predispositions may also be involved in the coexistence of CHF and osteoporosis.6,22
In fact, results of epidemiological studies have shown that low BMD predicts incident heart failure, suggesting a bidirectional relationship between CHF and osteoporosis.22
In the present study, we found that use of loop diuretics and no use of DOACs were independently associated with increased risk of osteoporosis in CHF patients, in addition to well-known risk factors of osteoporosis (i.e., advanced age, female gender, low BMI). Loop diuretics increase urinary excretion of calcium and magnesium by blocking their reabsorption, theoretically leading to urinary loss of calcium followed by enhanced bone turnover rate. In fact, a close association between use of loop diuretics and reduced BMD was shown in several studies, including a prospective large cohort study of men and women aged ≥65 years and a randomized controlled study.23–28
In contrast, the results of studies regarding the effect of the use of loop diuretics on risk of hip fracture are not consistent,23–28
possibly due to differences in other risk factors of osteoporosis and risk of falling due to hypovolemia and/or low cardiac output between study subjects.
Whether warfarin use is associated with increased fracture risk and reduction in BMD is still controversial, though warfarin use has been shown to have a significant effect on bone metabolism.29
Warfarin is a vitamin K antagonist that suppresses the carboxylation of glutamic acid to γ-carboxyglutamyl residues of osteocalcin, resulting in reduced bone hardness. Three recent cohort studies showed that use of DOACs was associated with a lower risk of osteoporotic fracture compared with warfarin use in patients with non-valvular atrial fibrillation in whom warfarin or DOACs were newly prescribed.30–32
However, to our knowledge, the effect of DOACs on BMD has not been reported in the literature. There was a larger percentage of males in patients receiving DOACs, and patients receiving DOACs tended to have higher BMI than in patients receiving warfarin and patients not receiving DOACs or warfarin (Supplementary Table 2). Multivariate logistic regression analysis indicated that use of DOACs was associated with reduced risk of osteoporosis (OR 0.43) in CHF patients after adjustment for confounders including sex and BMI, whereas warfarin use was neutral (OR 1.07). Superiority of DOACs to warfarin was found also in the analyses in which ANCOVA with generalized propensity score as the covariate was used to minimize the effect of confounding factors on the analyses (Figure 3). As opposed to the obvious negative effect of warfarin on bone metabolism, experimental studies to examine the effect of DOACs on bone metabolism yielded conflicting results; earlier studies reported that treatment with dabigatran, a direct thrombin inhibitor, is associated with a higher bone volume and rivaroxaban, a direct factor Xa inhibitor, had positive effects on fracture healing in rats,33,34
whereas a recent study reported the negative effect of dabigatran on bone turnover and repair in vivo and ex vivo.35
These conflicting findings of experimental studies cannot be easily reconciled because available data are limited. Nevertheless, the results of the present study indicate that DOACs are superior to warfarin for prevention of osteoporosis in CHF patients with indication of anticoagulation therapy, though head-to head comparison of the 2 types of anticoagulation therapy is necessary to rigorously address this issue.
Earlier studies showed that cachexia was an independent predictor of death after adjustment for age and prognostic markers such as NYHA functional class and LVEF.18
However, cachexia is a complex composite of signs and symptoms, including unintentional weight loss or low BMI, decline in muscle strength and mass, fatigue feeling, anorexia, anemia and other laboratory findings indicating malnutrition. BMD has been reported to be reduced in cachexic heart failure patients,8,9
and we found that presence of osteoporosis at 2 or 3 sites was independently associated with low ASMI, a prerequisite for cachexia, and increased adverse events in CHF patients (Table 2, Table 4, Figure 4B), possibly indicating a close association between cachexia and adverse outcome. However, nutritional status assessed by the MNA-SF, a hallmark of cachexia, was not selected as an explanatory variable for presence of osteoporosis at 2 or 3 sites, suggesting that development of cachexia may not be a sole mechanism of association between osteoporosis and worse clinical outcome. Interestingly, serum level of RANKL, a cytokine that promotes both osteoporosis and myocardial inflammation through the NF-kB pathway, was found to be upregulated even in heart failure patients with NYHA functional class II.20,36
Thus, a close association between osteoporosis and poor clinical outcome in CHF patients may be mediated by RANKL activation. Further analyses are needed to determine if there are relationships between cachexia, RANKL, and osteoporosis in CHF patients.
There are some limitations in the present study. First, because this study was a retrospective observational study using a low number of Japanese patients from a single center, there might have been selection bias and ethnic specificity in the study subjects. Second, comparative analyses of BMD and frequency of osteoporosis between CHF patients and age-matched non-CHF controls were not performed in the present study. However, results of a large-scale population-based cohort study in Japan revealed that mean values of BMD at the femoral neck in the age groups of 60–69, 70–79, and ≥80 years was 0.75, 0.71, and 0.68 g/cm2, respectively, in males and 0.63, 0.57, and 0.52 g/cm2, respectively, in females.37
These BMD values are higher than the mean BMD at the femoral neck, especially in female CHF patients in the present study (Supplementary Table 1), indicating an adverse effect of CHF on BMD. Third, severity of osteoporosis is determined not only by the number of affected sites, but also by the degree of BMD reduction and microarchitectural deterioration and presence of history of fracture, which was not evaluated in the present study. Finally, due to the low number of study subjects, the present study might have insufficient statistical power for detection of differences in prevalence and clinical determinants of osteoporosis among the groups with different etiologies of heart failure (e.g., HFrEF vs. heart failure with preserved ejection fraction).
Conclusions
In addition to traditional risk factors such as female sex, low BMI and low physical function, use of loop diuretics and use of DOACs are independently associated with change in BMD and osteoporosis in patients with CHF. The risk of osteoporosis may be increased in users of loop diuretics and may be decreased in users of DOACs among CHF patients. Extent of osteoporosis is a novel predictor of adverse events in CHF patients.
Disclosures
The authors have no conflicts of interest to disclose. T.M. is a member of
Circulation Journal
’ Editorial Team.
Sources of Funding
This study was supported by a Grant-in-Aid for Young Scientists (Katano S) from the Japan Society for the Promotion of Science, KAKENHI Grant Number JP18K17677, Tokyo, Japan.
Data Availability
The deidentified data of participants in the present study will not be shared.
Supplementary Files
Please find supplementary file(s);
http://dx.doi.org/10.1253/circj.CJ-20-0593
References
- 1.
Roger VL. Epidemiology. Circ Res 2013; 113: 646–659.
- 2.
Sakata Y, Shimokawa H. Epidemiology of heart failure in Asia. Circ J 2013; 77: 2209–2217.
- 3.
Mentz RJ, Kelly JP, von Lueder TG, Voors AA, Lam CS, Cowie MR, et al. Noncardiac comorbidities in heart failure with reduced versus preserved ejection fraction. J Am Coll Cardiol 2014; 64: 2281–2293.
- 4.
Lawson CA, Solis-Trapala I, Dahlstrom U, Mamas M, Jaarsma T, Kadam UT, et al. Comorbidity health pathways in heart failure patients: A sequences-of-regressions analysis using cross-sectional data from 10,575 patients in the Swedish Heart Failure Registry. PLoS Med 2018; 15: e1002540.
- 5.
van Diepen S, Majumdar SR, Bakal JA, McAlister FA, Ezekowitz JA. Heart failure is a risk factor for orthopedic fracture: A population-based analysis of 16,294 patients. Circulation 2008; 118: 1946–1952.
- 6.
Sennerby U, Melhus H, Gedeborg R, Byberg L, Garmo H, Ahlbom A, et al. Cardiovascular diseases and risk of hip fracture. JAMA 2009; 302: 1666–1673.
- 7.
Lee K, Pressler SJ, Titler M. Falls in patients with heart failure: A systematic review. J Cardiovasc Nurs 2016; 31: 555–561.
- 8.
Anker SD, Clark AL, Teixeira MM, Hellewell PG, Coats AJ. Loss of bone mineral in patients with cachexia due to chronic heart failure. Am J Cardiol 1999; 83: 612–615.
- 9.
Xing W, Lv X, Gao W, Wang J, Yang Z, Wang S, et al. Bone mineral density in patients with chronic heart failure: A meta-analysis. Clin Interv Aging 2018; 13: 343–353.
- 10.
Terrovitis J, Zotos P, Kaldara E, Diakos N, Tseliou E, Vakrou S, et al. Bone mass loss in chronic heart failure is associated with secondary hyperparathyroidism and has prognostic significance. Eur J Heart Fail 2012; 14: 326–332.
- 11.
Tsutsui H, Isobe M, Ito H, Ito H, Okumura K, Ono M, et al. JCS 2017/JHFS 2017 Guideline on diagnosis and treatment of acute and chronic heart failure: Digest version. Circ J 2019; 83: 2084–2184.
- 12.
Katano S, Yano T, Ohori K, Nagano N, Honma S, Shimomura K, et al. Novel prediction equation for appendicular skeletal muscle mass estimation in patients with heart failure: Potential application in daily clinical practice. Eur J Prev Cardiol, doi:10.1177/2047487320904236.
- 13.
Soen S, Fukunaga M, Sugimoto T, Sone T, Fujiwara S, Endo N, et al. Diagnostic criteria for primary osteoporosis: Year 2012 revision. J Bone Miner Metab 2013; 31: 247–257.
- 14.
Katano S, Hashimoto A, Ohori K, Watanabe A, Honma S, Yanase R, et al. Nutritional status and energy intake as predictors of functional status after cardiac rehabilitation in elderly inpatients with heart failure: A retrospective cohort study. Circ J 2018; 82: 1584–1591.
- 15.
Horio M, Imai E, Yasuda Y, Watanabe T, Matsuo S; Collaborators Developing the Japanese Equation for Estimated GFR. GFR estimation using standardized serum cystatin C in Japan. Am J Kidney Dis 2013; 61: 197–203.
- 16.
Youn JC, Lee SJ, Lee HS, Oh J, Hong N, Park S, et al. Exercise capacity independently predicts bone mineral density and proximal femoral geometry in patients with acute decompensated heart failure. Osteoporos Int 2015; 26: 2121–2129.
- 17.
Loncar G, Cvetinovic N, Lainscak M, Isaković A, von Haehling S. Bone in heart failure. J Cachexia Sarcopenia Muscle 2020; 11: 381–393.
- 18.
von Haehling S, Ebner N, Dos Santos MR, Springer J, Anker SD. Muscle wasting and cachexia in heart failure: Mechanisms and therapies. Nat Rev Cardiol 2017; 14: 323–341.
- 19.
Liu LC, Voors AA, van Veldhuisen DJ, van der Veer E, Belonje AM, Szymanski MK, et al. Vitamin D status and outcomes in heart failure patients. Eur J Heart Fail 2011; 13: 619–625.
- 20.
Ueland T, Yndestad A, Øie E, Florholmen G, Halvorsen B, Frøland SS, et al. Dysregulated osteoprotegerin/RANK ligand/RANK axis in clinical and experimental heart failure. Circulation 2005; 111: 2461–2468.
- 21.
Leistner DM, Seeger FH, Fischer A, Röxe T, Klotsche J, Iekushi K, et al. Elevated levels of the mediator of catabolic bone remodeling RANKL in the bone marrow environment link chronic heart failure with osteoporosis. Circ Heart Fail 2012; 5: 769–777.
- 22.
Pfister R, Michels G, Sharp SJ, Luben R, Wareham NJ, Khaw KT. Low bone mineral density predicts incident heart failure in men and women: The EPIC (European Prospective Investigation into Cancer and Nutrition)-Norfolk prospective study. JACC Heart Fail 2014; 2: 380–389.
- 23.
Heidrich FE, Stergachis A, Gross KM. Diuretic drug use and the risk for hip fracture. Ann Intern Med 1991; 115: 1–6.
- 24.
Corrao G, Mazzola P, Monzio Compagnoni M, Rea F, Merlino L, Annoni G, et al. Antihypertensive medications, loop diuretics, and risk of hip fracture in the elderly: A population-based cohort study of 81,617 Italian patients newly treated between 2005 and 2009. Drugs Aging 2015; 32: 927–936.
- 25.
Lai SW, Cheng KC, Lin CL, Liao KF. Furosemide use and acute risk of hip fracture in older people: A nationwide case-control study in Taiwan. Geriatr Gerontol Int 2017; 17: 2552–2558.
- 26.
Lim LS, Fink HA, Blackwell T, Taylor BC, Ensrud KE. Loop diuretic use and rates of hip bone loss and risk of falls and fractures in older women. J Am Geriatr Soc 2009; 57: 855–862.
- 27.
Rejnmark L, Vestergaard P, Heickendorff L, Andreasen F, Mosekilde L. Loop diuretics increase bone turnover and decrease BMD in osteopenic postmenopausal women: Results from a randomized controlled study with bumetanide. J Bone Miner Res 2006; 21: 163–170.
- 28.
Lim LS, Fink HA, Kuskowski MA, Taylor BC, Schousboe JT, Ensrud KE; Osteoporotic Fractures in Men (MrOS) Study Group. Loop diuretic use and increased rates of hip bone loss in older men: The Osteoporotic Fractures in Men Study. Arch Intern Med 2008; 168: 735–740.
- 29.
Signorelli SS, Scuto S, Marino E, Giusti M, Xourafa A, Gaudio A. Anticoagulants and Osteoporosis. Int J Mol Sci 2019; 20: E5275.
- 30.
Lutsey PL, Norby FL, Ensrud KE, MacLehose RF, Diem SJ, Chen LY, et al. Association of anticoagulant therapy with risk of fracture among patients with atrial fibrillation. JAMA Intern Med 2019; 180: 245–253.
- 31.
Lau WCY, Cheung CL, Man KKC, Chan EW, Sing CW, Lip GYH, et al. Association between treatment with apixaban, dabigatran, rivaroxaban, or warfarin and risk for osteoporotic fractures among patients with atrial fibrillation. Ann Intern Med, doi:10.7326/M19-3671.
- 32.
Huang HK, Liu PP, Hsu JY, Lin SM, Peng CC, Wang JH, et al. Fracture risks among patients with atrial fibrillation receiving different oral anticoagulants: A real-world nationwide cohort study. Eur Heart J 2020; 41: 1100–1108.
- 33.
Fusaro M, Dalle Carbonare L, Dusso A, Arcidiacono MV, Valenti MT, Aghi A, et al. Differential effects of dabigatran and warfarin on bone volume and structure in rats with normal renal function. PLoS One 2015; 10: e0133847.
- 34.
Klüter T, Weuster M, Brüggemann S, Menzdorf L, Fitschen-Oestern S, Steubesand N, et al. Rivaroxaban does not impair fracture healing in a rat femur fracture model: An experimental study. BMC Musculoskelet Disord 2015; 16: 79.
- 35.
Rocha AL, Bighetti-Trevisan RL, Duffles LF, de Arruda JAA, Taira TM, Assis BRD, et al. Inhibitory effects of dabigatran etexilate, a direct thrombin inhibitor, on osteoclasts and osteoblasts. Thromb Res 2020; 186: 45–53.
- 36.
Ock S, Ahn J, Lee SH, Park H, Son JW, Oh JG, et al. Receptor activator of nuclear factor-κB ligand is a novel inducer of myocardial inflammation. Cardiovasc Res 2012; 94: 105–114.
- 37.
Yoshimura N, Muraki S, Oka H, Mabuchi A, En-Yo Y, Yoshida M, et al. Prevalence of knee osteoarthritis, lumbar spondylosis, and osteoporosis in Japanese men and women: The research on osteoarthritis/osteoporosis against disability study. J Bone Miner Metab 2009; 27: 620–628.