Abstract
Background:
Optical flow ratio (OFR) is a recently developed method for functional assessment of coronary artery disease based on computational fluid dynamics of vascular anatomical data from intravascular optical coherence tomography (OCT). The purpose of this study was to investigate the relationship between OFR and fractional flow reserve (FFR) in stent-treated arteries immediately after percutaneous coronary intervention (PCI).
Methods and Results:
The OFR and FFR were measured in 103 coronary arteries immediately after successful PCI with a stent. An increase in the OFR and FFR values within the stent was defined as in-stent ∆OFR and ∆FFR, respectively. The values of FFR and OFR were 0.89±0.06 and 0.90±0.06, respectively. OFR was highly correlated with FFR (r=0.84, P<0.001). OFR showed a good agreement with FFR, presenting small values of mean difference and root-mean-squared deviation (FFR–OFR: −0.01±0.04). In-stent ∆OFR showed a moderate correlation (r=0.69, P<0.001) and good agreement (in-stent ∆FFR – in-stent ∆OFR: 0.00±0.02) with in-stent ∆FFR.
Conclusions:
OFR showed a high correlation and good agreement with FFR in stent-treated arteries immediately after PCI.
Fractional flow reserve (FFR) is the gold standard for functional assessment of coronary artery stenosis.1
FFR estimates a decrease in coronary blood flow at stenosis by measuring the pressure drop during maximum hyperemia using a pressure guidewire. FFR is used to determine the indication of revascularization and evaluate the acute results of percutaneous coronary intervention (PCI). Several clinical trials have confirmed the clinical value of FFR in the diagnosis and management of coronary artery disease.2
Optical flow ratio (OFR) is a recently developed method for functional assessment of coronary stenosis based on intravascular optical coherence tomography (OCT). With its high resolution and fast pullback, OCT provides an accurate measurement of lumen surface along the entire length of the epicardial coronary artery.3,4
OFR computes the decrease of coronary blood flow at stenosis based on the anatomical OCT information of the lumen without induction of hyperemia.5
Recent studies have shown that OFR is highly correlated with FFR in vessels with de novo stenotic lesions requiring decision-making of revascularization.6
However, the accuracy of OFR in vessels with stent-treated lesions immediately after PCI has not been investigated. As the vessels requiring decision-making of revascularization includes very high and low FFR, the correlation between OFR and FFR become naturally high. This result may not be applicable to vessels presenting with a FFR >0.80 immediately after successful PCI. Furthermore, the stent structure may affect either or both FFR and OFR.
The purpose of this study was to investigate the relationship between OFR and FFR in stent-treated lesions immediately after PCI.
Methods
Study Population
This was a retrospective, single-center, observational study. Between January 2018 and December 2019, we had 156 patients who underwent both OCT and FFR immediately after successful PCI with a stent for de novo stable lesions in a native coronary artery at Wakayama Medical University, Wakayama, Japan. Of these, we excluded 18 patients because the study vessels were associated with previous myocardial infarction (n=12), previous PCI (n=5), or coronary collateral circulation (n=1). In addition, we excluded 35 patients who underwent OCT that did not image the entire stent segment (n=23); OCT using low-molecular dextran for image acquisition (n=2); OCT not suitable for OFR measurement due to image artifact (n=4); FFR using intracoronary nicorandil for maximum hyperemia (n=5); and inadequate FFR pullbacks (n=1). Thus, 103 patients comprised the final study population. The study complied with the Declaration of Helsinki for investigation in human beings. This study was approved by the institutional review board, and written informed consent was waived by the institutional review board because of the retrospective design of the study.
PCI
PCI was performed as per standard instructions. Stent sizing and PCI optimization were performed according to the OPINION and COCOA criteria.7–11
The stent used was the 103 Xience stent (Abbott Vascular, Santa Clara, CA, USA).
OCT
OCT was performed using ILUMIEN OPTIS (Abbott Vascular, Santa Clara, CA, USA). An OCT image catheter was advanced distally to the stent-treated lesion over a 0.014-inch conventional angioplasty guidewire. Contrast media was flushed through the guiding catheter at a rate of 2–4 mL/s for approximately 3–6 s using an injector pump (Mark V; Medrad, PA, USA). When a blood-free image was observed, the OCT imaging core was withdrawn at a rate of 18 or 36 mm/s using an automated pullback device. The OCT images from the distal coronary artery to the aorto-ostial junction were stored digitally.
All OCT images were analyzed by an experienced investigator (H.E.) who was blinded to the FFR results. The OCT analysis was performed on every frame in the stent plus at 5-mm distal and proximal of the edges using a dedicated off-line review system with semi-automated contour-detection software (Abbott Vascular, Santa Clara, CA, USA). Lumen and stent areas were measured automatically and corrected manually if necessary. Reference lumen area, minimum stent area, minimum lumen area, stent expansion index ([minimum lumen area / reference lumen area] × 100), and percent area stenosis ([1−minimum lumen area / reference lumen area] × 100) were measured. Stent underexpansion (stent expansion index <70%), stent malappositon (malaposition distance >150 μm), tissue protrusion (defined as a prolapse of plaque tissue between the struts), thrombus (defined as an intraluminal mass >500 μm in thickness with no direct continuity with the surface of the vessel wall), and stent edge dissection (defined as a disruption of the coronary artery wall at stent edge) were evaluated.7–11
OFR
The OFR computation was performed using OctPlus software (version 1.0; Pulse Medical Imaging Technology, Shanghai, China) by an experienced investigator (H.E.) who was blinded to the FFR results. Details of the computational method and underlying principle of OFR were previously reported by Tu et al.5,6
Briefly, the OFR computation was performed on the basis of lumen geometry from the OCT by using a patient-average hyperemic flow velocity (a fixed velocity of 0.35 m/s) in combination with patient-based reference lumen to evaluate the downstream perfused flow. The OFR value at the distal position of the analysed vessel was used for comparison with FFR. For the vessels requiring 2 different OCT pullbacks to cover the entire coronary artery, OFR computation was performed by each OCT pullback, and the OFR value was combined to generate the final OFR value at the distal position.5,6
In addition, the increase in the OFR values within the stent (defined as in-stent ∆OFR) was calculated by OFR at the proximal stent edge – OFR at the distal end edge. A representative example of postintervention OFR and FFR measurements is shown in
Figure 1.
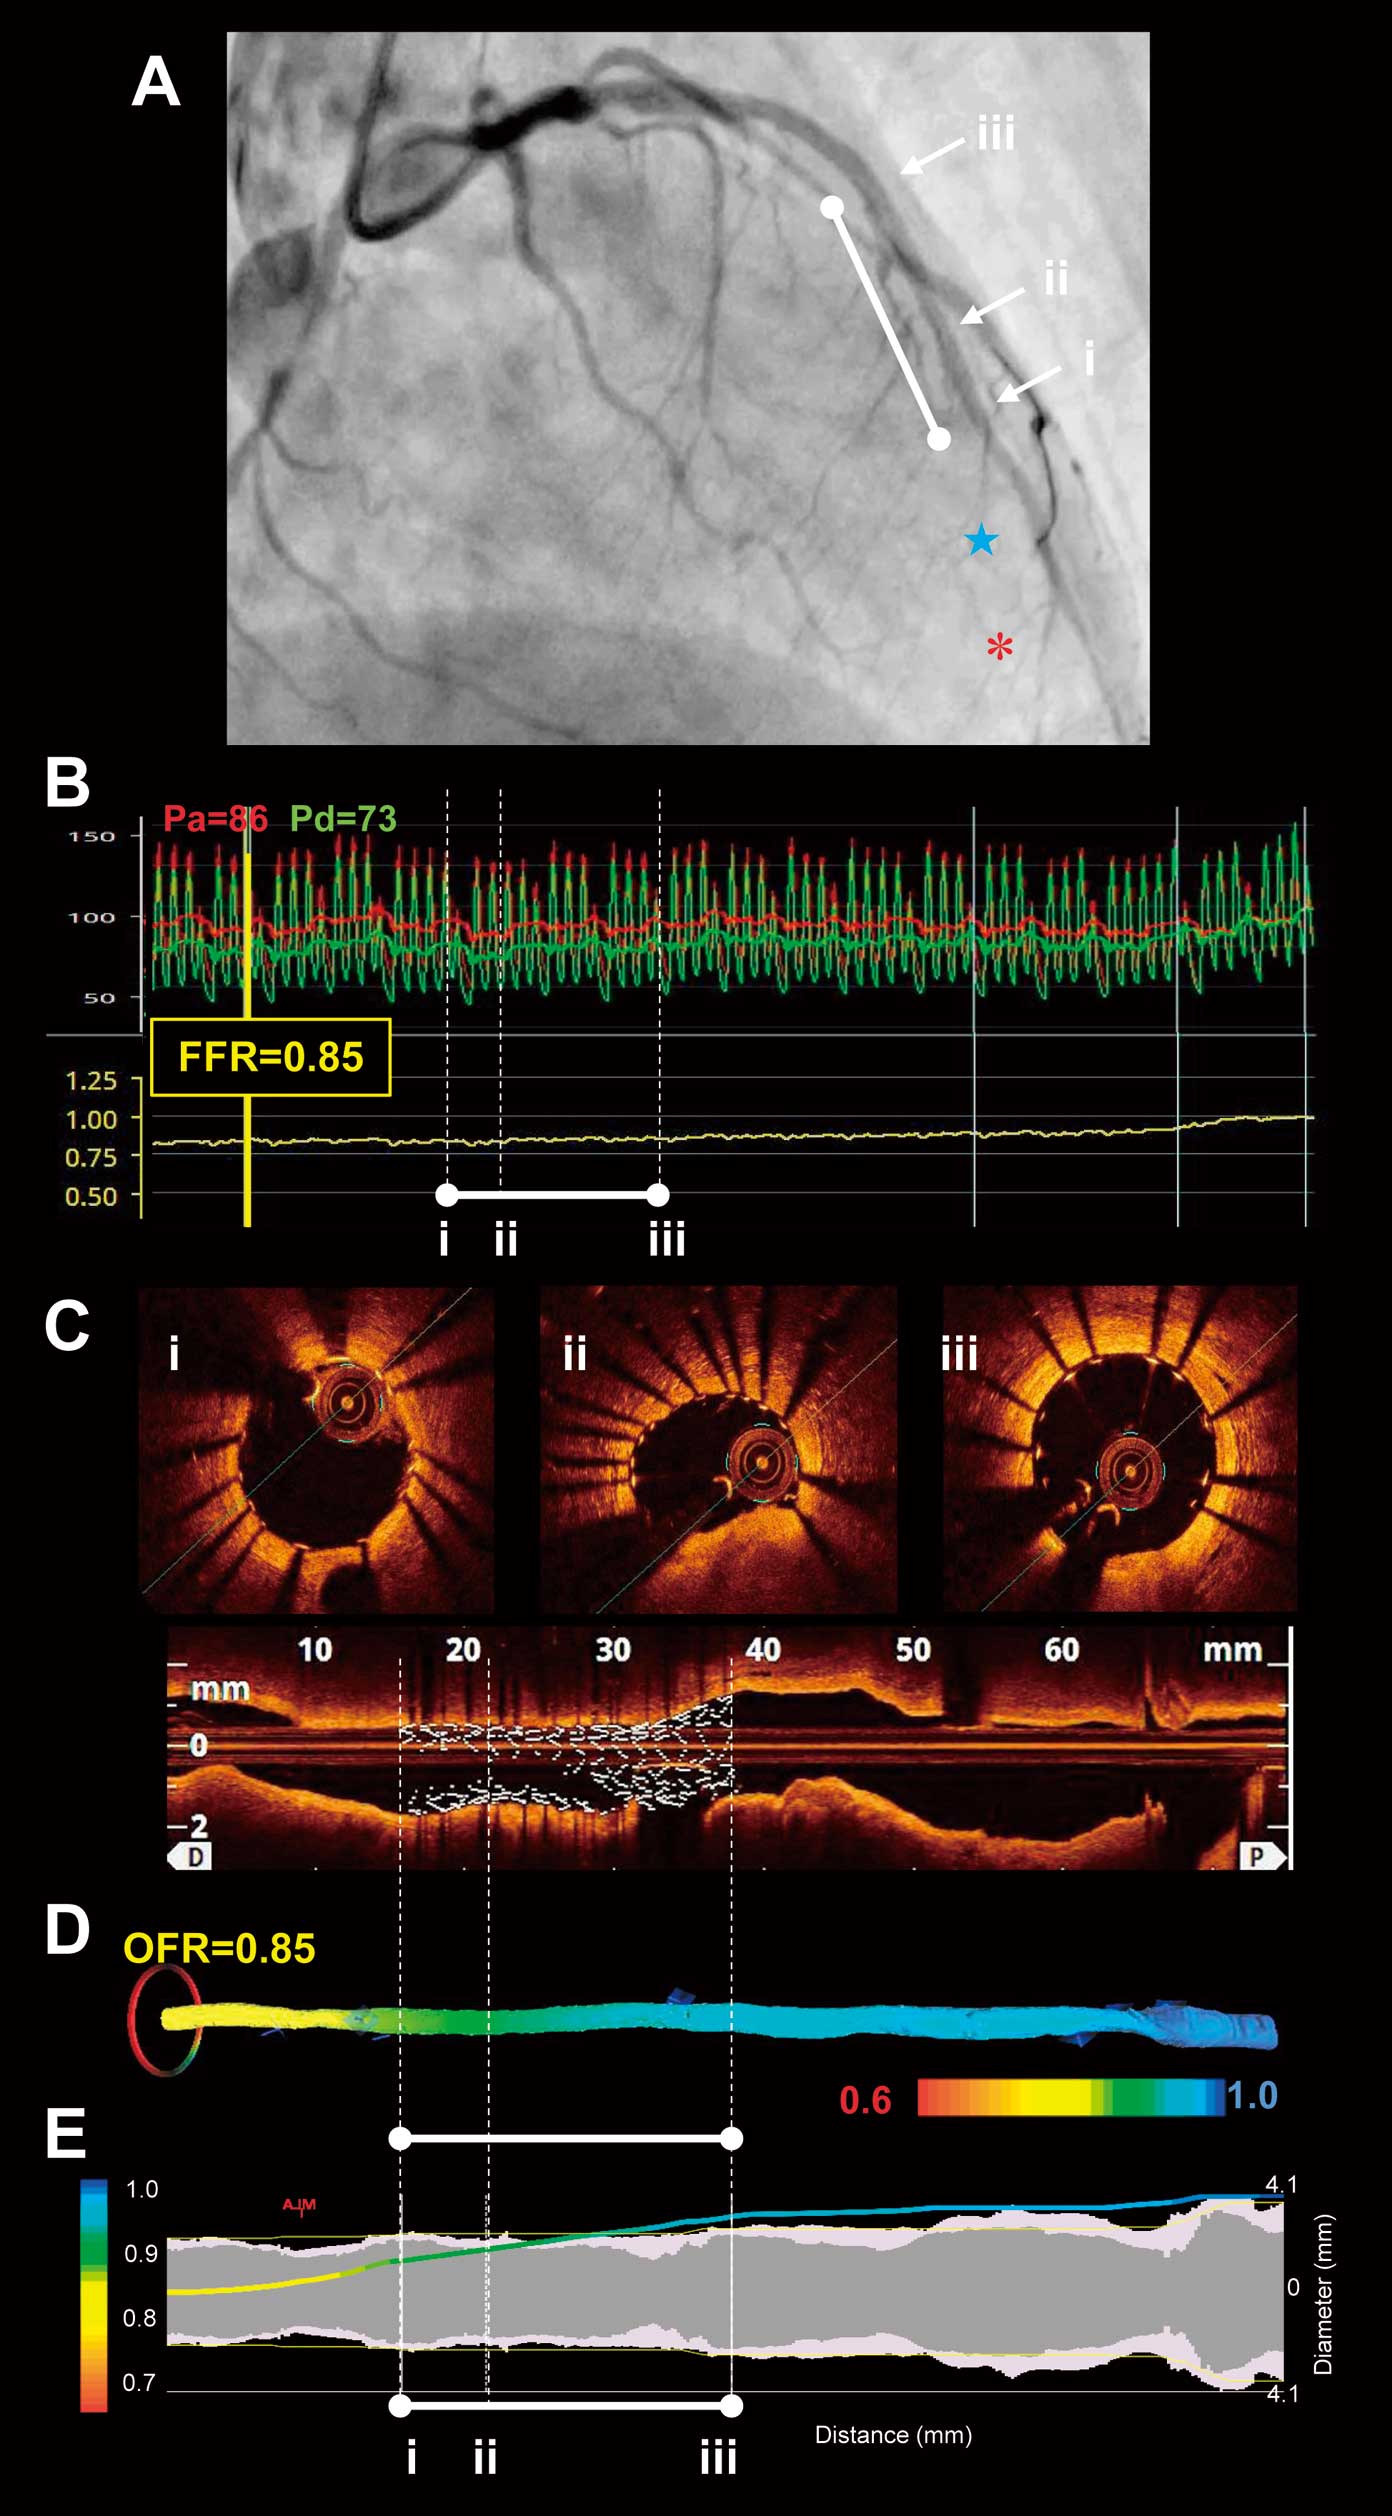
Intracoronary pressure was measured by using a pressure guidewire (PressureWire; Abbot Vascular, Santa Clara, CA, USA).12–14
Following the calibration and equalization of pressure/temperature signals, the pressure guidewire was introduced into the far distal coronary artery beyond the stent-treated lesion. Maximal hyperemia was induced by intravenous continuous infusion of adenosine 5’-triphosphate at 180 μg/kg/min via the forearm vein. FFR was calculated as the mean distal coronary pressure (Pd, measured by the pressure guidewire) at the far distal coronary artery divided by the mean aortic pressure (Pa, simultaneously measured by the guiding catheter) during maximal hyperemia. Subsequently, during steady-state maximal hyperemia, the pressure guidewire was manually pulled back while the location of the pressure sensor was monitored by fluoroscopy. Pd/Pa was noted at stent distal and proximal edges. The increase in the FFR values within the stent (defined as In-stent ∆FFR) was calculated by Pd/Pa at the proximal stent edge – Pd/Pa at the distal end edge. When the pressure sensor was pulled back in the guiding catheter, both pressures were checked to exclude any transducer drift.
Statistical Analysis
Statistical analysis was performed by using JMP 13.0 (SAS Institute, Cary, NC, USA). Categorical variables were presented as counts and percentages. Continuous variables were presented as mean±standard deviation. Pearson correlation was used to quantify the correlations between OFR and FFR. Agreements between QFR and FFR were assessed by using the Bland-Altman plot. The Bland-Altman plot depicted the differences of each pair of measurements vs. their mean values, with reference lines for the mean difference of all paired measurements. The limits of agreement were defined as mean ±1.96 standard deviation of absolute difference.
Results
Patient and Lesion Characteristics
Patient and lesion characteristics are shown in
Table 1. The mean age of the patient was 68±10 years and 85 (83%) were male. The frequency of hypertension, dyslipidemia, and diabetes mellitus was 87%, 64%, and 45%, respectively. The stent-treated lesions were predominantly located in the proximal or mid left anterior descending coronary artery. The frequency of 1-stent use and 2-stent use was 83% and 17%, respectively. Stent diameter was 3.0±0.4 mm. Total stent length was 26±10 mm.
Table 1.
Patient and Lesion Characteristics
| Variable |
n=103 |
| Patients |
| Age, years |
68±10 |
| Male |
85 (83) |
| Hypertension |
90 (87) |
| Dyslipidemia |
66 (64) |
| Diabetes mellitus |
46 (45) |
| Vessel |
| LAD |
70 (68) |
| LCX |
18 (17) |
| RCA |
15 (15) |
| Lesion location |
| Proximal |
48 (47) |
| Mid |
48 (47) |
| Distal |
7 (6) |
| Stent |
| 1 stent |
86 (83) |
| 2 stents |
17 (17) |
| Stent diameter, mm |
3.0±0.4 |
| Total stent length, mm |
26±10 |
Values are presented as n (%) or mean±standard deviation. LAD, left anterior descending artery; LCX, left circumflex artery; RCA, right coronary artery.
The OCT findings are shown in
Table 2. The average length of the OCT pullback was 57±12 mm. Reference lumen area, minimum stent area, and minimum lumen area were 6.9±2.1 mm2, 5.2±1.8 mm2, and 5.2±1.7 mm2, respectively. Stent expansion index was 77±9%. Percentage of area stenosis was 25±9%. The frequency of stent underexpansion, stent malapposition, tissue protrusion, thrombus, and stent edge dissection were 21%, 18%, 12%, 0%, and 12%, respectively.
Table 2.
OCT Findings
| Variable |
n=103 |
| Analyzed OCT pullback length, mm |
57±12 |
| Reference lumen area, mm2 |
6.9±2.1 |
| Minimum stent area, mm2 |
5.3±1.8 |
| Minimum lumen area, mm2 |
5.2±1.7 |
| Stent expansion index, % |
80±9 |
| Percent area stenosis, % |
20±9 |
| Underexpansion |
16 (16) |
| Malappositon |
19 (18) |
| Tissue protrusion |
12 (12) |
| Thrombus |
0 (0) |
| Dissection |
12 (12) |
Values are presented as n (%) or mean±standard deviation. OCT, optical coherence tomography.
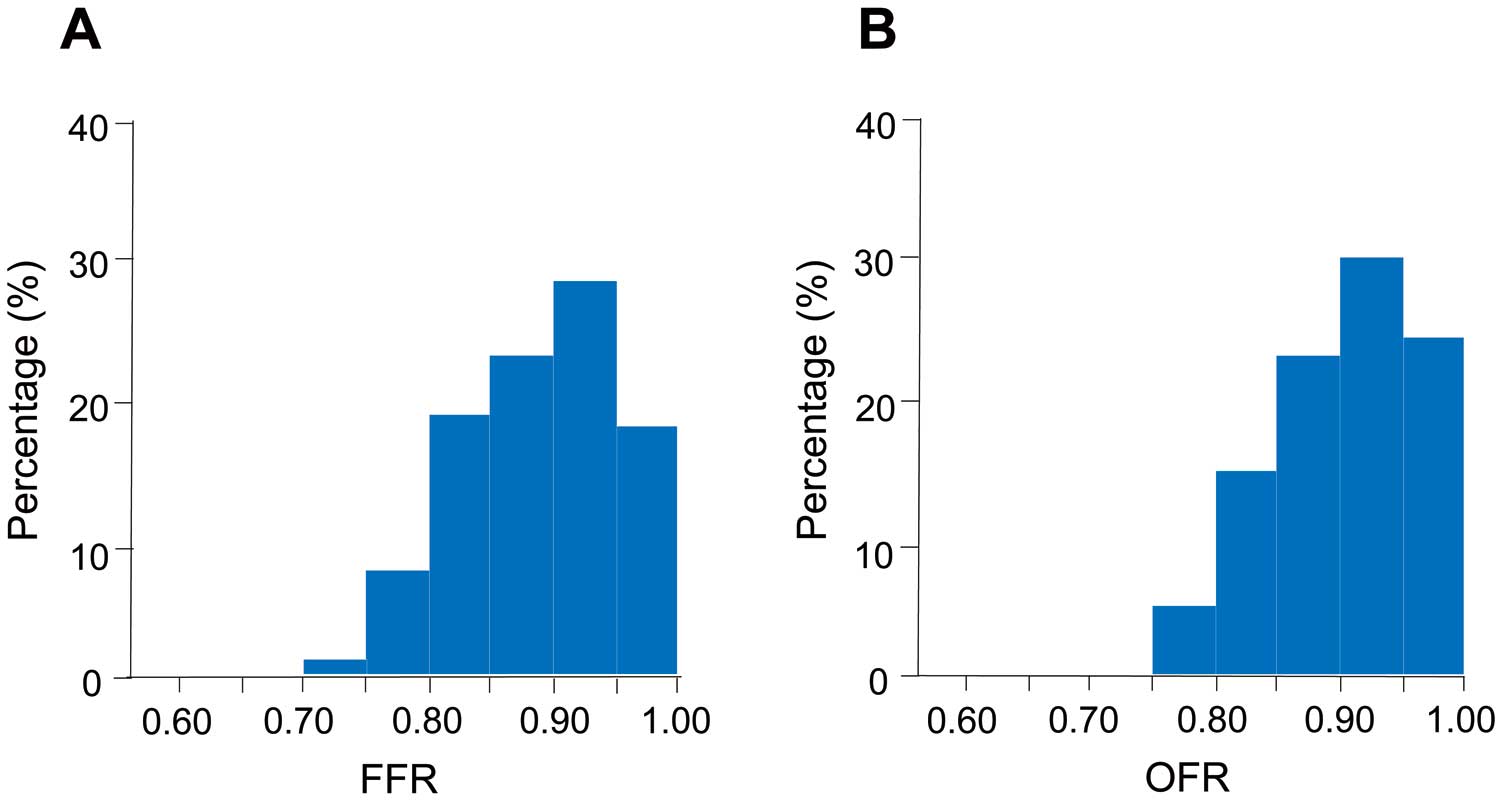
The FFR and OFR results are shown in
Figure 2
and
Table 3. The values of FFR and in-stent ∆FFR were 0.89±0.06 and 0.04±0.03, respectively. The values of OFR and in-stent ∆OFR were 0.90±0.06 and 0.04±0.02, respectively. The time required to calculate the OFR in a vessel was 68±14s. Correlations and agreements between OFR and FFR are shown in
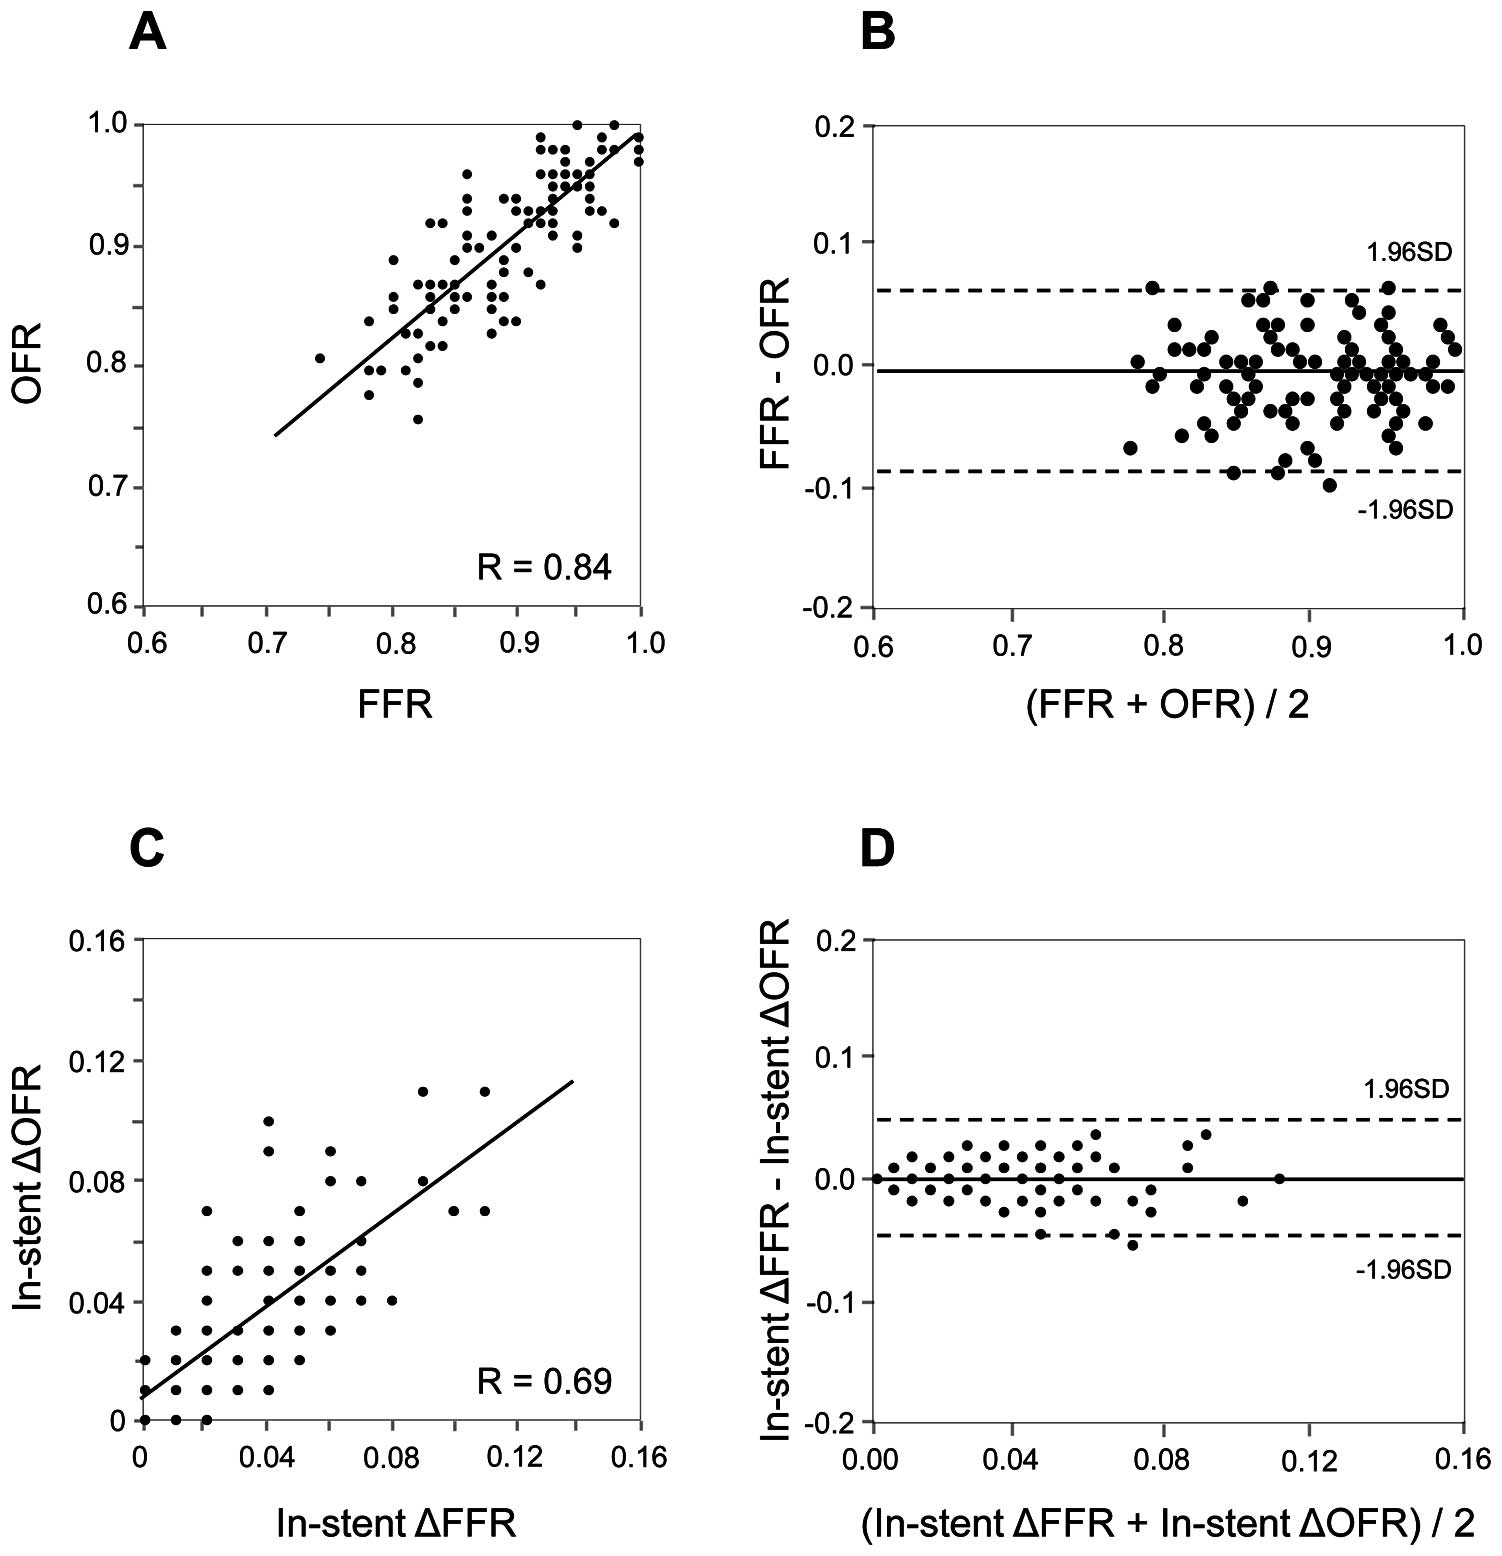
Figure 3A
and
3B. OFR was highly correlated with FFR (r=0.84, P<0.001). OFR showed a good agreement with FFR, presenting small values of mean difference and root-mean-squared deviation (FFR–OFR: −0.01±0.04). In addition, in-stent ∆OFR showed a moderate correlation (r=0.69, P<0.001) and good agreement (in-stent ∆FFR – in-stent ∆OFR: 0.00±0.02) with in-stent ∆FFR (Figure 3C
and
3D).
Table 3.
FFR and OFR Results
| Variable |
n=103 |
| FFR |
| FFR |
0.89±0.06 |
| ΔFFR (in-stent) |
0.04±0.03 |
| OFR |
| OFR |
0.90±0.06 |
| ΔOFR (in-stent) |
0.04±0.02 |
| OFR analysis time, s |
68±14 |
Values are presented as mean±standard deviation or n (%). FFR, fractional flow reserve; OFR, optical flow ratio.
Discussion
The present study showed that there was a high correlation and good agreement between OFR and FFR in the coronary artery with a stent-treated lesion. OFR might be reliable for the functional assessment of stent-treated arteries immediately after PCI.
Virtual FFR
Recently, imaging-based techniques have emerged that allow the functional assessment of coronary artery disease by using computational fluid dynamics of vascular anatomical data. Computed tomography-derived FFR (FFRCT) calculates FFR using virtual data of coronary blood flow, perfusion area, and microvascular circulation obtained from anatomical information of a coronary CT angiography. Quantitative flow ratio (QFR) estimates pressure drop due to coronary stenosis according to 3-dimensional quantitative coronary angiography and virtual hyperemic flow derived from contrast frame count. Recent studies have shown that both FFRCT and QFR were highly correlated with wire-based FFR.12–14
OFR calculates a virtual FFR value based on the lumen geometry reconstructed from OCT. As OCT has a higher spatial resolution compared with CT or angiography, OFR may be able to accurately predict FFR.
OFR in Stent Optimization
OCT plays an important role in stent optimization. Larger stent area measured by OCT immediately after PCI is associated with a better PCI outcome.3,4
OCT-detected major stent malapposition, tissue protrusions, thrombi, and stent edge dissections are targets for post-dilatation or additional stenting.3,4
OFR adds a functional assessment of the stent. The combination of OCT and OFR has great potential to provide more accurate prediction of lesion prognosis. Further research is needed to determine the optimal cut-off value of OFR immediately after PCI for predicting a better PCI outcome.
OFR vs. FFR in PCI
OCT is not recommended for routine use in PCI. OFR will serve as an alternative to FFR in cases requiring both anatomical guidance and functional assessment during PCI. OFR does not require the use of pressure wires and pharmacological hyperemic agents for measurements. Therefore, OFR may reduce the time and cost for catheterization in those selected cases.
Study Limitations
There are several limitations that should be acknowledged. First, this was a single-center, retrospective study, hence, there is a possibility of having selection bias. Second, OFR might have been measured at a more proximal site than FFR, because OCT catheters cannot be placed into the more distal coronary arteries as compared with pressure wires. Third, the present study excluded the vessels related to prior MI. A previous study suggested that the correlation between OFR and FFR may be lower in vessels related to prior MI.6
Fourth, inappropriate cases for OCT-guiding PCI, such as the cases with an aorto-ostial lesion, severe renal insufficiency and congestive heart failure, were potentially excluded. Finally, the subject of the study consisted of well-optimized stents. Further research is needed to assess the ability of OFR to detect hemodynamic changes in sub-optimal stents (e.g., large stent malappositions and edge dissections).
Conclusions
The OFR showed a high correlation and good agreement with FFR in stent-treated arteries immediately after PCI.
Disclosures
T.A. has received lecture fees and research grants from Abbott Vascular. T.K. has received lecture fees from Abbott Vascular. S.T. has received research grants from Pulse Medical Imaging Technology. All other authors have no relationships relevant to the contents of this paper to disclose.
T.A. is a member of
Circulation Journal
’ Editorial Team.
IRB Information
This study was approved by the Wakayama Medical University Ethics Committee (reference number 2974).
References
- 1.
Neumann FJ, Sousa-Uva M, Ahlsson A, Alfonso F, Banning AP, Benedetto U, et al; ESC Scientific Document Group. 2018 ESC/EACTS Guidelines on myocardial revascularization. Eur Heart J 2019; 40: 87–165.
- 2.
Levine GN, Bates ER, Blankenship JC, Bailey SR, Bittl JA, Cercek B, et al. 2011 ACCF/AHA/SCAI Guideline for Percutaneous Coronary Intervention: A report of the American College of Cardiology Foundation/American Heart Association Task Force on Practice Guidelines and the Society for Cardiovascular Angiography and Interventions. Circulation 2011; 124: 574–651.
- 3.
Räber L, Mintz GS, Koskinas KC, Johnson TW, Holm NR, Onuma Y, et al; ESC Scientific Document Group. Clinical use of intracoronary imaging. Part 1: Guidance and optimization of coronary interventions. An expert consensus document of the European Association of Percutaneous Cardiovascular Interventions. Eur Heart J 2018; 39: 3281–3300.
- 4.
Fujii K, Kubo T, Otake H, Nakazawa G, Sonoda S, Hibi K, et al. Expert consensus statement for quantitative measurement and morphological assessment of optical coherence tomography. Cardiovasc Interv Ther 2020; 35: 13–18.
- 5.
Yu W, Huang J, Jia D, Chen S, Raffel OC, Ding D, et al. Diagnostic accuracy of intracoronary optical coherence tomography-derived fractional flow reserve for assessment of coronary stenosis severity. EuroIntervention 2019; 15: 189–197.
- 6.
Huang J, Emori H, Ding D, Kubo T, Yu W, Huang P, et al. Diagnostic performance of intracoronary optical coherence tomography-based versus angiography-based fractional flow reserve for the evaluation of coronary lesions. EuroIntervention 2020; 16: 568–576.
- 7.
Kubo T, Shinke T, Okamura T, Hibi K, Nakazawa G, Morino Y, et al. Optical frequency domain imaging vs. intravascular ultrasound in percutaneous coronary intervention (OPINION trial): Study protocol for a randomized controlled trial. J Cardiol 2016; 68: 455–460.
- 8.
Kubo T, Shinke T, Okamura T, Hibi K, Nakazawa G, Morino Y, et al; OPINION Investigators. Optical frequency domain imaging vs. intravascular ultrasound in percutaneous coronary intervention (OPINION trial): One-year angiographic and clinical results. Eur Heart J 2017; 38: 3139–3147.
- 9.
Otake H, Kubo T, Takahashi H, Shinke T, Okamura T, Hibi K, et al; OPINION Investigators. Optical frequency domain imaging versus intravascular ultrasound in percutaneous coronary intervention (OPINION trial): Results from the OPINION imaging study. JACC Cardiovasc Imaging 2018; 11: 111–123.
- 10.
Kubo T, Shinke T, Okamura T, Hibi K, Nakazawa G, Morino Y, et al. Comparison between Optical COherence tomography guidance and Angiography guidance in percutaneous coronary intervention (COCOA): Study protocol for a randomized controlled trial. J Cardiol 2018; 72: 170–175.
- 11.
Otake H, Kubo T, Shinke T, Hibi K, Tanaka S, Ishida M, et al. OPtical frequency domain imaging vs. INtravascular ultrasound in percutaneous coronary InterventiON in patients with acute coronary syndrome: Study protocol for a randomized controlled trial. J Cardiol 2020; 76: 317–321.
- 12.
Tanigaki T, Emori H, Kawase Y, Kubo T, Omori H, Shiono Y, et al. QFR vs. FFRCT for functional assessment of coronary artery stenosis. JACC Cardiovasc Interv 2019; 12: 2050–2059.
- 13.
Emori H, Kubo T, Kameyama T, Ino Y, Matsuo Y, Kitabata H, et al. Quantitative flow ratio and instantaneous wave-free ratio for the assessment of the functional severity of intermediate coronary artery stenosis. Coron Artery Dis 2018; 29: 611–617.
- 14.
Emori H, Kubo T, Kameyama T, Ino Y, Matsuo Y, Kitabata H, et al. Diagnostic accuracy of quantitative flow ratio for assessing myocardial ischemia in prior myocardial infarction. Circ J 2018; 82: 807–814.