Abstract
Background:
The association between unfavorable post-stent optical coherence tomography (OCT) findings and subsequent stent thrombosis (ST) remains unclear. This study investigated the ST-related characteristics of post-stent OCT findings at index percutaneous coronary intervention (PCI).
Methods and Results:
Fifteen patients with ST onset after OCT-guided PCI (ST group) were retrospectively enrolled. Post-stent OCT findings in the ST group were compared with those in 70 consecutive patients (reference group) without acute coronary syndrome onset for at least 5 years after OCT-guided PCI. The incidence of acute myocardial infarction (AMI) was higher in the ST than reference group (60.0% vs. 17.1%, respectively; P=0.0005). The incidence of incomplete stent apposition (93.3% vs. 55.7%; P=0.0064), irregular protrusion (IP; 93.3% vs. 62.8%; P=0.0214), and thrombus (93.3% vs. 51.4%; P=0.0028) was significantly higher in the ST than reference group. The maximum median (interquartile range) IP arc was significantly larger in the ST than reference group (265° [217°–360°] vs. 128° [81.4°–212°], respectively; P<0.0001). In AMI patients, the incidence of a maximum IP arc >180° was significantly higher in the ST than reference group (100% vs. 58.3%, respectively; P=0.0265).
Conclusions:
IP with a large arc was a significant feature on post-stent OCT in patients with ST.
Stent thrombosis (ST) that presents as acute coronary syndrome (ACS) or sudden cardiac death is an uncommon but highly morbid complication after percutaneous coronary intervention (PCI).1,2
Despite the fact that new-generation drug-eluting stents (DES) have decreased the occurrence of ST,3
recent studies have shown that ST is becoming an increasingly common cause of ST-segment elevation myocardial infarction (STEMI) and is associated with a higher incidence of adverse outcomes than de novo coronary thrombosis.4,5
The introduction of optical coherence tomography (OCT), a high-resolution intracoronary imaging technique, allows for the accurate identification of suboptimal stent deployment; this is characterized by stent edge dissection (SED), plaque prolapse, stent malapposition, and/or thrombus and stent underexpansion, and is correlated with the occurrence of major adverse coronary events.6,7
In particular, the Massachusetts General Hospital (MGH) OCT Registry,6
which investigated the association between post-stent OCT findings and major cardiovascular events, reported that irregular protrusion (IP) and small minimum stent area (MSA) were independent predictors of device-oriented clinical endpoints, including cardiac death, target vessel-related myocardial infarction, target lesion revascularization, and ST. However, the association between suboptimal post-stent OCT findings and ST onset remains unclear.
The aim of the present study was to investigate the ST-related characteristics of post-stent OCT findings obtained at index PCI.
Methods
Study Populations
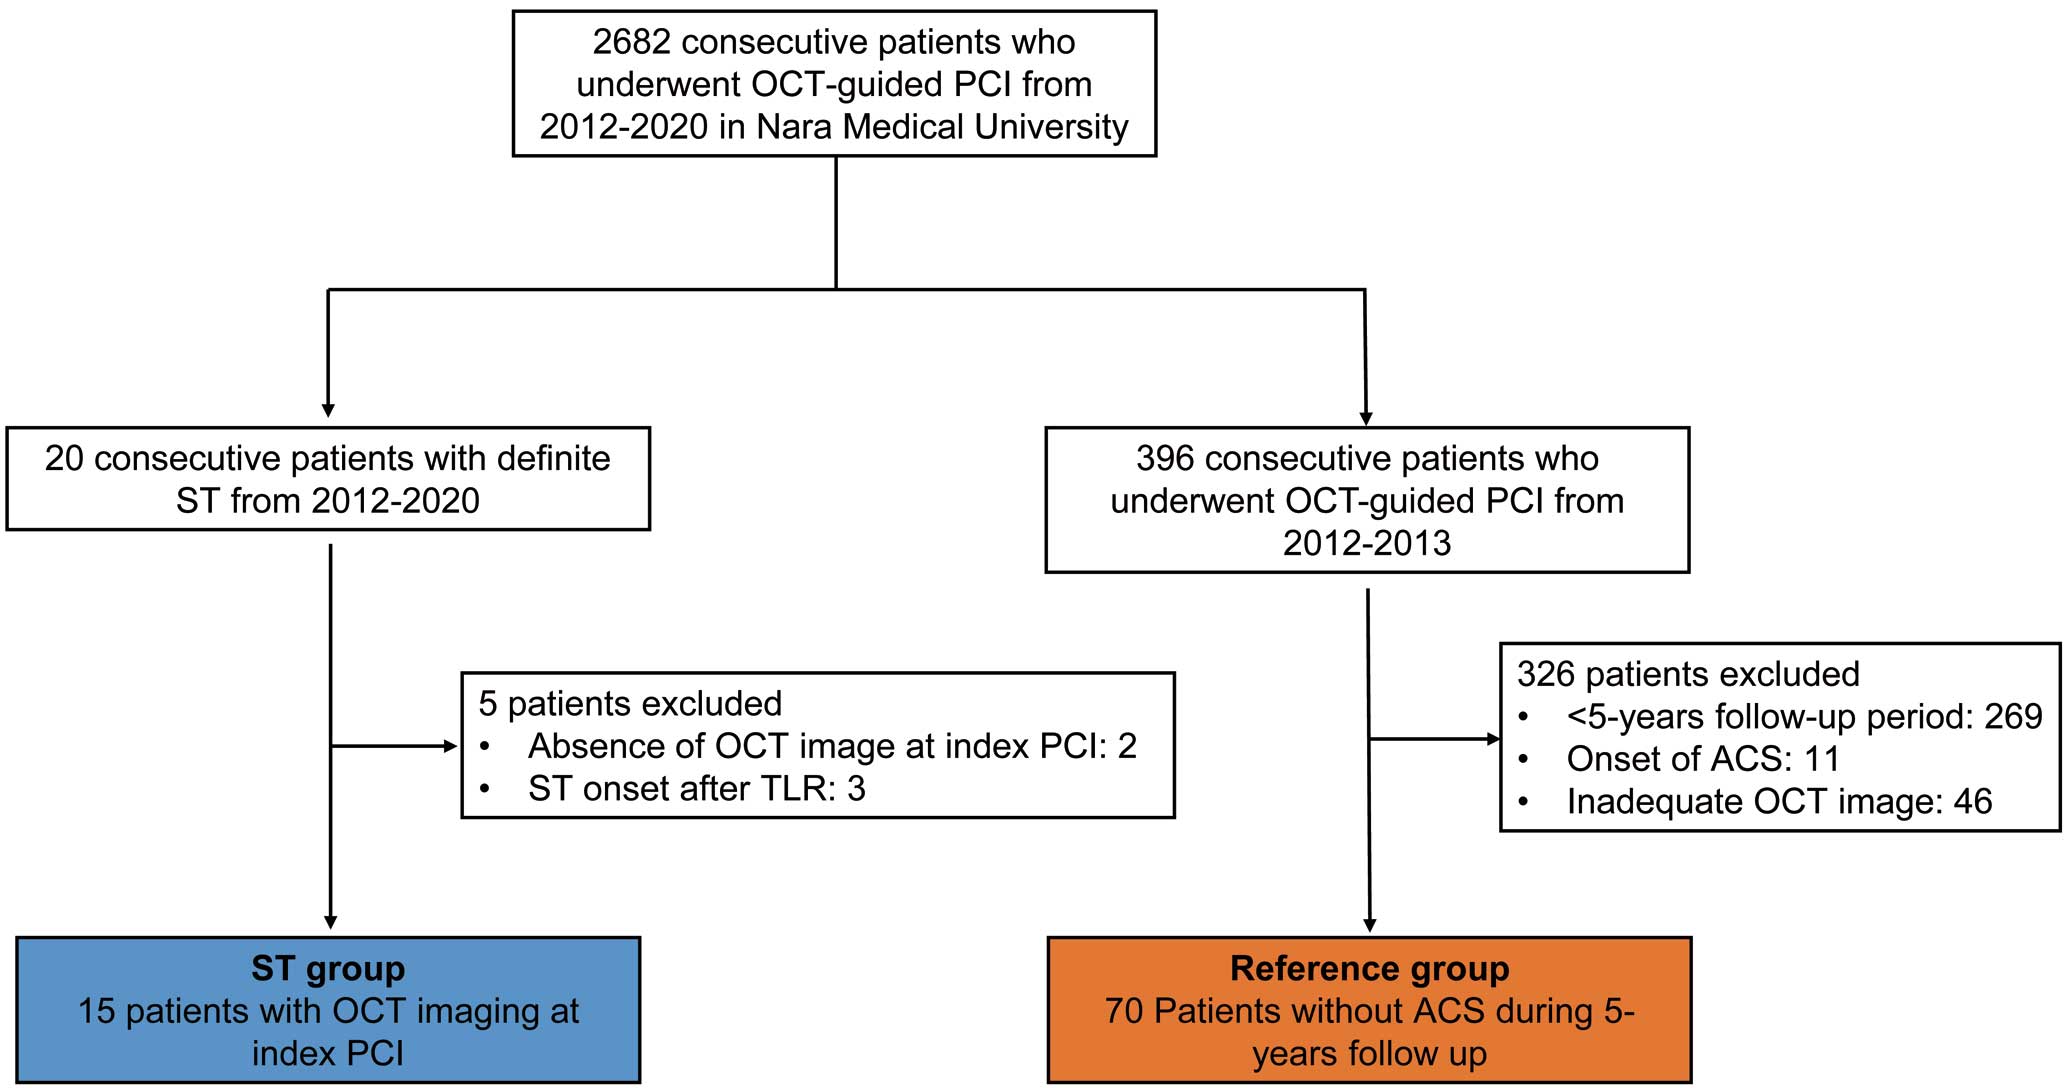
Of 2,682 patients who underwent OCT-guided PCI at Nara Medical University between January 2012 and April 2020, 20 (0.75%) were identified as having definite ST after index PCI. Five of these 20 patients were excluded due to missing OCT images after the final PCI procedure or ST onset after target lesion revascularization for in-stent restenosis. Finally, 15 patients (ST group) who underwent OCT examination after the final ‘index PCI procedure’ (i.e., the most recent stent implantation in the culprit vessel prior to ST) were analyzed in this study (Figure 1). As a reference group, 70 patients without ACS onset for at least 5 years after index PCI were selected from among 396 consecutive patients who underwent OCT-guided stenting at Nara Medical University between January 2012 and March 2013 (Figure 1). ACS onset was confirmed by clinical records after index PCI. For patients in the reference group who underwent multivessel PCI with a one-time or staged strategy, the first stent implanted was analyzed in the present study.
Definite ST was defined according to the Academic Research Consortium8
criteria and required angiographic confirmation of thrombus in the stent or within 5 mm to either side of it. Further categorization was based on timing: early ST (EST; 0–30 days after stent placement), late ST (LST; 30 days–1 year), and very late ST (VLST; >1 year).
This study was approved by the Ethics Committee of Nara Medical University (Approval no. 1759-2) and complied with the Declaration of Helsinki Ethical Principles for Medical Research Involving Human Subjects. Written informed consent was given by all patients before enrollment.
OCT Image Acquisition and PCI Procedure
OCT imaging was performed using a frequency-domain OCT system (C8 System, Dragonfly Imaging Catheter, and ILUMIEN OPTIS; St. Jude Medical, St. Paul, MN, USA) and optical frequency-domain imaging (LUNAWAVEVR; Terumo Corporation, Tokyo, Japan). Briefly, the OCT imaging catheter was advanced distal to the target lesion over a conventional 0.014-inch angioplasty guidewire through a 6- or 7-Fr guiding catheter. After intracoronary administration of 1 mg isosorbide dinitrate, pullbacks were performed during continuous injection of X-ray contrast medium or lactated low molecular weight dextran at a rate of 2.5–3.5 mL/s through the guiding catheter using an injection pump to remove blood from the field of view and to allow for clear visualization of the vessel wall. Images were acquired at a rate of 5 frames/mm and an automated pullback speed of 20 mm/s.9
PCI was performed using standard techniques and catheters via the femoral or radial approach according to the standard protocol of Nara Medical University. OCT examination was performed after the final PCI procedure. After the index PCI, patients were maintained on aspirin (100 mg, once daily) and ticlopidine (200 mg, twice daily) or clopidogrel (75 mg, once daily) for at least 8–12 months unless they had risk factors for bleeding.
OCT Data Analysis
Qualitative analysis included evaluation for SED, in-stent dissection (ISD), incomplete stent apposition (ISA), in-stent tissue protrusion (smooth protrusion, disrupted fibrous tissue protrusion, and IP), and thrombus. For qualitative analysis, all cross-sectional images within the entire stent length and within 5-mm persistent segments were analyzed. When more than 2 consecutive frames could not be analyzed owing to residual blood or artifacts, the case was considered to have poor image quality and was excluded.
SED was defined as the disruption of the vessel luminal surface by a visible flap at the stent edge or in reference segments 5 mm proximal and distal to the stent (Figure 2A).10,11
ISD was defined as disruption of the luminal vessel surface within the stented segment (Figure 2B).10
ISA was defined as separation of the inner surface of a stent strut from the inner vessel wall, in segments without a side branch, by a distance greater than or equal to the axial resolution of OCT plus the width of the stent strut of each stent type, including the polymer coating (Figure 2C).12,13
When stent struts with ISA were detected, we measured the ISA distance, defined as the distance between the inner surface of the stent strut and the inner surface of the vessel wall. The maximum ISA distance was determined as the longest distance in 3 candidate frames selected by visual screening of all cross-sectional images of a stented segment.

In-stent tissue protrusion was divided into 3 categories: smooth protrusion, disrupted fibrous tissue protrusion, and IP (Figure 2D–F).6
Smooth protrusion was defined as the bowing of plaque into the lumen between stent struts, without intimal disruption, appearing as a smooth semicircular arc connecting adjacent struts, and likely representing compression of soft plaque by the stent. Disrupted fibrous tissue protrusion was defined as disruption of underlying fibrous tissue that protruded between stent struts into the lumen. IP was defined as protrusion of material with an irregular surface into the lumen between stent struts. When IP was detected, the IP arc was measured with a protractor centered on the lumen. If there were 2 or more segments of IP in a single frame, the IP arc of the frame was defined as the sum of the IP arcs (Figure 2G). The maximum IP arc was defined as the largest arc in 3 candidate frames selected by visual screening of all cross-sectional images of a stented segment. The IP arc was measured at 1-mm intervals throughout the entire stent length, and measurements were averaged. IP length was calculated based on the number of frames with IP. IP volume index was defined as mean IP arc multiplied by IP length. Because struts are sometimes buried within the intima, we only analyzed in-stent protrusions with a maximum height ≥100 μm.
Thrombus was defined as a mass with a diameter ≥250 μm attached to the luminal surface, a stent strut, or floating within the lumen (Figure 2H).13
When thrombus could not be completely differentiated from IP, we categorized it as IP. The MSA was defined as the smallest area in all cross-sectional images of a stented segment. ‘Small’ MSA was defined as <5.0 mm2
for DES and <5.6 mm2
for bare metal stents.6
Pre-stent plaque tissue characterization13,14
was performed at PCI culprit lesions. Lipid-rich plaques were defined as plaques with maximum lipid arc of >90°. Thin-cap fibroatheroma (TCFA) was defined as a lipid-rich plaque with a fibrous cap thickness ≤65 μm. Calcification was defined as low signal intensity areas with sharply delineated borders.
In 11 patients who underwent OCT-guided PCI at ST onset, OCT assessments were performed at culprit lesions after thrombectomy or predilatation using a 1.5-mm small size balloon catheter. An uncovered strut was defined as a stent strut without neointimal tissue and with any part of the strut visibly exposed to the lumen.13,15
Neoatherosclerosis was defined as the combination of neointimal diffuse thickening with atherosclerotic plaque including lipid-laden intima, the presence of a fibrous cap, and potential neointimal rupture or fibrocalcific plaque.15
OCT images were evaluated using off-line analysis software at the Nara Medical University OCT Core Laboratory. All OCT images were analyzed by 2 independent investigators (A.K. and M.W.) who were blinded to the patients’ information. When investigators disagreed, a consensus reading was obtained from a third independent investigator (T.S.).
Statistical Analysis
All analyses were performed using JMP Statistics version 11 (SAS Institute, Cary, NC, USA). All values are expressed as the mean±SD or as the median with interquartile range (IQR) for continuous variables and counts and percentages for categorical variables. Continuous variables were compared using parametric 1-way analysis of variance or the non-parametric Kruskal-Wallis test on the basis depending on the normality of a variable’s distribution. Categorical data were evaluated using the Pearson Chi-squared test. Two-sided P<0.05 was considered significant.
Results
Table 1
summarizes the clinical characteristics of patients at ST onset. There were 5 cases of EST, 4 of LST, and 6 of VLST. The median interval from index PCI to ST onset was 271 days (IQR 6–1,064 days). The clinical diagnosis at ST onset was STEMI in 12 patients and non-STEMI (NSTEMI) in 3 patients. Eleven patients were receiving dual-antiplatelet therapy at ST onset, 2 were receiving single antiplatelet therapy, 1 was receiving oral anticoagulation therapy, and 1 was not receiving any antithrombotic therapy.
Table 1.
Clinical Characteristics at the Onset of ST
Patient
no. |
Age
(years) |
Sex |
Diagnosis |
ST
type |
Interval
to ST
(days) |
Culprit
vessel |
No.
diseased
vessels |
EF (%) |
Antithrombotic
drug |
Lipid-
lowering
therapy |
Risk
factor |
| 1 |
54 |
M |
NSTEMI |
EST |
0 |
LAD |
1 |
54 |
DAPT |
Strong
statin |
DL |
| 2 |
78 |
F |
STEMI |
EST |
2 |
LAD |
2 |
20 |
DAPT |
– |
HT |
| 3 |
65 |
M |
STEMI |
EST |
4 |
LAD |
3 |
56 |
DAPT |
Strong
stain |
DL, DM |
| 4 |
61 |
M |
STEMI |
EST |
6 |
LAD |
1 |
50 |
DAPT |
Standard
statin |
HT, DL, DM,
smoking |
| 5 |
72 |
M |
STEMI |
EST |
12 |
LAD |
1 |
28 |
DAPT, OAC |
– |
DL, DM,
smoking |
| 6 |
73 |
M |
NSTEMI |
LST |
199 |
RCA |
1 |
22 |
DAPT |
Strong
statin |
HT, DL,
dialysis |
| 7 |
64 |
M |
STEMI |
LST |
254 |
RCA |
2 |
71 |
DAPT |
– |
HT, DL,
smoking |
| 8 |
35 |
M |
STEMI |
LST |
271 |
RCA |
1 |
40 |
DAPT |
– |
DL, smoking |
| 9 |
70 |
M |
NSTEMI |
LST |
284 |
LAD |
2 |
50 |
DAPT |
– |
HT, DL |
| 10 |
62 |
M |
STEMI |
VLST |
547 |
RCA |
1 |
39 |
None |
Strong
stain |
HT, DL, DM,
smoking |
| 11 |
77 |
F |
STEMI |
VLST |
958 |
LAD |
1 |
50 |
SAPT |
Standard
statin |
HT, DL, DM |
| 12 |
47 |
M |
STEMI |
VLST |
1,064 |
LAD |
1 |
39 |
OAC |
– |
DL, DM,
smoking |
| 13 |
44 |
M |
STEMI |
VLST |
2,020 |
LAD |
2 |
49 |
DAPT |
– |
HT, DL, DM,
smoking |
| 14 |
67 |
M |
STEMI |
VLST |
2,075 |
RCA |
1 |
51 |
DAPT |
Strong
stain |
HT, DL, DM,
smoking |
| 15 |
71 |
M |
STEMI |
VLST |
2,688 |
LAD |
2 |
46 |
SAPT |
– |
HT, DL,
smoking |
DAPT, dual antiplatelet therapy; DL, dyslipidemia; DM, diabetes mellitus; EF, ejection fraction; EST, early stent thrombosis; F, female; HT, hypertension; LAD, left anterior descending artery; LST, late stent thrombosis; M, male; NSTEMI, non-ST-segment elevation myocardial infarction; OAC, oral anticoagulants; RCA, right coronary artery; SAPT, single antiplatelet therapy; ST, stent thrombosis; STEMI, ST-segment elevation myocardial infarction; VLST, very late stent thrombosis.
Post-stent OCT findings at index PCI and preprocedural OCT findings at ST onset in each patient with ST are presented in
Table 2. The clinical diagnosis at index PCI was stable angina pectoris (SAP) in 4 patients, unstable angina pectoris (UAP) in 2, STEMI in 6, and NSTEMI in 3. Post-stent OCT findings were SED in 5 patients (33.3%), ISD in 8 (53.3%), ISA in 14 (93.3%), IP in 14 (93.3%), and thrombus in 14 (93.3%). Of the 9 patients who underwent OCT-guided PCI at LST or VLST onset, preprocedural OCT findings at ST onset were uncovered stent struts in 8 (88.9%), late ISA (persistent or late-acquired ISA) in 3 (33.3%), and neoatherosclerosis in 6 (66.7%). Furthermore, late ISA was observed in 3 of 8 patients (37.5%) with ISA at the index PCI and neoatherosclerosis was observed in 5 of 8 patients (62.5%) with IP.
Table 2.
Post-Stent OCT Findings at Index PCI and Preprocedural OCT Findings at the Onset of ST in Patients With ST
Patient
no. |
Diagnosis
at index
PCI |
Stent
type |
Post-stent OCT findings at index PCI |
Preprocedural OCT
findings at ST |
| SED |
ISD |
ISA |
Maximum
ISA
distance
(μm) |
IP |
Maximum
IP angle
(°) |
Thrombus |
MSA
(mm2) |
Uncovered
struts |
ISA |
Neoatherosclerosis |
| 1 |
NSTEMI |
ZES |
− |
− |
+ |
340 |
+ |
200 |
+ |
5.83 |
+ |
− |
− |
| 2 |
NSTEMI |
EES |
+ |
+ |
+ |
190 |
+ |
360 |
+ |
4.14 |
N/A |
| 3 |
SAP |
EES |
+ |
+ |
+ |
430 |
+ |
244 |
+ |
2.11 |
N/A |
| 4 |
UAP |
BES |
− |
+ |
+ |
160 |
+ |
326 |
+ |
6.19 |
+ |
+ |
− |
| 5 |
STEMI |
SES |
− |
− |
+ |
500 |
+ |
310 |
+ |
4.37 |
N/A |
| 6 |
SAP |
EES |
+ |
+ |
+ |
520 |
+ |
360 |
+ |
4.88 |
N/A |
| 7 |
STEMI |
EES |
+ |
+ |
+ |
190 |
+ |
247 |
+ |
3.79 |
+ |
+ |
− |
| 8 |
STEMI |
EES |
− |
− |
+ |
780 |
+ |
360 |
− |
14.71 |
− |
+ |
+ |
| 9 |
NSTEMI |
EES |
− |
+ |
+ |
200 |
+ |
267 |
+ |
4.39 |
+ |
− |
+ |
| 10 |
SAP |
EES |
− |
− |
+ |
600 |
+ |
210 |
+ |
5.15 |
+ |
− |
+ |
| 11 |
STEMI |
EES |
− |
+ |
+ |
270 |
+ |
243 |
+ |
1.62 |
+ |
− |
− |
| 12 |
STEMI |
EES |
− |
− |
+ |
290 |
+ |
360 |
+ |
3.88 |
+ |
+ |
− |
| 13 |
STEMI |
EES |
− |
− |
− |
N/A |
+ |
360 |
+ |
5.97 |
+ |
− |
+ |
| 14 |
UAP |
BES |
+ |
− |
+ |
200 |
− |
N/A |
+ |
5.32 |
+ |
− |
+ |
| 15 |
SAP |
EES |
− |
+ |
+ |
370 |
+ |
225 |
+ |
5.46 |
+ |
− |
+ |
BES, biolimus-eluting stent; EES, everolimus-eluting stent; IP, irregular protrusion; ISA, incomplete stent apposition; ISD, in-stent dissection; MSA, minimum stent area; N/A, not applicable; OCT, optical coherence tomography; PCI, percutaneous coronary intervention; SAP, stable angina pectoris; SED, stent edge dissection; SES, sirolimus-eluting stent; UAP, unstable angina pectoris; ZES, zotarolimus-eluting stent. Other abbreviations as in Table 1.
Table 3
shows a comparison of the baseline characteristics at index PCI between the ST and reference groups. The median follow-up period in the reference group was 2,289 days (IQR 2,213–2,388 days). There was no significant difference in age, sex, smoking, diabetes, dyslipidemia, dialysis, or estimated glomerular filtration rate between the 2 groups. However, the prevalence of hypertension, previous myocardial infarction, and acute myocardial infarction (AMI) and serum concentrations of low-density lipoprotein cholesterol (LDL-C) were significantly higher in the ST than reference group.
Table 3.
Baseline Clinical Characteristics at Index Percutaneous Coronary Intervention in the ST and Reference Groups
| |
ST
(n=15) |
Reference
(n=70) |
P value |
| Age (years) |
62 [53–72] |
67 [61–72.3] |
0.1426 |
| Male sex |
13 (86.7) |
54 (77.1) |
0.4126 |
| Hypertension |
9 (60.0) |
58 (82.9) |
0.0493 |
| Smoking |
9 (60.0) |
50 (71.4) |
0.3834 |
| Dyslipidemia |
14 (93.3) |
57 (81.4) |
0.2593 |
| Diabetes |
8 (53.3) |
35 (50) |
0.8147 |
| Dialysis |
1 (6.7) |
2 (2.9) |
0.4682 |
| Previous MI |
1 (6.7) |
29 (41.3) |
0.0106 |
| Clinical presentation |
|
|
0.0044 |
| Stable angina |
4 (26.7) |
43 (61.4) |
|
| Unstable angina |
2 (13.3) |
15 (21.4) |
|
| AMI |
9 (60.0) |
12 (17.1) |
|
| Laboratory data |
| eGFR (mL/min/1.73 m2) |
70 [56.5–86.3] |
63.8 [50.8–76.8] |
0.1868 |
| TC (mg/dL) |
178 [157–220] |
166 [144–223] |
0.2327 |
| HDL-C (mg/dL) |
45 [39–52] |
43 [36–51] |
0.4545 |
| LDL-C (mg/dL) |
103 [93–138] |
90 [74–114] |
0.0494 |
| Triglycerides (mg/dL) |
108 [70–149] |
136 [93–183] |
0.1926 |
| HbA1c (%) |
6.2 [5.6–7.3] |
6.3 [5.7–6.9] |
0.8775 |
| Medications |
| Statins |
7 (46.7) |
50 (71.4) |
0.0641 |
| Ezetimibe |
0 |
3 (4.3) |
0.4143 |
Values are presented as the median [interquartile range] or n (%). AMI, acute myocardial infarction; eGFR, estimated glomerular filtration rate; HDL-C, high-density lipoprotein cholesterol; LDL-C, low-density lipoprotein cholesterol; MI, myocardial infarction; ST, stent thrombosis; TC, total cholesterol.
Baseline lesion and procedural characteristics at index PCI are given in
Table 4. There were no significant differences in culprit lesion location, number of diseased vessels, frequency of multivessel PCI, stent type, stent diameter, or total stent length between the 2 groups. Second- or third-generation DES were used in >90% of patients in each group.
Table 4.
Baseline Lesion and Procedural Characteristics at Index PCI in the ST and Reference Groups
| |
ST
(n=15) |
Reference
(n=70) |
P value |
| Location of culprit lesion |
|
|
0.2360 |
| LAD |
10 (66.7) |
36 (51.4) |
|
| Left circumflex artery |
0 (0) |
11 (15.7) |
|
| RCA |
5 (33.3) |
23 (32.9) |
|
| No. diseased vessels |
|
|
0.6714 |
| 1 |
9 (60.0) |
41 (58.6) |
|
| 2 |
4 (26.7) |
24 (34.3) |
|
| 3 |
2 (13.3) |
5 (7.1) |
|
| Multivessel PCI |
3 (20.0) |
16 (22.9) |
0.8095 |
| Stent type |
|
|
0.4416 |
| Bare metal stent |
0 (0) |
4 (5.7) |
|
| First-generation DES |
0 (0) |
3 (4.3) |
|
| Second- or third-generation DES |
15 (100) |
63 (90) |
|
| Stent diameter (mm) |
3 [2.5–3] |
3 [2.5–3] |
0.8333 |
| Total stent length (mm) |
28 [18–28] |
25.5 [18–32.3] |
1.0000 |
Values are presented as the median [interquartile range] or n (%). DES, drug-eluting stent. Other abbreviations as in Tables 1,2.
Comparisons of pre- and post-stent OCT findings at index PCI between the ST and reference groups are summarized in
Table 5
and
Figure 3A. The prevalence of TCFA and thrombus on prestent OCT were significantly higher in the ST than reference group. The incidence of ISA, IP, and thrombus on post-stent OCT was significantly higher in the ST than reference group. In patients with ISA, there was no significant difference in maximum ISA distance between 2 groups. In patients with IP, the maximum IP arc, mean IP arc, IP length, and IP volume index were significantly larger in the ST than reference group. Because the incidence of AMI at index PCI was significantly higher in the ST than reference group, a comparison of post-stent OCT findings between the 2 groups was performed in 21 patients who demonstrated AMI at index PCI. As indicated in
Figure 3B
and
Supplementary Table 1, both a maximum IP arc >180° and a small MSA were significantly more common in the ST than reference group.
Table 5.
Pre- and Post-Stent OCT Findings at Index PCI in the ST and Reference Groups
| |
ST
(n=15) |
Reference
(n=70) |
P value |
| Prestent findings |
| Lipid-rich plaque |
1 (73.3) |
38 (54.3) |
0.1755 |
| TCFA |
7 (46.7) |
13 (18.6) |
0.0199 |
| Calcification |
7 (46.7) |
38 (54.3) |
0.5916 |
| Thrombus |
8 (53.3) |
14 (20.0) |
0.0075 |
| Post-stent findings |
| SED |
5 (33.3) |
37 (52.9) |
0.1699 |
| ISD |
8 (53.3) |
46 (66.7) |
0.3287 |
| ISA |
14 (93.3) |
39 (55.7) |
0.0064 |
| Maximum ISA distance (mm) |
315 [198–505] |
390 [280–490] |
0.1667 |
| Maximum ISA distance >300 μm |
7 (46.7) |
26 (37.1) |
0.4922 |
| Smooth protrusion |
12 (80.0) |
54 (77.1) |
0.8095 |
| Fibrosis tissue protrusion |
8 (53.3) |
43 (62.3) |
1.0 |
| IP |
14 (93.3) |
44 (62.8) |
0.0214 |
| Maximum IP arc (°) |
288.5 [238.5–360] |
128.5 [81.4–212.8] |
<0.0001 |
| Maximum IP arc >180° |
14 (93.3) |
13 (18.6) |
<0.0001 |
| Mean IP arc (°) |
161.0 [130.0–236.0] |
98.2 [71.3–125.8] |
0.0001 |
| IP length (mm) |
8.0 [5.2–18.0] |
3.0 [1.7–6.3] |
0.0009 |
| IP volume index |
1,094.0 [829.5–3,627.0] |
122.8 [0–311.0] |
<0.0001 |
| Thrombus |
14 (93.3) |
36 (51.4) |
0.0028 |
| MSA (mm2) |
4.88 [3.88–5.83] |
5.24 [4.43–6.06] |
0.2261 |
| Small MSA |
8 (53.3) |
26 (37.1) |
0.2454 |
Values are presented as medians [interquartile range] or n (%). TCFA, thin-cap fibroatheroma. Other abbreviations as in Tables 1,2.

Comparisons of prestent OCT findings at index PCI, lipid profile, and lipid-lowering therapy between lesions (patients) with and without IP are summarized in
Supplementary Table 2. The prevalence of TCFA and thrombus on prestent OCT was significantly higher in lesions with than without IP. Serum LDL-C concentrations were significantly higher in patients with than without IP.
The respective inter- and intra-observer agreement κ values were 0.76 and 0.78 for ISA, 0.76 and 0.68 for IP, and 0.79 and 0.69 for thrombus. The respective inter- and intra-observer reproducibility, measured by Pearson coefficients, was r=0.96 and r=0.90 for ISA distance and r=0.88 and r=0.96 for IP arc.
Discussion
This is a case-control study comparing post-stent OCT findings between patients with ST and those without ACS after index PCI. To the best of our knowledge, this study is the first to evaluate the association between post-stent OCT findings and ST. The main findings of this OCT study were that: (1) the incidence of ISA, IP, and thrombus was significantly higher in the ST than reference group; (2) in patients with IP, the maximum IP arc and IP volume index were significantly larger in the ST than reference group; and (3) in patients with AMI, there was no significant difference in the incidence of IP between the 2 groups, but the incidence of a maximum IP arc >180° was significantly higher in the ST than reference group.
Although the pathophysiology of ST is not fully understood, several stent- and procedure-related factors may trigger ST, including hypersensitivity to drug coatings or polymers, incomplete re-endothelialization, stent design, inadequate stent expansion, ISA, stent deployment in a necrotic core, residual edge dissection, and tissue protrusion through stent struts.16–18
The pathophysiology of ST is different between EST and LST/VLST. EST may be associated with procedure-related factors, such as residual SED and stent underexpansion.18,19
Conversely, LST and VLST may be associated with biological factors, such as impaired re-endothelialization, hypersensitivity to drug coatings or polymers, late-acquired ISA caused by positive arterial remodeling, and neoatherosclerosis.15–17
Recent OCT studies reported that ISA was associated with the onset of EST, LST, and VLST.15,20,21
Souteyrand et al reported that strut malapposition was the most frequently observed abnormality and was highly prevalent in all ST types.20
Conversely, a previous OCT study reported that ISA at index PCI was not associated with major cardiovascular events.22
Moreover, the case-control OCT study that compared patients with subacute ST to matched patients without ST reported that there was no significant difference in the incidence of ISA between the 2 groups.19
Some acutely malapposed struts with a short ISA distance resolve during the follow-up period, whereas others with a long ISA distance persist.23
Late-acquired malapposed struts subsequently appear due to vessel remodeling after DES implantation.16,17
Previous intravascular imaging studies24,25
implied a possible link between late ISA and an increased risk for ST. Therefore, the evaluation of ISA distance rather than the occurrence of ISA is important regarding the association between ISA at index PCI and ST.
A previous study showed that persistent ISA was predicted by an ISA distance at index PCI of >355 µm for everolimus-eluting stents and >285 µm for sirolimus-eluting stents.23
In the present study, we investigated the ISA distance in the ST and reference groups, but there was no significant difference between them regarding the incidence of an ISA distance >300 µm, the value that predicted persistent ISA. Although the present study demonstrated that the incidence of ISA was significantly higher in the ST than reference group, it is not clear whether ISA at index PCI was directly associated with the development of ST.
Intrastent tissue protrusion is defined as the prolapse of plaque or thrombus through stent struts on intravascular ultrasound (IVUS) or OCT imaging. Some IVUS studies reported that intrastent tissue protrusion was associated with EST,18,26
whereas others found that it was not associated with ST.27
The resolution of OCT is 10-fold higher than that of IVUS, which makes it possible to detect the detailed morphology of tissue protrusion. In the MGH OCT Registry, Soeda et al categorized OCT-detected in-stent tissue protrusion into 3 groups: smooth protrusion, disrupted fibrous tissue protrusion, and IP.6
Those author found that this classification helped distinguish different severities of vessel injury, with smooth protrusion representing minimal vessel injury, disrupted fibrous tissue protrusion representing mild vessel injury, and irregular protrusion representing moderate to severe vessel injury with a high likelihood of medial disruption and lipid core penetration.6
In the present study, there was no significant difference in the incidence of smooth protrusion or disrupted fibrous tissue protrusion between the ST and reference groups, but the incidence of IP was significantly in the ST than reference group (93.3% vs. 62.8%, respectively), and was also much higher than that in the MGH OCT Registry (53.8%).6
Previous pathological studies reported that increased vascular injury and penetration of the necrotic core of lipid-rich plaques were associated with increased neointimal growth, a higher number of inflammatory cells, and thrombus formation, thereby increasing the risk of EST and stent restenosis.28,29
In an ex vivo human autopsy study, Nakano et al reported that necrotic core prolapse and medial tear were independent risk factors for EST.29
Therefore, IP, which can pathologically indicate necrotic core prolapse and medial tear, may be associated with the development of EST. Furthermore, Sanuki et al reported that IP was associated with subsequent neoatherosclerotic changes after DES implantation.30
Because neoatherosclerosis is considered to be the leading cause of LST and VLST,31
IP may result in the onset of LST or VLST through the development of neoatherosclerosis. The presence of IP, especially a large burden of IP, may be a post-stent OCT finding common to EST and LST/VLST.
Bryniarski et al reported that the prevalence of lipid-rich plaque and thrombus before stenting were independent predictors for the occurrence of IP.32
In the present study, the prevalence of TCFA and thrombus was significantly higher in lesions with than without IP. These significant differences were also observed between the ST and reference groups. Because the occurrence of IP depends on the presence of a vulnerable plaque or thrombus before stenting, IP may simply indicate one of the morphological results attributed to underlying plaque characteristics before stenting rather than being a cause of ST. To clarify these important questions, a large-scale study is needed.
PCI for AMI is considered to confer a high risk of ST.16,17
In fact, the present study also demonstrated that the prevalence of AMI at index PCI was significantly higher in the ST than reference group. Furthermore, a previous study showed that IP was more frequently observed in patients with AMI than in patients with SAP or UAP.6
Therefore, we performed a subanalysis of patients with AMI. In this population, there was no significant difference in the incidence of IP between the 2 groups, but IP with a maximum arc of >180° was significantly associated with ST onset in patients who were potentially at high risk of ST. This suggests that IP with a large arc is a significant feature on post-stent OCT in patients with ST.
No effective treatment is known to reduce future cardiac events in the presence of IP. Recent OCT studies identified elevated LDL-C concentrations and the presence of thrombus as predictors of IP.32
If PCI is performed in the elective setting, aggressive treatment to reduce LDL-C concentrations before PCI may lower the incidence of IP. In addition, a previous study demonstrated that intensive LDL-C-lowering therapy, including high-dose statins, was associated with favorable neointimal tissue characteristics after DES implantation.33
Therefore, continuing aggressive LDL-C-lowering therapy after PCI using strong statins, ezetimibe, or proprotein convertase subtilisin kexin 9 inhibitors may contribute to the prevention of future cardiac events, including ST, in patients with IP.
Study Limitations
Several limitations of the present study should be noted. First, this study was a single-center retrospective case-control study. Therefore, it is unclear how many patients with IP developed ST. Second, because individual physicians determined both the treatment strategy and OCT procedure, potential selection bias could not be avoided. At Nara Medical University, OCT-guided PCI is generally avoided in patients with severe renal function without dialysis and in those with unstable conditions, such as cardiogenic shock or congestive heart failure. Third, the classification of in-stent tissue protrusion using OCT is novel and has not yet been validated. Fourth, the reference group consisted of patients who did not develop ACS for at least 5 years after index PCI, as determined by clinical records. Some of these patients may have had silent ST. Fifth, because the pathophysiology of ST is different between EST and LST/VLST, it may be suitable to evaluate each ST type separately to clarify the association between ST and post-stent OCT findings. Sixth, the occurrence of IP depends on the preprocedural plaque characteristics before stenting, such as lipid-rich plaques or thrombus,32
which are predominant at the culprit lesion for AMI. Therefore, multivariate logistic regression analysis, including prestent plaque characteristics and IP, is needed to clarify whether IP is an independent predictor for the development of ST. However, we did not perform multivariate logistic regression analysis in the present study because of the small number of ST events. Seventh, the sample size was small and the present findings are considered exploratory in nature. A large-scale prospective cohort study is needed to verify the present results.
Conclusions
In this case-control study comparing post-stent OCT findings between patients with ST and those without ACS after index PCI, the presence of IP was associated with ST onset. IP with a large arc and volume was a significant feature on post-stent OCT in patients with ST.
Acknowledgments
The authors thank the staff in the catheterization laboratory at Nara Medical University for their excellent assistance.
Sources of Funding
This study did not receive any funding.
Disclosure
Y.S. is a member of
Circulation Journal’ Editorial Team. The other authors have no conflicts of interest to declare.
IRB Information
This study was approved by the Ethics Committee of Nara Medical University (Approval no. 1759-2).
Data Availability
The deidentified participant data will not be shared.
Supplementary Files
Please find supplementary file(s);
http://dx.doi.org/10.1253/circj.CJ-20-0759
References
- 1.
Kimura T, Morimoto T, Kozuma K, Honda Y, Kume T, Aizawa T, et al. Comparisons of baseline demographics, clinical presentation, and long-term outcome among patients with early, late, and very late stent thrombosis of sirolimus-eluting stents: Observations from the Registry of Stent Thrombosis for Review and Reevaluation (RESTART). Circulation 2010; 122: 52–61.
- 2.
Chechi T, Vecchio S, Vittori G, Giuliani G, Lilli A, Spaziani G, et al. ST-segment elevation myocardial infarction due to early and late stent thrombosis a new group of high-risk patients. J Am Coll Cardiol 2008; 51: 2396–2402.
- 3.
Navarese EP, Kowalewski M, Kandzari D, Lansky A, Górny B, Kołtowski L, et al. First-generation versus second-generation drug-eluting stents in current clinical practice: Updated evidence from a comprehensive meta-analysis of randomised clinical trials comprising 31 379 patients. Open Heart 2014; 1: e000064.
- 4.
Brodie BR, Hansen C, Garberich RF, Browning JA, Tobbia P, Handran CB, et al. ST-segment elevation myocardial infarction resulting from stent thrombosis: An enlarging subgroup of high-risk patients. J Am Coll Cardiol 2012; 60: 1989–1991.
- 5.
Jones DA, Gallagher S, Rathod KS, Akhtar M, Knight CJ, Rothman MT, et al. Contemporary analysis of incidence and outcomes of stent thrombosis presenting as ST elevation myocardial infarction in a primary percutaneous coronary intervention cohort. Am J Cardiol 2013; 112: 1347–1354.
- 6.
Soeda T, Uemura S, Park SJ, Jang Y, Lee S, Cho JM, et al. Incidence and clinical significance of poststent optical coherence tomography findings: One-year follow-up study from a multicenter registry. Circulation 2015; 132: 1020–1029.
- 7.
Prati F, Romagnoli E, Gatto L, La Manna A, Burzotta F, Limbruno U, et al. Clinical impact of suboptimal stenting and residual intrastent plaque/thrombus protrusion in patients with acute coronary syndrome: The CLI-OPCI ACS substudy (Centro per la Lotta Contro L’Infarto-Optimization of Percutaneous Coronary Intervention in Acute Coronary Syndrome). Circ Cardiovasc Interv 2016; 9: e003726.
- 8.
Cutlip DE, Windecker S, Mehran R, Boam A, Cohen DJ, van Es GA, et al. Clinical end points in coronary stent trials: A case for standardized definitions. Circulation 2007; 115: 2344–2351.
- 9.
Watanabe M, Uemura S, Sugawara Y, Ueda T, Soeda T, Takeda Y, et al. Side branch complication after a single-stent crossover technique: Prediction with frequency domain optical coherence tomography. Coron Artery Dis 2014; 25: 321–329.
- 10.
Gonzalo N, Serruys PW, Okamura T, Shen ZJ, Onuma Y, Garcia-Garcia HM, et al. Optical coherence tomography assessment of the acute effects of stent implantation on the vessel wall: A systematic quantitative approach. Heart 2009; 95: 1913–1919.
- 11.
Di Vito L, Yoon JH, Kato K, Yonetsu T, Vergallo R, Costa M, et al. Comprehensive overview of definitions for optical coherence tomography-based plaque and stent analyses. Coron Artery Dis 2014; 25: 172–185.
- 12.
Tanigawa J, Barlis P, Dimopoulos K, Dalby M, Moore P, Di Mario C. The influence of strut thickness and cell design on immediate apposition of drug-eluting stents assessed by optical coherence tomography. Int J Cardiol 2009; 134: 180–188.
- 13.
Fujii K, Kubo T, Otake H, Nakazawa G, Sonoda S, Hibi K, et al. Expert consensus statement for quantitative measurement and morphological assessment of optical coherence tomography. Cardiovasc Interv Ther 2020; 35: 13–18.
- 14.
Kume T, Akasaka T, Kawamoto T, Ogasawara Y, Watanabe N, Toyota E, et al. Assessment of coronary arterial thrombus by optical coherence tomography. Am J Cardiol 2006; 97: 1713–1717.
- 15.
Taniwaki M, Radu MD, Zaugg S, Amabile N, Garcia-Garcia HM, Yamaji K, et al. Mechanisms of very late drug-eluting stent thrombosis assessed by optical coherence tomography. Circulation 2016; 133: 650–660.
- 16.
Torrado J, Buckley L, Durán A, Trujillo P, Toldo S, Valle Raleigh J, et al. Restenosis, stent thrombosis, and bleeding complications: Navigating between Scylla and Charybdis. J Am Coll Cardiol 2018; 71: 1676–1695.
- 17.
Holmes DR Jr, Kereiakes DJ, Garg S, Serruys PW, Dehmer GJ, Ellis SG, et al. Stent thrombosis. J Am Coll Cardiol 2010; 56: 1357–1365.
- 18.
Choi SY, Witzenbichler B, Maehara A, Lansky AJ, Guagliumi G, Brodie B, et al. Intravascular ultrasound findings of early stent thrombosis after primary percutaneous intervention in acute myocardial infarction: A harmonizing outcomes with revascularization and stents in acute myocardial infarction (HORIZONS-AMI) substudy. Circ Cardiovasc Interv 2011; 4: 239–247.
- 19.
Prati F, Kodama T, Romagnoli E, Gatto L, Di Vito L, Ramazzotti V, et al. Suboptimal stent deployment is associated with subacute stent thrombosis: Optical coherence tomography insights from a multicenter matched study. From the CLI Foundation Investigators: The CLI-THRO study. Am Heart J 2015; 169: 249–256.
- 20.
Souteyrand G, Amabile N, Mangin L, Chabin X, Meneveau N, Cayla G, et al. Mechanisms of stent thrombosis analysed by optical coherence tomography: Insights from the national PESTO French registry. Eur Heart J 2016; 37: 1208–1216.
- 21.
Parodi G, La Manna A, Di Vito L, Valgimigli M, Fineschi M, Bellandi B, et al. Stent-related defects in patients presenting with stent thrombosis: Differences at optical coherence tomography between subacute and late/very late thrombosis in the Mechanism Of Stent Thrombosis (MOST) study. EuroIntervention 2013; 9: 936–944.
- 22.
Prati F, Romagnoli E, Burzotta F, Limbruno U, Gatto L, La Manna A, et al. Clinical impact of OCT findings during PCI: The CLI-OPCI II Study. JACC Cardiovasc Imaging 2015; 8: 1297–1305.
- 23.
Shimamura K, Kubo T, Akasaka T, Kozuma K, Kimura K, Kawamura M, et al. Outcomes of everolimus-eluting stent incomplete stent apposition: A serial optical coherence tomography analysis. Eur Heart J Cardiovasc Imaging 2015; 16: 23–28.
- 24.
Cook S, Wenaweser P, Togni M, Billinger M, Morger C, Seiler C, et al. Incomplete stent apposition and very late stent thrombosis after drug-eluting stent implantation. Circulation 2007; 115: 2426–2434.
- 25.
Guagliumi G, Sirbu V, Musumeci G, Gerber R, Biondi-Zoccai G, Ikejima H, et al. Examination of the in vivo mechanisms of late drug-eluting stent thrombosis. JACC Cardiovasc Interv 2012; 5: 12–20.
- 26.
Hong YJ, Jeong MH, Choi YH, Song JA, Kim DH, Lee KH, et al. Impact of tissue prolapse after stent implantation on short- and long-term clinical outcomes in patients with acute myocardial infarction: An intravascular ultrasound analysis. Int J Cardiol 2013; 166: 646–651.
- 27.
Qiu F, Mintz GS, Witzenbichler B, Metzger DC, Rinaldi MJ, Duffy PL, et al. Prevalence and clinical impact of tissue protrusion after stent implantation: An ADAPT-DES intravascular ultrasound substudy. JACC Cardiovasc Interv 2016; 9: 1499–1507.
- 28.
Farb A, Weber DK, Kolodgie FD, Burke AP, Virmani R. Morphological predictors of restenosis after coronary stenting in humans. Circulation 2002; 105: 2974–2980.
- 29.
Nakano M, Yahagi K, Otsuka F, Sakakura K, Finn AV, Kutys R, et al. Causes of early stent thrombosis in patients presenting with acute coronary syndrome: An ex vivo human autopsy study. J Am Coll Cardiol 2014; 63: 2510–2520.
- 30.
Sanuki Y, Sonoda S, Muraoka Y, Shimizu A, Kitagawa M, Takami H, et al. Contribution of poststent irregular protrusion to subsequent in-stent neoatherosclerosis after the second-generation drug-eluting stent implantation. Int Heart J 2018; 59: 307–314.
- 31.
Otsuka F, Byrne RA, Yahagi K, Mori H, Ladich E, Fowler DR, et al. Neoatherosclerosis: Overview of histopathologic findings and implications for intravascular imaging assessment. Eur Heart J 2015; 36: 2147–2159.
- 32.
Bryniarski KL, Tahk SJ, Choi SY, Soeda T, Higuma T, Yamamoto E, et al. Clinical, angiographic, IVUS, and OCT predictors for irregular protrusion after coronary stenting. EuroIntervention 2017; 12: e2204–e2211.
- 33.
Jang JY, Kim JS, Shin DH, Kim BK, Ko YG, Choi D, et al. Favorable effect of optimal lipid-lowering therapy on neointimal tissue characteristics after drug-eluting stent implantation: Qualitative optical coherence tomography analysis. Atherosclerosis 2015; 242: 553–559.
