Abstract
Background:
Data evaluating the effects of acute coronary syndrome (ACS) relative to stable coronary artery disease (CAD) on bleeding risk after percutaneous coronary intervention (PCI) are scarce.
Methods and Results:
From the CREDO-Kyoto Registry Cohort-3, 13,258 patients undergoing first PCI (5,521 ACS; 7,737 stable CAD) were identified. Patients were further stratified according to ACS presentation and Academic Research Consortium High Bleeding Risk (HBR): ACS/HBR: n=2,502; ACS/no-HBR: n=3,019; stable CAD/HBR: n=3,905; and stable CAD/no-HBR: n=3,832. The primary bleeding endpoint was Bleeding Academic Research Consortium 3/5 bleeding, whereas the primary ischemic endpoint was myocardial infarction (MI)/ischemic stroke. Compared with stable CAD, ACS was associated with a significantly higher adjusted risk for bleeding (hazard ratio [HR] 1.85; 95% confidence interval [CI] 1.68–2.03; P<0.0001), with a markedly higher risk within 30 days (HR 4.24; 95% CI 3.56–5.06; P<0.0001). Compared with the stable CAD/no-HBR group, the ACS/HBR, no-ACS/HBR, and ACS/no-HBR groups were associated with significantly higher adjusted risks for bleeding, with HRs of 3.05 (95% CI 2.64–3.54; P<0.0001), 1.89 (95% CI 1.66–2.15; P<0.0001), and 1.69 (95% CI 1.45–1.98; P<0.0001), respectively. There was no excess adjusted risk of the ACS relative to stable CAD group for MI/ischemic stroke (HR 1.07; 95% CI 0.94–1.22; P=0.33).
Conclusions:
Bleeding risk after PCI depended on both ACS presentation and HBR, with a significant effect of ACS within 30 days.
Patients with acute coronary syndrome (ACS) are reportedly at a higher risk for ischemic events.1
Therefore, in the current guidelines, newer and more potent P2Y12
receptor inhibitors, such as ticagrelor and prasugrel, are recommended in patients with ACS, whereas clopidogrel is still recommended in patients with stable coronary artery disease (CAD).2,3
In ACS patients, the current guidelines also recommend the use of anticoagulants before percutaneous coronary intervention (PCI), loading of antiplatelet agents, and longer-duration dual antiplatelet therapy (DAPT) if not at high bleeding risk (HBR).2,3
Moreover, the transfemoral approach, which is reportedly associated with a higher risk for bleeding, is frequently selected in PCI for ACS.4
Therefore, patients with ACS may also have higher bleeding risk than patients with stable CAD. Nevertheless, the clinical presentation of ACS has not been included as a criterion in the Academic Research Consortium (ARC)-HBR, partly because there have been no previous studies comparing the bleeding risk after PCI between ACS and stable CAD patients.5
Editorial p ????
New-generation drug-eluting stents (DES) were reported to reduce the long-term risks for stent thrombosis, myocardial infarction, and cardiac death compared with bare-metal stents in a meta-analysis of randomized trials including ACS patients.6
The balance between ischemic and bleeding risk after PCI in ACS patients may have changed substantially in the new-generation DES era.
Therefore, we sought to evaluate the effect of ACS compared with stable CAD on the bleeding and ischemic risk after PCI from a large observational database of patients undergoing first coronary revascularization in the new-generation DES era in Japan.
Methods
Study Design
The Coronary Revascularization Demonstrating Outcome Study in Kyoto (CREDO-Kyoto) PCI/coronary artery bypass grafting (CABG) Registry Cohort-3 is a physician-initiated, non-company-sponsored, multicenter registry enrolling consecutive patients who underwent their first coronary revascularization with PCI or isolated CABG without combined non-coronary surgery among 22 centers in Japan between January 2011 and December 2013, after approval of the new-generation DES in 2010 (Supplementary Appendix A).7
This study was conducted in accordance with the Declaration of Helsinki and the Ethical Guidelines for Medical and Health Research Involving Human Subjects in Japan. The relevant ethics committees in all participating centers approved the study protocol. Because of the retrospective enrollment, the need for written informed consent from patients was waived; however, we excluded those patients who refused participation in the study when contacted for follow-up. This strategy is concordant with the guidelines of the Japanese Ministry of Health, Labour and Welfare.
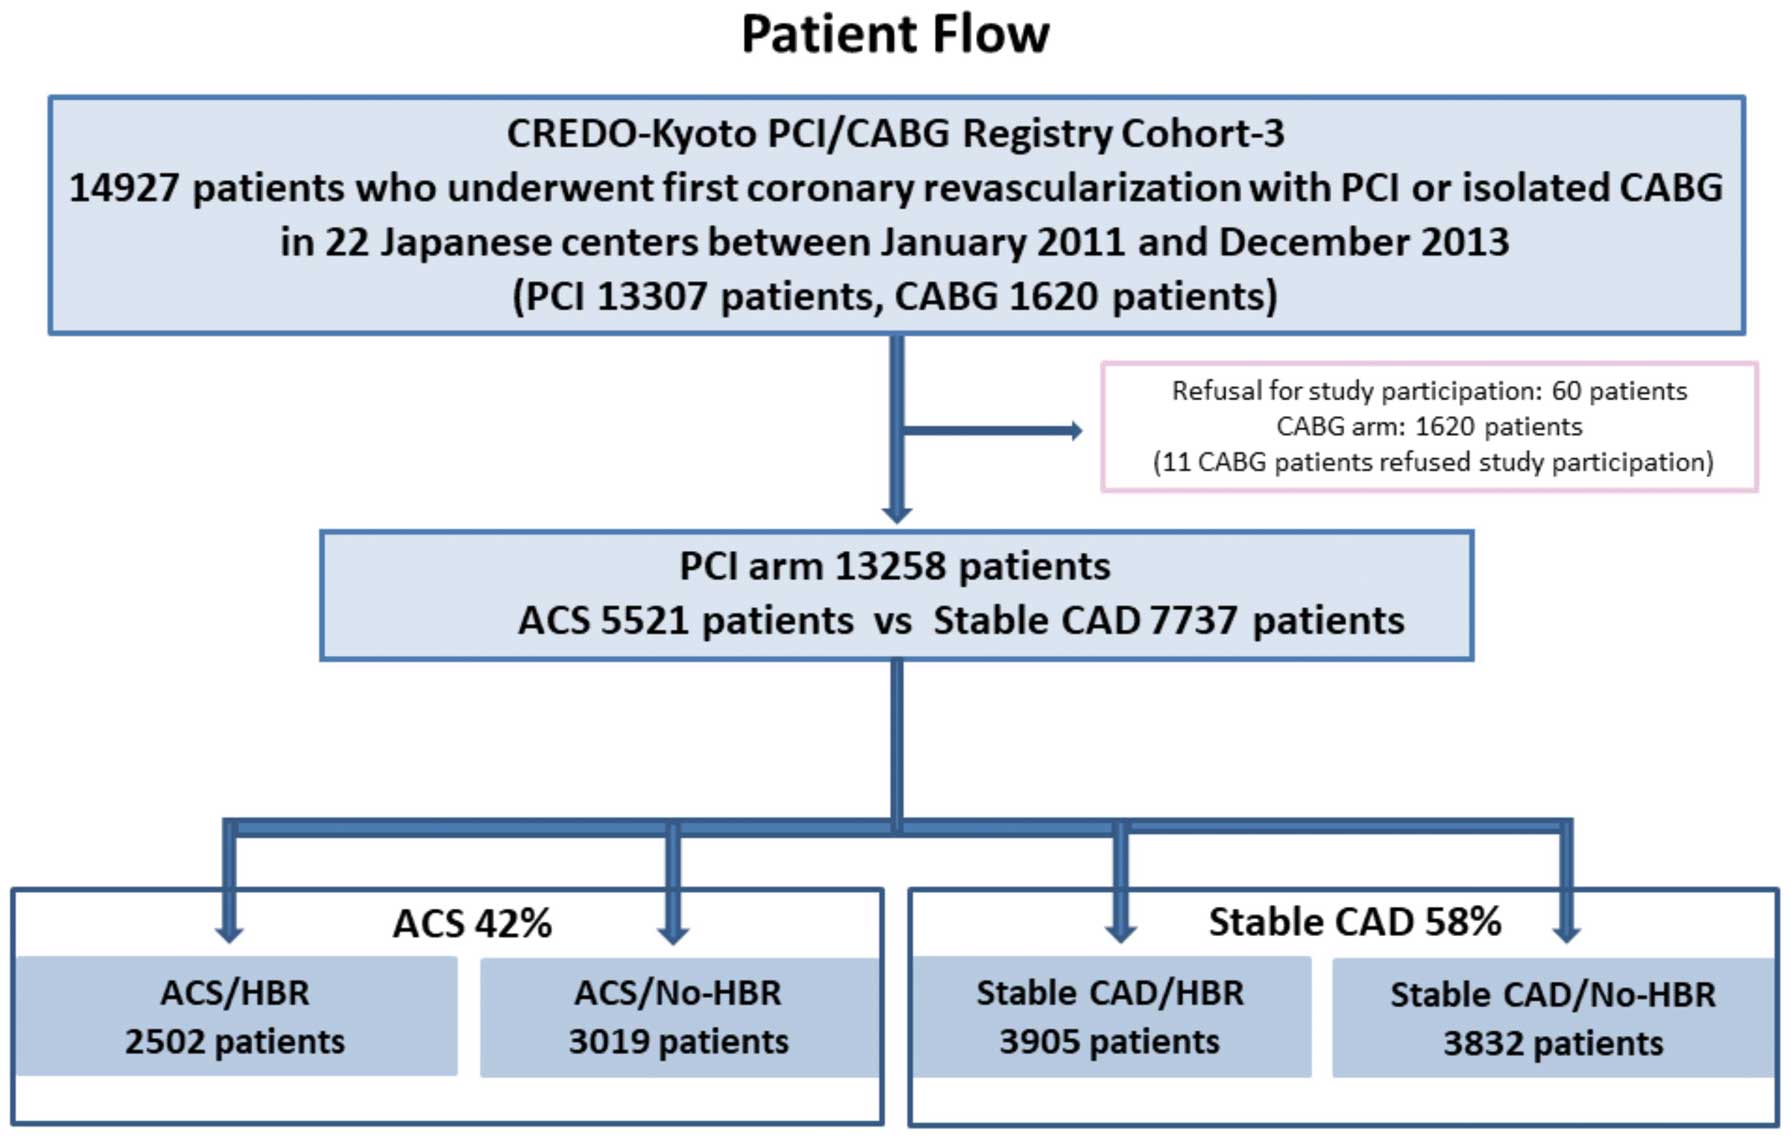
Between January 2011 and December 2013, 14,927 patients had first isolated coronary revascularization (PCI: 13,307 patients; isolated CABG: 1,620 patients) among 22 centers in Japan. After excluding 60 patients who refused study participation and 1,620 patients with CABG (11 CABG patients refused study participation), the study population of the present consisted of 13,258 patients who underwent their first PCI (Figure 1). Using retrospective registry data, we compared the clinical outcomes, focusing on major bleeding and ischemic events, between the 2 groups of patients with ACS and stable CAD.
Definitions and Outcome Measures
Patients with ST-elevation myocardial infarction (STEMI) were defined as those with an increase in cardiac biomarkers with persistent ST-segment elevation or new Q-wave on electrocardiograms. Patients with non-ST-elevation myocardial infarction (NSTEMI) were defined as those with an increase in cardiac biomarkers without electrocardiographic changes as seen for STEMI. Unstable angina (UA) was defined as Braunwald Class III with no increase in a cardiac biomarker.8
The ARC-HBR criteria have been described previously.5
Patients are considered to be at HBR if at least 1 major or 2 minor criteria are met. In the present analysis, several major and minor ARC-HBR criteria were not captured. Therefore, those patients with at least 1 major criterion, such as severe chronic kidney disease, thrombocytopenia, severe anemia, liver cirrhosis, prior hemorrhagic stroke, active malignancy or anticoagulation, and those with more than 2 minor criteria, such as age ≥75 years, mild anemia, prior ischemic stroke, prior bleeding or moderate chronic kidney disease, were classified as the HBR group. Patients with only 1 minor criterion or without any criterion were classified as the no-HBR group.
The primary bleeding outcome measure was major bleeding, defined as Bleeding Academic Research Consortium (BARC) Type 3 or 5 bleeding,9
whereas the primary ischemic outcome measure was defined as a composite of myocardial infarction or ischemic stroke. Death was regarded as cardiac in origin unless obvious non-cardiac causes could be identified. Death of unknown cause and any death during the index hospitalization for coronary revascularization were regarded as cardiac deaths. Cardiovascular deaths included cardiac death and other vascular deaths related to stroke, renal disease, and vascular disease. Myocardial infarction and stent thrombosis were adjudicated according to the ARC definition.10
To maintain consistency with CREDO-Kyoto PCI/CABG Registry Cohort-2,11
myocardial infarction was also adjudicated according to the Arterial Revascularization Therapy Study (ARTS) definition,12
in which only Q-wave myocardial infarction was regarded as myocardial infarction when it occurred within 7 days of the index procedure. Other definitions are provided in the
Supplementary Methods.
Data Collection for Baseline Characteristics and Follow-up Events
Clinical, angiographic, and procedural data were collected from hospital charts or hospital databases according to the prespecified definitions by experienced clinical research coordinators from an independent clinical research organization (Research Institute for Production Development, Kyoto, Japan; see
Supplementary Appendix B). Follow-up data were collected from hospital charts and/or obtained by contacting patients, their relatives, or referring physicians by mail with questions regarding vital status, subsequent hospitalizations, and status of antiplatelet therapy between January 2018 and December 2019. Follow-up was regarded as completed if follow-up data beyond July 1, 2017 were obtained. The clinical event committee adjudicated those events such as death, myocardial infarction, stent thrombosis, stroke, and major bleeding (see
Supplementary Appendix C).
Statistical Analysis
Categorical variables are presented as numbers and percentages, were compared using Chi-squared tests. Continuous variables are expressed as the mean±SD or as the median with interquartile range (IQR). Based on their distribution, continuous variables were compared between 2 groups using Student’s t-test or the Wilcoxon rank-sum test, and among 4 groups using analysis of variance (ANOVA) or the Kruskal-Wallis test. The cumulative incidence of outcome measures was estimated by the Kaplan-Meier method, and differences were assessed using log-rank tests. To distinguish early events after PCI from long-term events, landmark analysis was performed at 30 days. Those patients with individual endpoint events before 1 month were excluded from the landmark analysis beyond 30 days. The effect of ACS relative to stable CAD for the outcome measures is expressed as a hazard ratio (HR) and 95% confidence intervals (CIs). The HRs were estimated by multivariable Cox proportional hazard models adjusting for the 36 clinically relevant factors listed in
Table 1, as well as clinical presentation (ACS and stable CAD) as the primary variable. Continuous variables were dichotomized by clinically meaningful reference values to make proportional hazard assumptions robust and to be consistent with our previous report.10
Missing values for the risk-adjusting variables were imputed as “normal” in the binary classification, because data should have been available if abnormalities were suspected. Proportional hazard assumptions for the primary variable and the risk-adjusting variables were assessed on plots of log(time) vs. log[−log(survival)] stratified by the variable. The assumptions were verified to be acceptable for all variables.
Table 1.
Baseline Characteristics and Medications
| |
ACS (n=5,521) |
Stable CAD (n=7,737) |
P value |
| Clinical characteristics |
| Age (years) |
68.7±12.5 |
69.9±10.3 |
<0.0001 |
| Age ≥75 yearsA |
1,947 (35) |
2,734 (35) |
0.93 |
| Male sexA |
4,083 (74) |
5,589 (72) |
0.03 |
| Body mass index (kg/m2) |
23.7±3.6 (n=5,389) |
23.9±3.6 (n=7,685) |
0.0004 |
| Body mass index <25.0 kg/m2 A |
3,819 (69) |
5,082 (66) |
<0.0001 |
| Acute MI |
5,316 (96) |
0 (0) |
<0.0001 |
| STEMI |
4,081 (74) |
0 (0) |
<0.0001 |
| NSTEMI |
1,235 (22) |
0 (0) |
<0.0001 |
| Unstable angina |
205 (3.7) |
0 (0) |
<0.0001 |
| HypertensionA |
4,403 (80) |
6,497 (84) |
0.0001 |
| DiabetesA |
1,886 (34) |
3,153 (41) |
<0.0001 |
| On insulin therapy |
281 (5.1) |
810 (10) |
<0.0001 |
| Current smokerA |
2,004 (36) |
1,668 (22) |
<0.0001 |
| Heart failureA |
1,679 (30) |
1,438 (19) |
<0.0001 |
| Multivessel diseaseA |
3,090 (56) |
4,511 (58) |
0.007 |
| LVEF (%) |
55.2±12.4 (n=4,924) |
61.1±12.9 (n=6,607) |
<0.0001 |
| LVEF ≤40% |
581/4,924 (12) |
556/6,607 (8.4) |
<0.0001 |
| Mitral regurgitation grade ≥3/4 |
449/5,060 (8.9) |
445/6,640 (6.7) |
<0.0001 |
| Prior MIA |
148 (2.7) |
1,312 (17) |
<0.0001 |
| Prior strokeA |
606 (11) |
1,093 (14) |
<0.0001 |
| Prior hemorrhagic stroke |
125 (2.3) |
179 (2.3) |
0.85 |
| Prior ischemic stroke |
507 (9.2) |
959 (12) |
<0.0001 |
| Peripheral vascular diseaseA |
187 (3.4) |
1,026 (13) |
<0.0001 |
| Atrial fibrillationA |
485 (8.8) |
801 (10) |
0.003 |
| Chronic obstructive pulmonary diseaseA |
199 (3.6) |
320 (4.1) |
0.12 |
| Liver cirrhosisA |
118 (2.1) |
217 (2.8) |
0.01 |
| Malignancy |
595 (11) |
1,082 (14) |
<0.0001 |
| Active malignancyA |
89 (1.6) |
181 (2.3) |
0.004 |
| Severe frailtyA,B |
303 (5.5) |
247 (3.2) |
<0.0001 |
| CKD |
| Moderate (eGFR 30–59 mL/min/1.73 m2) |
1,666 (30) |
2,509 (32) |
0.006 |
| Severe CKD |
464 (8.4) |
733 (9.5) |
0.03 |
| eGFR <30 mL/min/1.73 m2 |
| Not on dialysisA |
322 (5.8) |
264 (3.4) |
<0.0001 |
| On dialysisA |
142 (2.6) |
469 (6.1) |
<0.0001 |
| Severe anemia (Hb <11 g/dL)A |
603 (11) |
1,029 (13) |
<0.0001 |
| Mild anemia (Hb 11–12.9 g/dL for men, 11–11.9 g/dL for women) |
883 (16) |
1,814 (23) |
<0.0001 |
| Thrombocytopenia (platelets <100×109/L)A |
111 (2.0) |
151 (2.0) |
0.81 |
| ARC-HBR |
2,502 (45) |
3,905 (50) |
<0.0001 |
| Procedural characteristics |
| No. target lesions |
1.45±0.78 |
1.5±0.79 |
0.002 |
| Target of proximal LADA |
3,161 (57) |
4,838 (63) |
<0.0001 |
| Target of unprotected LMCAA |
250 (4.5) |
341 (4.4) |
0.74 |
| Target of chronic total occlusionA |
226 (4.1) |
1,105 (14) |
<0.0001 |
| Target of bifurcationA |
2,056 (37) |
3,186 (41) |
<0.0001 |
| Side-branch stentingA |
167 (3.0) |
357 (4.6) |
<0.0001 |
| Total number of stents |
| Median [IQR] |
1 [1–2] |
2 [1–2] |
<0.0001 |
| Mean±SD |
1.80±1.26 (n=5,184) |
1.99±1.38 (n=7,507) |
|
| Total stent length (mm) |
| Median [IQR] |
28 [18–47] |
32 [18–56] |
<0.0001 |
| Mean±SD |
38.0±30.3 (n=5,182) |
43.6±34.7 (n=7,507) |
|
| Total stent length >28 mmA |
2,292 (42) |
3,931 (51) |
<0.0001 |
| Minimum stent size (mm) |
2.92±0.46 (n=5,183) |
2.82±0.42 (n=7,507) |
<0.0001 |
| Minimum stent size <3.0 mmA |
2,434 (44) |
4,237 (55) |
<0.0001 |
| No stent |
337 (6.1) |
230 (3.0) |
<0.0001 |
| BMS onlyA |
1,681 (30) |
676 (8.7) |
| DES usedA |
3,503 (63) |
6,831 (88) |
| New-generation DES used |
3,472 (63) |
6,711 (87) |
<0.0001 |
| IVUS or OCT used |
3,548 (64) |
6,190 (80) |
<0.0001 |
| IVUS used |
3,524 (64) |
6,105 (79) |
<0.0001 |
| OCT used |
69 (1.3) |
219 (2.8) |
<0.0001 |
| Transradial approach |
1,100 (20) |
3,873 (50) |
<0.0001 |
| Transfemoral approachA |
4,110 (74) |
2,877 (37) |
<0.0001 |
| Staged PCI |
1,256 (23) |
1,394 (18) |
<0.0001 |
| Baseline medication |
| Antiplatelet therapy |
| Thienopyridine |
5,366 (97.2) |
7,677 (99.2) |
<0.0001 |
| Ticlopidine |
117/5,366 (2.2) |
241/7,677 (3.1) |
<0.0001 |
| Clopidogrel |
5,167/5,366 (96.3) |
7,404/7,677 (96.4) |
| Others |
82/5,366 (1.5) |
32/7,677 (0.4) |
| Aspirin |
5,429 (98.3) |
7,681 (99.3) |
<0.0001 |
| Cilostazol |
132 (2.4) |
225 (2.9) |
0.07 |
| Other medications |
| StatinsA |
4,562 (83) |
5,706 (74) |
<0.0001 |
| High-intensity statinsC |
91 (1.7) |
120 (1.6) |
0.66 |
| β-blockersA |
2,805 (51) |
2,399 (31) |
<0.0001 |
| ACEI/ARBA |
4,124 (75) |
4,403 (57) |
<0.0001 |
| Nitrates |
972 (18) |
1,591 (21) |
<0.0001 |
| Calcium channel blockersA |
1,287 (23) |
3,933 (51) |
<0.0001 |
| Nicorandil |
1,063 (19) |
1,157 (15) |
<0.0001 |
| Oral anticoagulantsA |
661 (12) |
743 (9.6) |
<0.0001 |
| Warfarin |
583 (11) |
640 (8.3) |
<0.0001 |
| Direct oral anticoagulants |
79 (1.4) |
104 (1.3) |
0.67 |
| Proton pump inhibitors or H2-blockersA |
4,689 (85) |
5,545 (72) |
<0.0001 |
| Proton pump inhibitors |
4,034 (73) |
4,614 (60) |
<0.0001 |
| H2-blockers |
679 (12) |
980 (13) |
0.53 |
Continuous variables are expressed as the mean±SD or median [interquartile range]. Categorical variables are expressed as n (percentage). ARisk-adjusting variable selected for the Cox proportional hazard models. BSevere frailty was regarded as present when an inability to perform usual activities of daily living was documented in the hospital charts. CHigh-intensity statin therapy was defined as statin doses greater than or equal to atorvastatin 20 mg, pitavastatin 4 mg, or rosuvastatin 10 mg. ACEI, angiotensin-converting enzyme inhibitor; ACS, acute coronary syndrome; ARB, angiotensin II receptor blocker; ARC, Academic Research Consortium; CAD, coronary artery disease; CKD, chronic kidney disease; DES, drug-eluting stents; eGFR, estimated glomerular filtration rate; Hb, hemoglobin; HBR, high bleeding risk; IVUS, intravascular ultrasound; LAD, left anterior descending coronary artery; LMCA, left main coronary artery; LVEF, left ventricular ejection fraction; MI, myocardial infarction; NSTEMI, non-ST-elevation myocardial infarction; OCT, optical coherence tomography; PCI, percutaneous coronary intervention; STEMI, ST-elevation myocardial infarction.
To compare outcome measures based on combinations of the clinical presentation and HBR, the effect of each category of interest (ACS/HBR, ACS/No-HBR, and stable CAD/HBR) relative to the reference category (stable CAD/No-HBR) was estimated with dummy variables and expressed as HRs and their 95% CIs. The adjusted risks were estimated using a multivariable Cox proportional hazard model by incorporating the dummy variables together with the 27 risk-adjusting variables, obtained by removing 9 variables related to ARC-HBR from the 36 risk-adjusting variables used for the comparison between ACS and stable CAD.
Statistical analyses were conducted by a physician (M.N.) and by a statistician (T.M.) in JMP 14.0 and SAS 9.2 (SAS Institute, Cary, NC, USA) software. All statistical analyses were 2-tailed, and P<0.05 was considered statistically significant.
Results
Study Population
Among 13,258 patients, there were 5,521 patients (42%) who presented with ACS (ACS group) and 7,737 patients (58%) who presented with stable CAD (stable CAD group). In the ACS group, there were 4,081 patients (74%) with STEMI and 1,440 patients (26%) with non-ST-elevation ACS (NSTEACS), including 1,235 patients (22%) with NSTEMI and 205 patients (3.7%) with UA. Patients were further divided into 4 groups of combinations based on the clinical presentation (ACS, stable CAD) and the presence of ARC-HBR (ACS/HBR: 2,502 patients; ACS/No-HBR: 3,019 patients; stable CAD/HBR: 3,905 patients; stable CAD/No-HBR: 3,832 patients;
Figure 1).
Baseline Characteristics: ACS vs. Stable CAD
In the present study population, 48% of patients had ARC-HBR. Patients in the ACS group were younger, were more often men and current smokers, had a smaller body mass index, and more often had heart failure and severe frailty than those in the stable CAD group (Table 1).
In terms of procedural characteristics, the total number of stents was greater, total stent length was longer, and minimum stent size was smaller in the stable CAD than ACS group. The transfemoral approach was more often selected in the ACS than stable CAD group. Regarding baseline medications, patients in the ACS group more often received statins, β-blockers, angiotensin-converting enzyme inhibitors/angiotensin II receptor blockers, oral anticoagulants, and proton pump inhibitors/H2-blockers than those in the stable CAD group. The prevalence of high-intensity statins therapy was very low in both groups (Table 1).
Long-Term Clinical Outcomes: ACS vs. Stable CAD
The median follow-up duration for survivors was 6.0 years (IQR 5.1–6.8 years), and complete 1-, 3-, and 5-year clinical follow-up data were obtained for 96.9%, 93.4%, and 78.6% of patients, respectively. The cumulative incidence of persistent discontinuation of DAPT was significantly higher in the ACS than stable CAD group, indicating that DAPT duration was significantly shorter in the ACS than stable CAD group (Supplementary Figure 1).
The cumulative 5-year incidence of the primary bleeding outcome measure (BARC Type 3 or 5 bleeding) was significantly higher in the ACS than stable CAD group (Table 2; Figure 2A). In the 30-day landmark analysis, cumulative incidence of the primary bleeding outcome measure was much higher in the ACS than stable CAD group within 30 days (Table 3; Figure 2B). After adjusting confounders, the excess risk of ACS relative to stable CAD for the primary bleeding outcome measure remained significant during the entire follow-up period, and within 30-days, whereas it was no longer significant beyond 30 days (Tables 2,3). Regarding the types of bleeding, the cumulative incidence for each of access site bleeding, gastrointestinal bleeding, and other bleeding was significantly higher in the ACS than stable CAD group, whereas the cumulative incidence of intracranial bleeding did not differ between the 2 groups (Table 2). The cumulative incidence of the primary bleeding outcome measure did not differ between STEMI and NSTEACS (Supplementary Figure 2A).
Table 2.
Clinical Outcomes
| |
No. patients with event
(cumulative 5-year incidence; %) |
Univariate |
Multivariable |
ACS
(n=5,521) |
Stable CAD
(n=7,737) |
HR
(95% CI) |
P value |
HR
(95% CI) |
P value |
| Major bleeding |
| BARC Type 3 or 5 |
1,153 (20.9) |
1,200 (15.2) |
1.5 (1.38–1.62) |
<0.0001 |
1.65 (1.49–1.84) |
<0.0001 |
| Access site bleeding |
287 (5.3) |
121 (1.6) |
3.47 (2.81–4.29) |
<0.0001 |
NA |
|
| Gastrointestinal bleeding |
295 (6.2) |
397 (5.4) |
1.18 (1.01–1.37) |
0.03 |
NA |
|
| Intracranial bleeding |
123 (2.4) |
200 (2.7) |
0.98 (0.79–1.23) |
0.88 |
NA |
|
| Others |
448 (8.6) |
482 (6.4) |
1.45 (1.28–1.65) |
<0.0001 |
NA |
|
| BARC Type 5 |
52 (1.0) |
70 (0.9) |
1.12 (0.78–1.6) |
0.54 |
1.48 (0.93–2.34) |
0.1 |
GUSTO moderate/severe
bleeding |
934 (16.9) |
1,066 (13.4) |
1.34 (1.23–1.46) |
<0.0001 |
1.51 (1.35–1.69) |
<0.0001 |
| GUSTO severe bleeding |
423 (7.5) |
530 (6.7) |
1.2 (1.06–1.36) |
0.005 |
1.34 (1.14–1.58) |
0.0004 |
| Hemorrhagic stroke |
93 (1.6) |
143 (1.7) |
0.99 (0.76–1.28) |
0.91 |
0.91 (0.65–1.28) |
0.59 |
| MIA/Ischemic stroke |
608 (10.9) |
896 (10.8) |
1.0 (0.91–1.11) |
0.94 |
1.07 (0.94–1.22) |
0.33 |
| MI |
| ARC definition |
338 (6.1) |
566 (7.0) |
0.87 (0.76–0.99) |
0.048 |
0.83 (0.7–0.99) |
0.04 |
| ARTS definition |
309 (5.5) |
402 (4.9) |
1.15 (0.99–1.34) |
0.06 |
1.11 (0.91–1.34) |
0.3 |
| Ischemic stroke |
293 (5.4) |
377 (4.5) |
1.18 (1.01–1.37) |
0.04 |
1.49 (1.23–1.81) |
<0.0001 |
| CV death/MI/ischemic stroke |
1,226 (21.1) |
1,390 (16.2) |
1.31 (1.21–1.41) |
<0.0001 |
1.55 (1.41–1.71) |
<0.0001 |
| All-cause death |
1,241 (20.3) |
1,435 (15.4) |
1.3 (1.21–1.41) |
<0.0001 |
1.72 (1.56–1.89) |
<0.0001 |
| Cardiac death |
680 (12.0) |
526 (5.9) |
1.93 (1.73–2.17) |
<0.0001 |
2.43 (2.11–2.81) |
<0.0001 |
| CV death |
749 (13.1) |
671 (7.5) |
1.67 (1.51–1.86) |
<0.0001 |
2.16 (1.89–2.46) |
<0.0001 |
| Non-CV death |
492 (8.3) |
764 (8.6) |
0.98 (0.87–1.1) |
0.7 |
1.22 (1.06–1.41) |
0.007 |
| Definite stent thrombosis |
78 (1.3) |
37 (0.5) |
3.13 (2.11–4.62) |
<0.0001 |
2.66 (1.6–4.41) |
0.0002 |
| Target vessel revascularization |
1,061 (20.6) |
1,365 (17.6) |
1.23 (1.13–1.33) |
<0.0001 |
1.18 (1.06–1.31) |
0.002 |
| Any coronary revascularization |
1,464 (28.6) |
2,051 (26.5) |
1.13 (1.06–1.21) |
0.0003 |
1.08 (0.99–1.17) |
0.1 |
The number of patients with an event was counted until the end of follow-up. Cumulative 5-year incidence was estimated by the Kaplan-Meier method. Hazard ratios (HRs) with 95% confidence intervals (CIs) of the ACS group relative to the stable CAD group for the outcome measures were estimated throughout the entire follow-up period using Cox proportional hazard models. AMI as a component of the composite outcome measure was adjudicated according to the ARC definition. ARTS, Arterial Revascularization Therapy Study; BARC, Bleeding Academic Research Consortium; GUSTO, Global Utilization of Streptokinase and Tissue Plasminogen Activator for Occluded Coronary Arteries; NA, multivariable HRs were not estimated due to the small number of events. Other abbreviations as in Table 1.

Table 3.
Clinical Outcomes Within and Beyond 30 Days
| |
No. patients with event
(cumulative 5-year incidence; %) |
Univariate |
Multivariable |
ACS
(n=5,521) |
Stable CAD
(n=7,737) |
HR
(95% CI) |
P value |
HR
(95% CI) |
P value |
| Within 30 days |
| Major bleeding |
| BARC Type 3 or 5 |
607 (11.1) |
230 (3.0) |
3.87 (3.33–4.51) |
<0.0001 |
3.35 (2.78–4.04) |
<0.0001 |
| Access site bleeding |
269 (5.0) |
90 (1.2) |
4.32 (3.4–5.48) |
<0.0001 |
NA |
|
| Gastrointestinal bleeding |
88 (1.7) |
44 (0.6) |
3.0 (2.09–4.32) |
<0.0001 |
NA |
|
| Intracranial bleeding |
15 (0.3) |
12 (0.2) |
1.88 (0.88–4.01) |
0.1 |
NA |
|
| Others |
235 (4.4) |
84 (1.1) |
4.13 (3.22–5.3) |
<0.0001 |
NA |
|
| BARC Type 5 |
16 (0.3) |
3 (0.04) |
7.57 (2.2–26.0) |
0.0001 |
9.53 (2.04–44.6) |
0.004 |
| GUSTO moderate/severe bleeding |
425 (7.8) |
184 (2.4) |
3.35 (2.82–3.99) |
<0.0001 |
2.85 (2.3–3.53) |
<0.0001 |
| GUSTO severe bleeding |
152 (2.8) |
80 (1.0) |
2.72 (2.07–3.56) |
<0.0001 |
2.2 (1.56–3.09) |
<0.0001 |
| Hemorrhagic stroke |
12 (0.2) |
4 (0.05) |
4.31 (1.39–13.4) |
0.006 |
3.31 (0.8–13.7) |
0.1 |
| MIA/ischemic stroke |
187 (3.5) |
302 (3.9) |
0.87 (0.73–1.05) |
0.15 |
0.77 (0.61–0.98) |
0.03 |
| MI |
| ARC definition |
111 (2.1) |
274 (3.5) |
0.57 (0.46–0.71) |
<0.0001 |
0.52 (0.39–0.68) |
<0.0001 |
| ARTS definition |
78 (1.5) |
98 (1.3) |
1.14 (0.84–1.53) |
0.4 |
0.86 (0.59–1.27) |
0.46 |
| Ischemic stroke |
78 (1.5) |
32 (0.4) |
3.52 (2.33–5.3) |
<0.0001 |
2.99 (1.79–5.0) |
<0.0001 |
Cardiovascular death/MI/
ischemic stroke |
446 (8.1) |
323 (4.2) |
1.95 (1.69–2.25) |
<0.0001 |
1.79 (1.49–2.15) |
<0.0001 |
| All-cause death |
287 (5.2) |
32 (0.4) |
12.9 (8.94–18.6) |
<0.0001 |
8.55 (5.63–13.0) |
<0.0001 |
| Cardiac death |
282 (5.1) |
27 (0.4) |
15.0 (10.0–22.2) |
<0.0001 |
9.47 (6.06–14.8) |
<0.0001 |
| Cardiovascular death |
282 (5.1) |
28 (0.4) |
14.45 (9.8–21.3) |
<0.0001 |
9.19 (5.91–14.3) |
<0.0001 |
| Non-cardiovascular death |
5 (0.1) |
4 (0.05) |
1.83 (0.49–6.81) |
0.36 |
1.98 (0.37–10.7) |
0.43 |
| Definite stent thrombosis |
42 (0.8) |
14 (0.2) |
4.31 (2.35–7.88) |
<0.0001 |
2.88 (1.33–6.22) |
0.007 |
| Target vessel revascularization |
159 (3.0) |
72 (0.9) |
3.22 (2.44–4.25) |
<0.0001 |
2.85 (2.0–4.05) |
<0.0001 |
| Any coronary revascularization |
196 (3.7) |
85 (1.1) |
3.37 (2.61–4.35) |
<0.0001 |
3.03 (2.21–4.17) |
<0.0001 |
| Beyond 30 days |
| Major bleeding |
| BARC Type 3 or 5 |
546/4,703 (11.0) |
970/7,452 (12.6) |
0.9 (0.81–1.00) |
0.06 |
1.06 (0.93–1.22) |
0.33 |
| Access site bleeding |
18/4,703 (0.4) |
31/7,452 (0.4) |
0.93 (0.52–1.67) |
0.81 |
NA |
|
| Gastrointestinal bleeding |
207/4,703 (4.6) |
353/7,452 (4.8) |
0.94 (0.79–1.12) |
0.5 |
NA |
|
| Intracranial bleeding |
108/4,703 (2.1) |
188/7,452 (2.5) |
0.92 (0.73–1.17) |
0.51 |
NA |
|
| Others |
213/4,703 (4.4) |
398/7,452 (5.4) |
0.86 (0.73–1.02) |
0.08 |
NA |
|
| BARC Type 5 |
36/5,182 (0.7) |
67/7,674 (0.9) |
0.82 (0.55–1.23) |
0.33 |
1.0 (0.6–1.68) |
0.99 |
| GUSTO moderate/severe bleeding |
509/4,884 (9.9) |
882/7,498 (11.3) |
0.9 (0.81–1.01) |
0.06 |
1.04 (0.9–1.2) |
0.58 |
| GUSTO severe bleeding |
271/5,096 (4.9) |
450/7,602 (5.7) |
0.92 (0.79–1.07) |
0.29 |
1.04 (0.86–1.27) |
0.66 |
| Hemorrhagic stroke |
81/5,175 (1.3) |
139/7,670 (1.7) |
0.89 (0.67–1.17) |
0.39 |
0.81 (0.57–1.15) |
0.24 |
| MIA/ischemic stroke |
421/5,016 (7.7) |
594/7,382 (7.2) |
1.07 (0.95–1.21) |
0.27 |
1.27 (1.08–1.49) |
0.004 |
| MI |
| ARC definition |
227/5,081 (4.1) |
292/7,408 (3.6) |
1.17 (0.98–1.39) |
0.08 |
1.2 (0.96–1.51) |
0.11 |
| ARTS definition |
231/5,114 (4.1) |
304/7,582 (3.6) |
1.16 (0.98–1.38) |
0.09 |
1.21 (0.97–1.51) |
0.1 |
| Ischemic stroke |
215/5,115 (4.0) |
345/7,644 (4.1) |
0.95 (0.8–1.13) |
0.57 |
1.3 (1.05–1.61) |
0.02 |
Cardiovascular death/MI/
ischemic stroke |
780/5,016 (14.1) |
1,067/7,382 (12.5) |
1.11 (1.01–1.21) |
0.03 |
1.39 (1.24–1.57) |
<0.0001 |
| All-cause death |
954/5,180 (15.9) |
1,403/7,674 (15.1) |
1.03 (0.95–1.12) |
0.44 |
1.33 (1.2–1.48) |
<0.0001 |
| Cardiac death |
398/5,180 (7.2) |
499/7,674 (5.6) |
1.21 (1.06–1.38) |
0.004 |
1.61 (1.36–1.9) |
<0.0001 |
| Cardiovascular death |
467/5,180 (8.4) |
643/7,674 (7.2) |
1.1 (0.98–1.24) |
0.11 |
1.47 (1.26–1.7) |
<0.0001 |
| Non-cardiovascular death |
487/5,180 (8.2) |
760/7,674 (8.5) |
0.97 (0.87–1.09) |
0.65 |
1.22 (1.05–1.41) |
0.009 |
| Definite stent thrombosis |
36/5,142 (0.5) |
23/7,662 (0.3) |
2.39 (1.42–4.04) |
0.0007 |
2.53 (1.28–5.0) |
0.007 |
| Target vessel revascularization |
902/5,033 (18.2) |
1,293/7,604 (16.8) |
1.11 (1.02–1.21) |
0.01 |
1.07 (0.96–1.19) |
0.24 |
| Any coronary revascularization |
1,268/5,002 (25.8) |
1,966/7,591 (25.7) |
1.03 (0.96–1.11) |
0.41 |
0.98 (0.89–1.07) |
0.62 |
In the landmark analysis beyond 30 days, the number of patients with an event was counted until the end of follow-up, whereas the cumulative incidence was estimated by the Kaplan-Meier method between 30 days and 5 years. HRs with 95% CIs of the ACS group relative to the stable CAD group for the outcome measures were estimated throughout the entire follow-up period using Cox proportional hazard models. AMI as a component of the composite outcome measure was adjudicated according to the ARC definition. Abbreviations as in Tables 1,2.
The cumulative 5-year incidence of the primary ischemic outcome measure was not significantly different between the 2 groups during the entire follow-up period, or within 30 days (Tables 2,3;
Figure 2C,D). After adjusting for confounders, the excess risk of ACS relative to stable CAD for the primary ischemic outcome measure remained not significant (Table 2). The risk of ACS relative to stable CAD for the primary ischemic outcome measure was significantly lower within 30 days, but higher beyond 30 days (Table 3). The excess risk of ACS relative to stable CAD was significant for all-cause death, cardiac death, cardiovascular death, non-cardiovascular death, ischemic stroke, definite stent thrombosis, and target vessel revascularization, but not for myocardial infarction by the ARTS definition (Table 2). The cumulative incidence of the primary ischemic outcome measure did not differ between STEMI and NSTEACS (Supplementary Figure 2B).
Baseline Characteristics According to Clinical Presentation and HBR
Baseline characteristics and medications were significantly different across the 4 categories according to clinical presentation (ACS and stable CAD) and the presence of ARC-HBR (Table 4). Patients in the ACS/HBR group were older, had a lower body mass index, and more often had heart failure and severe frailty.
Table 4.
Baseline Characteristics and Medications According to the Clinical Presentation and HBR
| |
ACS/HBR
(n=2,502) |
ACS/No-HBR
(n=3,019) |
Stable CAD/HBR
(n=3,905) |
Stable CAD/No-HBR
(n=3,832) |
P value |
| Clinical characteristics |
| Age (years) |
75.3±11.0 |
63.3±10.9 |
74.3±9.3 |
65.5±9.3 |
<0.0001 |
| Age ≥75 years |
1,551 (62) |
396 (13) |
2,228 (57) |
506 (13) |
<0.0001 |
| Male sexA |
1,633 (65) |
2,450 (81) |
2,654 (68) |
2,935 (77) |
<0.0001 |
| Body mass index (kg/m2) |
22.8±3.6 (2,419) |
24.4±3.5 (2,970) |
23.3±3.6 (3,868) |
24.5±3.5 (3,817) |
<0.0001 |
| Body mass index <25.0 kg/m2 A |
1,931 (77) |
1,888 (63) |
2,818 (72) |
2,264 (59) |
<0.0001 |
| Acute MI |
2,419 (97) |
2,897 (96) |
0 (0) |
0 (0) |
<0.0001 |
| STEMI |
1,848 (74) |
2,233 (74) |
0 (0) |
0 (0) |
<0.0001 |
| NSTEMI |
571 (23) |
664 (22) |
0 (0) |
0 (0) |
<0.0001 |
| Unstable angina |
83 (3.3) |
122 (4.0) |
0 (0) |
0 (0) |
<0.0001 |
| HypertensionA |
2,070 (83) |
2,333 (77) |
3,420 (88) |
3,077 (80) |
<0.0001 |
| DiabetesA |
902 (36) |
984 (33) |
1,677 (43) |
1,476 (39) |
<0.0001 |
| On insulin therapy |
183 (7.3) |
98 (3.3) |
495 (13) |
315 (8.2) |
<0.0001 |
| Current smokerA |
572 (23) |
1,432 (47) |
644 (16) |
1,024 (27) |
<0.0001 |
| Heart failureA |
1,036 (41) |
643 (21) |
1,025 (26) |
413 (11) |
<0.0001 |
| Multivessel diseaseA |
1,516 (61) |
1,574 (52) |
2,450 (63) |
2,061 (54) |
<0.0001 |
| LVEF (%) |
53.1±13.1 (2,171) |
56.9±11.6 (2,753) |
59.4±13.8 (3,343) |
62.9±11.6 (3,264) |
<0.0001 |
| LVEF ≤40% |
378/2,171 (17) |
203/2,753 (7.4) |
381/3,343 (11) |
175/3,264 (5.4) |
<0.0001 |
| Mitral regurgitation grade 3/4 |
307/2,250 (14) |
142/2,810 (5.1) |
344/3,360 (10) |
101/3,280 (3.1) |
<0.0001 |
| Prior MIA |
92 (3.7) |
56 (1.9) |
742 (19) |
570 (15) |
<0.0001 |
| Prior stroke |
546 (22) |
60 (2.0) |
945 (24) |
148 (3.9) |
<0.0001 |
| Prior hemorrhagic stroke |
125 (5.0) |
0 (0) |
179 (4.6) |
0 (0) |
<0.0001 |
| Prior ischemic stroke |
447 (18) |
60 (2.0) |
811 (21) |
148 (3.9) |
<0.0001 |
| Peripheral vascular diseaseA |
135 (5.4) |
52 (1.7) |
720 (18) |
306 (8.0) |
<0.0001 |
| Atrial fibrillationA |
394 (16) |
91 (3.0) |
708 (18) |
93 (2.4) |
<0.0001 |
| Chronic obstructive pulmonary diseaseA |
117 (4.7) |
82 (2.7) |
190 (4.9) |
130 (3.4) |
<0.0001 |
| Liver cirrhosis |
118 (4.7) |
0 (0) |
217 (5.6) |
0 (0) |
<0.0001 |
| Malignancy |
415 (17) |
180 (6.0) |
774 (20) |
308 (8.0) |
<0.0001 |
| Active malignancy |
89 (3.6) |
0 (0) |
181 (4.6) |
0 (0) |
<0.0001 |
| Severe frailtyA,B |
276 (11) |
27 (0.9) |
216 (5.5) |
31 (0.8) |
<0.0001 |
| Chronic kidney disease |
| Moderate (eGFR 30–59 mL/min/1.73 m2) |
1,160 (46) |
506 (17) |
1,915 (49) |
594 (16) |
<0.0001 |
| Severe CKD |
464 (19) |
0 (0) |
733 (19) |
0 (0) |
<0.0001 |
| eGFR <30 mL/min/1.73 m2 |
| Not on dialysis |
322 (13) |
0 (0) |
264 (6.8) |
0 (0) |
<0.0001 |
| On dialysis |
142 (5.7) |
0 (0) |
469 (12) |
0 (0) |
<0.0001 |
| Severe anemia (Hb <11 g/dL) |
603 (24) |
0 (0) |
1,029 (26) |
0 (0) |
<0.0001 |
Mild anemia (Hb 11–12.9 g/dL for men,
11–11.9 g/dL for women) |
748 (30) |
135 (4.5) |
1,472 (38) |
342 (8.9) |
<0.0001 |
| Thrombocytopenia (platelets <100×109/L) |
111 (4.4) |
0 (0) |
151 (3.9) |
0 (0) |
<0.0001 |
| Procedural characteristics |
| No. target lesions |
1.47±0.81 |
1.44±0.75 |
1.5±0.78 |
1.49±0.79 |
0.006 |
| Target of proximal LADA |
1,414 (57) |
1,747 (58) |
2,406 (62) |
2,432 (63) |
<0.0001 |
| Target of unprotected LMCAA |
139 (5.6) |
111 (3.7) |
191 (4.9) |
150 (3.9) |
0.001 |
| Target of chronic total occlusionA |
120 (4.8) |
106 (3.5) |
527 (14) |
578 (15) |
<0.0001 |
| Target of bifurcationA |
908 (36) |
1,148 (38) |
1,577 (40) |
1,609 (42) |
<0.0001 |
| Side-branch stentingA |
72 (2.9) |
95 (3.2) |
162 (4.2) |
195 (5.1) |
<0.0001 |
| Total number of stents |
| Median [IQR] |
1 [1–2] |
1 [1–2] |
2 [1–3] |
1 [1–2] |
<0.0001 |
| Mean±SD |
1.88±1.34 (n=2,276) |
1.74±1.19 (n=2,908) |
2.01±1.37 (n=3,769) |
1.97±1.39 (n=3,738) |
|
| Total stent length (mm) |
| Median [IQR] |
28 [18–51] |
26 [18–45] |
33 [18–56] |
28 [18–56] |
<0.0001 |
| Mean±SD |
40.1±32.5 (n=2,275) |
36.4±28.4 (n=2,907) |
44.2±34.3 (n=3,769) |
43.0±35.2 (n=3,738) |
|
| Total stent length >28 mmA |
1,081 (43) |
1,211 (40) |
2,070 (53) |
1,861 (49) |
<0.0001 |
| Minimum stent size (mm) |
2.88±0.45 (n=2,275) |
2.96±0.47 (n=2,908) |
2.8±0.41 (n=3,769) |
2.84±0.44 (n=3,738) |
<0.0001 |
| Minimum stent size <3.0 mmA |
1,154 (46) |
1,280 (42) |
2,191 (56) |
2,046 (53) |
<0.0001 |
| No stent |
226 (9.0) |
111 (3.7) |
136 (3.5) |
94 (2.5) |
<0.0001 |
| BMS onlyA |
736 (29) |
945 (31) |
387 (9.9) |
289 (7.5) |
| DES usedA |
1,540 (62) |
1,963 (65) |
3,382 (87) |
3,449 (90) |
| New-generation DES used |
1,525 (61) |
1,947 (64) |
3,315 (85) |
3,396 (89) |
<0.0001 |
| IVUS or OCT use |
1,541 (62) |
2,007 (66) |
3,117 (80) |
3,073 (80) |
<0.0001 |
| IVUS used |
1,532 (61) |
1,992 (66) |
3,072 (79) |
3,033 (79) |
<0.0001 |
| OCT used |
20 (0.8) |
49 (1.6) |
110 (2.8) |
109 (2.8) |
<0.0001 |
| Transradial approach |
435 (17) |
665 (22) |
1,727 (44) |
2,146 (56) |
<0.0001 |
| Transfemoral approachA |
1,901 (76) |
2,209 (73) |
1,597 (41) |
1,280 (33) |
<0.0001 |
| Staged PCI |
516 (21) |
740 (25) |
688 (18) |
706 (18) |
<0.0001 |
| Baseline medication |
| Antiplatelet therapy |
| Thienopyridine |
2,391 (95.6) |
2,975 (98.5) |
3,864 (99.0) |
3,813 (99.5) |
<0.0001 |
| Ticlopidine |
57/2,391 (2.4) |
60/2,975 (2.0) |
153/3,864 (4.0) |
88/3,813 (2.3) |
<0.0001 |
| Clopidogrel |
2,321/2,391 (97.1) |
2,846/2,975 (95.7) |
3,704/3,864 (95.9) |
3,700/3,813 (97.0) |
| Others |
13/2,391 (0.5) |
69/2,975 (2.3) |
7/3,864 (0.2) |
25/3,813 (0.7) |
| Aspirin |
2,438 (97.4) |
2,991 (99.1) |
3,865 (99.0) |
3,816 (99.6) |
<0.0001 |
| Cilostazol |
63 (2.5) |
69 (2.3) |
154 (3.9) |
71 (1.9) |
<0.0001 |
| Other medications |
| StatinsA |
1,864 (75) |
2,698 (89) |
2,548 (65) |
3,158 (82) |
<0.0001 |
| High-intensity statinsC |
32 (1.3) |
59 (2.0) |
45 (1.2) |
75 (2.0) |
0.006 |
| β-blockersA |
1,270 (51) |
1,535 (51) |
1,393 (36) |
1,006 (26) |
<0.0001 |
| ACEI/ARBA |
1,723 (69) |
2,401 (80) |
2,380 (61) |
2,023 (53) |
<0.0001 |
| Nitrates |
417 (17) |
555 (18) |
816 (21) |
775 (20) |
<0.0001 |
| Calcium channel blockersA |
641 (26) |
646 (21) |
2,062 (53) |
1,871 (49) |
<0.0001 |
| Nicorandil |
542 (22) |
521 (17) |
645 (17) |
512 (13) |
<0.0001 |
| Oral anticoagulants |
661 (26) |
0 (0) |
743 (19) |
0 (0) |
<0.0001 |
| Warfarin |
583 (23) |
0 (0) |
640 (16) |
0 (0) |
<0.0001 |
| Direct oral anticoagulants |
79 (3.2) |
0 (0) |
104 (2.7) |
0 (0) |
<0.0001 |
| Proton pump inhibitor or H2-blockersA |
2,118 (85) |
2,571 (85) |
2,901 (74) |
2,644 (69) |
<0.0001 |
| Proton pump inhibitor |
1,852 (74) |
2,182 (72) |
2,434 (62) |
2,180 (57) |
<0.0001 |
| H2-blockers |
279 (11) |
400 (13) |
496 (13) |
484 (13) |
0.12 |
Continuous variables are expressed as the mean±SD or median [interquartile range]. Categorical variables are expressed as n (percentage). ARisk-adjusting variable selected for the Cox proportional hazard models. BSevere frailty was regarded as present when an inability to perform usual activities of daily living was documented in the hospital charts. CHigh-intensity statin therapy was defined as statin doses greater than or equal to atorvastatin 20 mg, pitavastatin 4 mg, or rosuvastatin 10 mg. Abbreviations as in Table 1.
Across the 4 groups, the cumulative incidence of persistent discontinuation of DAPT was highest in the ACS/HBR group (Supplementary Figure 3).
The cumulative 5-year incidence of the primary bleeding outcome measure decreased in the order of ACS/HBR, stable CAD/HBR, and ACS/No-HBR, followed by the stable CAD/No-HBR group (Supplementary Table 1; Figure 3A). Within 30 days, the cumulative incidence of the primary bleeding outcome measure was higher in the 2 ACS groups with and without HBR than in the 2 stable CAD groups with and without HBR (Supplementary Table 1; Figures 3B,4). The adjusted risk for the primary bleeding outcome measure was much higher in the ACS/HBR group, and moderately higher in the ACS/No-HBR and stable CAD/HBR groups than in the stable CAD/No-HBR group (HR 3.05 [95% CI 2.64–3.54; P<0.0001], HR 1.69 [95% CI 1.45–1.98; P<0.0001], and HR 1.89 [95% CI 1.66–2.15; P<0.0001], respectively;
Supplementary Table 2). Within 30 days, the adjusted risk for the primary bleeding outcome measure was much higher in the 2 ACS groups with and without HBR, and moderately higher in the stable CAD/HBR group than in the stable CAD/No-HBR group (Supplementary Table 2). Beyond 30 days, the adjusted risk for the primary bleeding outcome measure was significantly higher in the 2 HBR groups with and without ACS than in the stable CAD/No-HBR group (Supplementary Table 2).
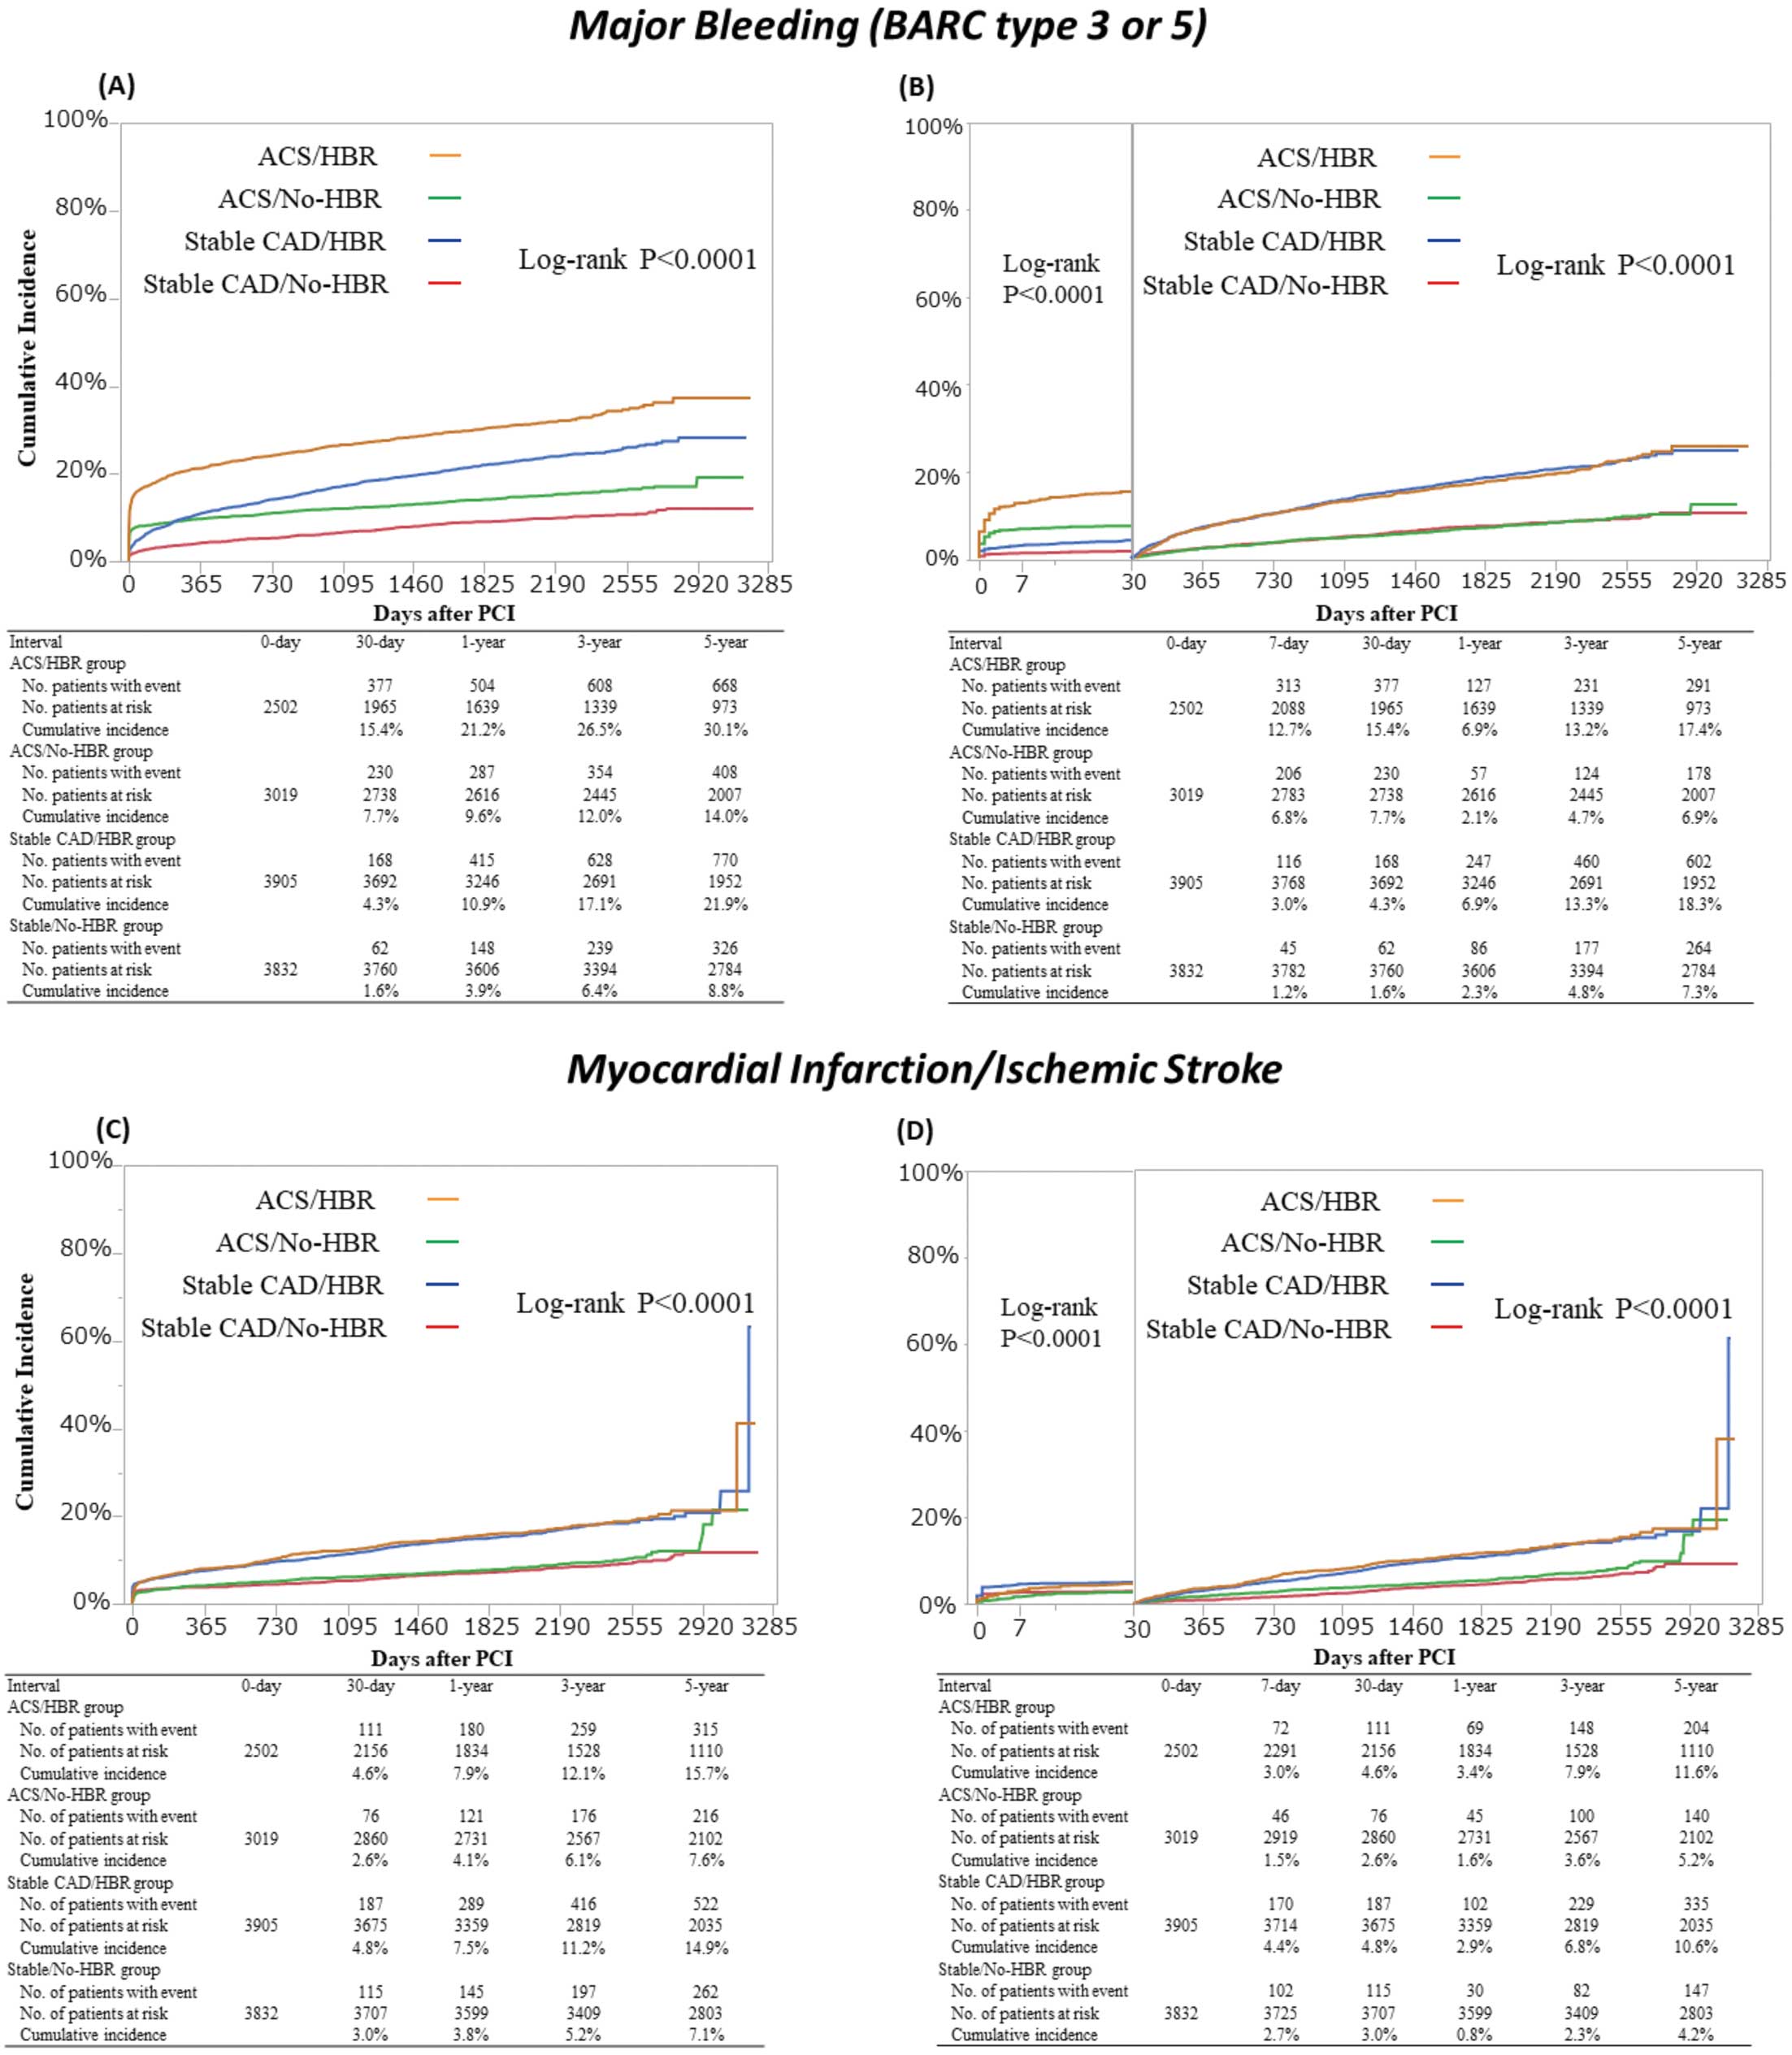

The cumulative 5-year incidence of the primary ischemic outcome measure was significantly higher in the 2 HBR groups than in the 2 No-HBR groups throughout the entire follow-up period (Supplementary Table 1; Figure 3C), as well as within and beyond 30 days (Figure 3D). The adjusted risk for the primary ischemic outcome measure was moderately higher in the 2 HBR groups than in the stable CAD/No-HBR group, whereas it was not significantly different between the ACS/No-HBR and stable CAD/No-HBR groups (Supplementary Table 2).
Primary Bleeding Outcome Measure at 30 Days According to Approach Site
The cumulative 30-day incidence of the primary bleeding outcome measure (BARC Type 3 or 5 bleeding) was significantly higher in patients with a femoral than radial approach (Supplementary Figure 4).
Discussion
The main findings of this study are that: (1) bleeding risk after PCI was dependent on both ACS presentation and HBR, with a significant effect of ACS within but not beyond 30 days; (2) the 30-day rate of major bleeding was very high in patients with ACS regardless of HBR; and (3) long-term ischemic risk after PCI was largely dependent on HBR.
Patients with ACS reportedly have a high risk for cardiovascular events after PCI. However, there are only a few large-scale studies comparing long-term outcomes after PCI between ACS and stable CAD. In the first-generation DES era, we reported that patients with acute myocardial infarction (AMI) had a higher risk of a composite of cardiac death or myocardial infarction, and definite stent thrombosis than patients without AMI, although the excess risk was limited to the early period within 3 months.1
In the NOBORI-2 study, the risk for cardiac death was significantly higher in patients with NSTEMI than in those with stable CAD.13
In the present study, which enrolled patients in the new-generation DES era, comparing ACS and stable CAD patients revealed that the former were also associated with a higher risk of cardiac death or definite stent thrombosis. However, the higher risk of ACS patients for cardiac death was driven primarily by the excess cardiac death within 30 days. Conventional endpoints including mortality outcomes may be heavily biased for estimating the ischemic risk of ACS patients, because they would be highly influenced by the index ACS event, but not related to the new cardiovascular events after ACS. It is true that the risk for definite stent thrombosis was higher in ACS than stable CAD patients, but the absolute difference in event rate was very small. The excess risk of ACS patients relative to stable CAD patients was not demonstrated for the primary ischemic outcome measure of a composite of myocardial infarction or ischemic stroke in the present study. The current guidelines recommend DAPT for at least 1 year in patients with ACS, if not at HBR, based on the premise that ACS patients are associated with a much higher risk for ischemic events than stable CAD patients.2
However, given the similar risk for the primary ischemic outcome measure of a composite of myocardial infarction or ischemic stroke in ACS patients compared with stable CAD patients, shorter-duration DAPT may be an option even in ACS patients to reduce bleeding events. The ShorT and OPtimal Duration of Dual AntiPlatelet Therapy-2 Study for the Patients With ACS (STOPDAPT-2 ACS) trial has just finished enrollment of 4,100 patients to evaluate the safety and efficacy of 1-month DAPT followed by clopidogrel monotherapy vs. 12-month DAPT with aspirin and clopidogrel in all-comer patients with ACS undergoing PCI with cobalt-chromium everolimus-eluting stent (XIENCETM; ClinicalTrials.gov ID: NCT03462498).
Previous studies in ACS patients have reported relatively high rates of major bleeding. The rate of Thrombolysis in Myocardial Infarction (TIMI) major/minor bleeding was 5.9% in the prasugurel group and 4.8% in the clopidogrel group at 15 months after PCI in STEMI patients in the TRITON-TIMI 38 trial.14
In the Platelet Inhibition and Patient Outcomes (PLATO) trial, the cumulative 1-year incidence of TIMI major/minor bleeding was 7.9% in the ticagrelor group and 7.7% in the clopidogrel group, which is higher than the cut-off value of 4%/year in the ARC-HBR definition.5,15
In a meta-analysis of 3 randomized trials of patients with ACS undergoing PCI with bivalirudin or heparin plus a glycoprotein IIb/IIIa inhibitor, the rate of TIMI major/minor bleeding was high (5.3% at 30 days).16
However, no previous studies compared the bleeding risk between patients with ACS and patients with stable CAD after PCI. In the present study, ACS patients, compared with stable CAD patients, were associated with a substantially higher risk of major bleeding, particularly within 30 days after PCI. The 30-day rate of major bleeding was unacceptably high (11.1%) in patients with ACS. Furthermore, higher 30-day bleeding risk in patients with ACS was present regardless of the presence of the ARC-HBR criteria, although ACS patients with HBR had higher 30-day bleeding risk than ACS patients without HBR. In fact, the cumulative incidence of persistent discontinuation of DAPT was significantly higher in the ACS than stable CAD group, which was mainly seen within 30 days after PCI. Higher bleeding risk within 30 days could have affected the shorter DAPT in the ACS than stable CAD group. ARC-HBR did not include ACS as an HBR criterion, presumably, in part, because increased bleeding risk in ACS is attributable to the more aggressive antiplatelet therapy rather than the ACS per se, and partly because there is no previous study comparing the bleeding risk between patients with ACS and those with stable CAD after PCI.5
The periprocedural use of antithrombotic agents, such as heparin and a loading dose of antiplatelet therapy, as well as the high prevalence of the transfemoral approach, could have increased the risk of bleeding in ACS patients. Indeed, in the present study the transradial approach was selected in only 20% of patients in the ACS group, compared with 50% in the stable CAD group. Furthermore, patients with a transfemoral approach had a significantly higher incidence of 30-day bleeding than those with a transradial approach. Further efforts are needed to reduce early bleeding events in ACS patients by selecting the transradial approach, the prophylactic use of gastrointestinal mucosa-protective agents, and an appropriate intensity of antithrombotic therapy before and early after PCI. In the Acetyl Salicylic Elimination Trial: The ASET Pilot Study (ASET), prasugrel monotherapy without aspirin immediately after successful new-generation DES implantation was associated with a favorable outcome without any stent thrombosis.17
Therefore, a completely aspirin-free strategy may be an option to reduce bleeding events early after PCI, if not associated with increasing ischemic events. We are launching the STOPDAPT-3 trial, which randomizes 3,000 patients with HBR and/or ACS before PCI to either an experimental arm of prasugrel monotherapy or a control arm of DAPT with aspirin and prasugrel (ClinicalTrials.gov ID: NCT04609111). The coprimary endpoints are BARC 3 or 5 bleeding (superiority) and a composite of cardiovascular death, myocardial infarction, ischemic stroke, or definite stent thrombosis (non-inferiority) at 30 days after PCI.
Another important finding in the present study was that the long-term ischemic risk after PCI was largely dependent on HBR, regardless of ACS. This observation is basically in line with previous reports. In the CREDO-Kyoto Registry Cohort-2, 43% of patients had ARC-HBR and this was associated not only with a higher bleeding risk, but also a higher ischemic risk.18
The vast majority of patients with high ischemic risk also had high- or intermediate bleeding risk.19
In the present study, 48% of patients had ARC-HBR, with higher associated risks for both bleeding and ischemic events. In HBR patients, the rate for BARC Type 3 or 5 bleeding was higher than that for myocardial infarction/ischemic stroke. In several randomized trials, more intensive antithrombotic therapy was reported to reduce cardiovascular events in patients with high ischemic risk.20–22
However, in real-world clinical practice, given the higher bleeding risk in most patients with high ischemic risk, it would not be realistic to intensify antithrombotic therapy in these patients. Indeed, recent trials exploring a shorter duration of DAPT after DES implantation, such as 1 month in STOPDAPT-2 and GLOBAL LEADERS: and 3 months in Ticagrelor With Aspirin or Alone in High-Risk Patients After Coronary Intervention (TWILIGHT) and Ticagrelor Monotherapy After 3 Months in the Patients Treated With New Generation Sirolimus Stent for Acute Coronary Syndrome (TICO), have suggested the benefit of shorter-duration DAPT followed by P2Y12
receptor blocker monotherapy in reducing bleeding events without increasing cardiovascular events.23–26
Further studies would be warranted to confirm these seminal observations to incorporate shorter DAPT regimens after PCI into practice guidelines.
Study Limitations
Several study limitations should be considered. First, the CREDO-Kyoto PCI/CABG Registry Cohort-3 was not designed to investigate the performance of ARC-HBC criteria, and therefore data were not available for some ARC-HBR criteria. The prevalence of HBR patients would have been underestimated in this study. Moreover, the original definitions of some of the ARC-HBR criteria (i.e., for liver cirrhosis, ischemic stroke, and previous bleeding) were somewhat different from those in the current registry, and approximation was needed when they were implemented retrospectively. Third, the clinical practice in this study was much different from current practice, in which there is more widespread use of a transradial approach, a higher prevalence of high-intensity statins therapy, the use of a new P2Y12
receptor blocker (prasugrel), more widespread use of direct oral anticoagulants, and a shorter duration of DAPT. In particular, the frequent use of a transfemoral approach could have affected the higher risk for bleeding events in patients with ACS. These limitations may significantly affect the external contemporary validity of the present study results. Fourth, information on the use of mechanical supports, which could contribute to major bleeding events after PCI, was not available in this study. Finally, the balance between ischemic and bleeding risk in Japanese patients may be different to that for patients outside of Japan. Furthermore, glycoprotein IIb/IIIa antagonist treatment is not available in Japan.
Conclusions
Bleeding risk after PCI was dependent on both ACS presentation and HBR with a significant effect of ACS within, but not beyond, 30 days. The 30-day rate of major bleeding was very high in patients with ACS regardless of HBR. Long-term ischemic risk after PCI was largely dependent on HBR.
Acknowledgment
The authors thank the clinical research coordinators of the Research Institute for Production Development.
Sources of Funding
This study was supported by an educational grant from the Research Institute for Production Development (Kyoto, Japan).
Disclosures
M.N. reports honoraria from Abbott Vascular, Amgen, Boehringer-Ingelheim, Boston Scientific, Daiichi-Sankyo, Medtronic, Sanofi, Takeda, and Terumo. T.M. reports honoraria from Bayer and Kowa, and has acted as an expert witness for Boston Scientific and Sanofi. N.E. reports honoraria from Abbott Vascular, Bayer, Boston Scientific, Daiichi-Sankyo, Edwards Scientific, Medtronic, Pfizer, and Terumo. Y.F. reports honoraria from Bayer, Kowa, and Sanofi. Y.N. reports research grants from Abbott Vascular and Boston Scientific, and honoraria from Abbott Vascular, Bayer, and Boston Scientific. T.K. reports honoraria from Abbott Vascular, Astellas, AstraZeneca, Bayer, Boston Scientific, Kowa, and Sanofi. T.K. is also a member of
Circulation Journal’s Editorial Team. The remaining authors have nothing to disclose.
IRB Information
The research protocols of the CREDO-Kyoto Cohort-3 were approved by the Institutional Review Board of Kyoto University (E2400) and by the local ethics committees in all participating medical centers.
Data Availability
The deidentified participant data will not be shared.
Supplementary Files
Please find supplementary file(s);
http://dx.doi.org/10.1253/circj.CJ-21-0016
References
- 1.
Yamaji K, Natsuaki M, Morimoto T, Ono K, Furukawa Y, Nakagawa Y, et al. Long-term outcomes after coronary stent implantation in patients presenting with versus without acute myocardial infarction (an observation from Coronary Revascularization Demonstrating Outcome Study-Kyoto Registry Cohort-2). Am J Cardiol 2015; 116: 15–23.
- 2.
Valgimigli M, Bueno H, Byrne RA, Collet JP, Costa F, Jeppsson A, et al. 2017 ESC focused update on dual antiplatelet therapy in coronary artery disease developed in collaboration with EACTS: The task force for dual antiplatelet therapy in coronary artery disease of the European Society of Cardiology (ESC) and of the European Association for Cardio-Thoracic Surgery (EACTS). Eur Heart J 2018; 39: 213–260.
- 3.
Nakamura M, Kimura K, Kimura T, Ishihara M, Otsuka F, Kozuma K, et al. JCS 2020 guideline focused update on antithrombotic therapy in patients with coronary artery disease. Circ J 2020; 84: 831–865.
- 4.
Valgimigli M, Gagnor A, Calabro P, Frigoli E, Leonardi S, Zaro T, et al. Radial versus femoral access in patients with acute coronary syndromes undergoing invasive management: A randomised multicentre trial. Lancet 2015; 385: 2465–2476.
- 5.
Urban P, Mehran R, Colleran R, Angiolillo DJ, Byrne RA, Capodanno D, et al. Defining high bleeding risk in patients undergoing percutaneous coronary intervention. Circulation 2019; 140: 240–261.
- 6.
Valgimigli M, Sabate M, Kaiser C, Brugaletta S, de la Torre Hernandez JM, Galatius S, et al. Effects of cobalt-chromium everolimus eluting stents or bare metal stent on fatal and non-fatal cardiovascular events: Patient level meta-analysis. BMJ 2014; 349: g6427.
- 7.
Natsuaki M, Morimoto T, Shiomi H, Ehara N, Taniguchi R, Tamura T, et al. Application of the modified high bleeding risk criteria for Japanese patients in an all-comers registry of percutaneous coronary intervention: From the CREDO-Kyoto Registry Cohort-3. Circ J, doi:10.1253/circj.CJ-20-0836.
- 8.
Braunwald E. Unstable angina: A classification. Circulation 1989; 80: 410–414.
- 9.
Mehran R, Rao SV, Bhatt DL, Gibson CM, Caixeta A, Eikelboom J, et al. Standardized bleeding definitions for cardiovascular clinical trials: A consensus report from the Bleeding Academic Research Consortium. Circulation 2011; 123: 2736–2747.
- 10.
Cutlip DE, Windecker S, Mehran R, Boam A, Cohen DJ, van Es GA, et al. Clinical end points in coronary stent trials: A case for standardized definitions. Circulation 2007; 115: 2344–2351.
- 11.
Kimura T, Morimoto T, Furukawa Y, Nakagawa Y, Kadota K, Iwabuchi M, et al. Long-term safety and efficacy of sirolimus-eluting stents versus bare-metal stents in real world clinical practice in Japan. Cardiovasc Interv Ther 2011; 26: 234–245.
- 12.
Serruys PW, Unger F, Sousa JE, Jatene A, Bonnier HJ, Schonberger JP, et al. Comparison of coronary-artery bypass surgery and stenting for the treatment of multivessel disease. N Engl J Med 2001; 344: 1117–1124.
- 13.
Fath-Ordoubadi F, Spaepen E, El-Omar M, Fraser DG, Khan MA, Neyses L, et al. Outcomes in patients with acute and stable coronary syndromes; insights from the prospective NOBORI-2 study. PLoS One 2014; 9: e88577.
- 14.
Montalescot G, Wiviott SD, Braunwald E, Murphy SA, Gibson CM, McCabe CH, et al. Prasugrel compared with clopidogrel in patients undergoing percutaneous coronary intervention for ST-elevation myocardial infarction (TRITON-TIMI 38): Double-blind, randomised controlled trial. Lancet 2009; 373: 723–731.
- 15.
Wallentin L, Becker RC, Budaj A, Cannon CP, Emanuelsson H, Held C, et al. Ticagrelor versus clopidogrel in patients with acute coronary syndromes. N Engl J Med 2009; 361: 1045–1057.
- 16.
Verheugt FW, Steinhubl SR, Hamon M, Darius H, Steg PG, Valgimigli M, et al. Incidence, prognostic impact, and influence of antithrombotic therapy on access and nonaccess site bleeding in percutaneous coronary intervention. JACC Cardiovasc Interv 2011; 4: 191–197.
- 17.
Kogame N, Guimaraes PO, Modolo R, De Martino F, Tinoco J, Ribeiro EE, et al. Aspirin-free prasugrel monotherapy following coronary artery stenting in patients with stable cad: The ASET pilot study. JACC Cardiovasc Interv 2020; 13: 2251–2262.
- 18.
Natsuaki M, Morimoto T, Shiomi H, Yamaji K, Watanabe H, Shizuta S, et al. Application of the academic research consortium high bleeding risk criteria in an all-comers registry of percutaneous coronary intervention. Circ Cardiovasc Interv 2019; 12: e008307.
- 19.
Natsuaki M, Morimoto T, Yamaji K, Watanabe H, Yoshikawa Y, Shiomi H, et al. Prediction of thrombotic and bleeding events after percutaneous coronary intervention: CREDO-Kyoto thrombotic and bleeding risk scores. J Am Heart Assoc 2018; 7: e008708.
- 20.
Bonaca MP, Bhatt DL, Cohen M, Steg PG, Storey RF, Jensen EC, et al. Long-term use of ticagrelor in patients with prior myocardial infarction. N Engl J Med 2015; 372: 1791–1800.
- 21.
Eikelboom JW, Connolly SJ, Bosch J, Dagenais GR, Hart RG, Shestakovska O, et al. Rivaroxaban with or without aspirin in stable cardiovascular disease. N Engl J Med 2017; 377: 1319–1330.
- 22.
Mauri L, Kereiakes DJ, Yeh RW, Driscoll-Shempp P, Cutlip DE, Steg PG, et al. Twelve or 30 months of dual antiplatelet therapy after drug-eluting stents. N Engl J Med 2014; 371: 2155–2166.
- 23.
Watanabe H, Domei T, Morimoto T, Natsuaki M, Shiomi H, Toyota T, et al. Very short dual antiplatelet therapy after drug-eluting stent implantation in patients with high bleeding risk: Insight from the STOPDAPT-2 trial. Circulation 2019; 140: 1957–1959.
- 24.
Vranckx P, Valgimigli M, Juni P, Hamm C, Steg PG, Heg D, et al. Ticagrelor plus aspirin for 1 month, followed by ticagrelor monotherapy for 23 months vs aspirin plus clopidogrel or ticagrelor for 12 months, followed by aspirin monotherapy for 12 months after implantation of a drug-eluting stent: A multicentre, open-label, randomised superiority trial. Lancet 2018; 392: 940–949.
- 25.
Mehran R, Baber U, Sharma SK, Cohen DJ, Angiolillo DJ, Briguori C, et al. Ticagrelor with or without aspirin in high-risk patients after PCI. N Engl J Med 2019; 381: 2032–2042.
- 26.
Kim BK, Hong SJ, Cho YH, Yun KH, Kim YH, Suh Y, et al. Effect of ticagrelor monotherapy vs ticagrelor with aspirin on major bleeding and cardiovascular events in patients with acute coronary syndrome: The TICO randomized clinical trial. JAMA 2020; 323: 2407–2416.