Abstract
Background:
Because the early diagnosis of subclinical cardiac sarcoidosis (CS) remains difficult, we developed a deep learning algorithm to distinguish CS patients from healthy subjects using echocardiographic movies.
Methods and Results:
Among the patients who underwent echocardiography from January 2015 to December 2019, we chose 151 echocardiographic movies from 50 CS patients and 151 from 149 healthy subjects. We trained two 3D convolutional neural networks (3D-CNN) to identify CS patients using a dataset of 212 echocardiographic movies with and without a transfer learning method (Pretrained algorithm and Non-pretrained algorithm). On an independent set of 41 echocardiographic movies, the area under the receiver-operating characteristic curve (AUC) of the Pretrained algorithm was greater than that of Non-pretrained algorithm (0.842, 95% confidence interval (CI): 0.722–0.962 vs. 0.724, 95% CI: 0.566–0.882, P=0.253). The AUC from the interpretation of the same set of 41 echocardiographic movies by 5 cardiologists was not significantly different from that of the Pretrained algorithm (0.855, 95% CI: 0.735–0.975 vs. 0.842, 95% CI: 0.722–0.962, P=0.885). A sensitivity map demonstrated that the Pretrained algorithm focused on the area of the mitral valve.
Conclusions:
A 3D-CNN with a transfer learning method may be a promising tool for detecting CS using an echocardiographic movie.
Cardiac sarcoidosis (CS) is a determinant factor for the prognosis of the patients with sarcoidosis. Approximately 85% of deaths in patients with sarcoidosis were associated with CS,1
and 30–65% of them are reported to be sudden deaths.2
Immunosuppressive therapy, such as corticosteroids, is a first-line treatment for CS. An observational study in Finland reported that immunosuppressive therapy in patients with CS resulted in a 5-year survival rate of 90% and a 10-year survival rate of 83%.3
The occurrence of heart failure and cardiac dysfunction before the initiation of immunosuppressive therapy is known to have a deleterious effect on the prognosis.3
suggesting that early diagnosis and treatment of CS are essential.
Editorial p ????
However, the early diagnosis of subclinical CS remains difficult. Although it is recommended to make a clinical diagnosis of CS using multiple modalities, such as medical history, blood test, ECG, echocardiography, positron emission tomography (PET), and magnetic resonance imaging (MRI),4,5
the diagnostic accuracy of screening tests for CS is low. For example, the thinning of the basal septum on echocardiography is specific to CS; however, the sensitivity is reported to be 12.6% for the diagnosis of CS.6
An autopsy study of patients with sarcoidosis revealed that subclinical CS is observed in approximately 20% of Caucasians and African Americans, and approximately 70–80% of Japanese.6
In addition, asymptomatic CS cases can occur, even in the general population. There is a report7
of a woman with asymptomatic CS whose left ventricular (LV) dysfunction was detected by echocardiography during a medical checkup. After being misdiagnosed as dilated cardiomyopathy at that time, it took more than 4 years to reach a definitive diagnosis of CS. Therefore, improvement in screening methods for subclinical or asymptomatic CS is urgent.
Machine learning is an algorithmic data analysis method in which a computer learns features contained in the data. Recently, deep learning, a machine learning method, has achieved state-of-the-art performance in several medical fields;8–12
deep learning algorithms have been developed for use on echocardiographic images to predict the presence of hypertrophic cardiomyopathy, cardiac amyloidosis, and pulmonary artery hypertension with high accuracy,9
and to automatically calculate the LV ejection fraction (LVEF) from echocardiographic movies.10
In addition, transfer learning, a method in which an algorithm is pretrained on a large dataset, modified to an algorithm suitable for a current task, and trained on a small amount of data,11
is often applied in the medical field when available data are limited.12
This method is used to overcome the overfitting that occurs when training an algorithm with a small amount of data.
We resolved to develop a deep learning algorithm that can diagnose CS with a high accuracy using echocardiographic movies, but the following 2 issues needed to be overcome to achieve this goal: (1) developing a deep learning algorithm to distinguish abnormal cardiac findings in CS from normal cardiac findings, and (2) developing a deep learning algorithm to differentially diagnose CS and other heart diseases. In this study, we used echocardiographic movies to develop a deep learning algorithm with transfer learning that could distinguish abnormal cardiac findings in CS from normal cardiac findings. Furthermore, we validated the diagnostic accuracy of the algorithm by comparing it with cardiologists’ interpretations.
Methods
Study Sample
Patients aged ≥18 years who underwent echocardiography at The University of Tokyo Hospital from January 2015 to December 2019 were included in the study. For the CS group, we selected 50 patients with a diagnosis of CS based on “JCS 2016 guideline on diagnosis and treatment of cardiac sarcoidosis”.5
Echocardiographic movies in the apical 4-chamber view of the patients without a pacemaker, implantable cardioverter defibrillator, or ventricular assist device (151 movies) were obtained. For the Control group, we randomly selected 149 healthy subjects with normal echocardiographic findings and without CS, whose age, sex, and ultrasound machines or vendors used for the examination were matched with those in the CS group as closely as possible. Normal echocardiographic findings were defined as: sinus rhythm at the time of examination, interventricular septal thickness <10 mm, LV posterior wall thickness <10 mm, LV end-diastolic diameter <55 mm, LV end-systolic diameter less than 42 mm, LVEF >60%, left atrial diameter <40 mm, no or trivial valvular disease, estimated right ventricular systolic pressure <35 mmHg, and a wall motion score of 1.0. As many echocardiographic movies in the apical 4-chamber view of the Control group as those of the CS group were also collected. Finally, 302 movies from 50 CS patients and 149 healthy subjects were randomly divided into a training dataset (212 movies from 138 participants: 70.2%), a validation dataset (49 movies from 31 participants: 16.2%), and a test dataset (41 movies from 30 participants: 13.6%). Multiple movies from a single participant were included in the same dataset (Figure 1). The study was conducted in accordance with the revised Declaration of Helsinki and approved by the Institutional Review Board of the University of Tokyo (reference no. 2650).

Echocardiography was performed by skilled ultrasound sonographers or cardiologists (Vivid 7/Vivid E9/Vivid E95, GE Healthcare, Waukesha, Wisconsin, USA; iE33/EPIQ7, Philips, Amsterdam, The Netherlands; Xario/Artida/Aplio300/AplioXV, Toshiba, Tokyo, Japan; or Acuson SC2000, Siemens, Munich, Germany). Echocardiographic measurements were obtained at the time of image acquisition according to the American Society of Echocardiography recommendations,13
and the interpretation of each echocardiographic scan was performed by 1 or 2 experienced echocardiologists. The measurements were exported as a comma-separated value (.CSV) file. Echocardiographic movies in the apical 4-chamber view from both groups were imported in the Moving Picture Experts Group (MPEG) file format. All movies were cropped at different ratios in each ultrasound machine to remove text, the ECG monitoring, and other information outside of the scanning sector. The resulting square movies were 290×290, 340×340, 410×410, 450×450, 475×475, 500×500, or 570×570 pixels depending on the ultrasound machine, and were transformed into 112×112 pixels Audio Video Interleave (AVI) movies with down sampling.
Development of the Deep Learning Algorithm for Detecting CS
The deep learning algorithm was developed to detect the presence of CS from an echocardiographic movie using R2+1D architecture,10
which has a 3D-CNN architecture. The 3D convolutions of this architecture consisted of a 2D spatial convolution followed by a 1D temporal convolution.14
Using R2+1D architecture and semantic segmentation algorithm, Ouyang et al developed a deep learning algorithm called EchoNet-Dynamic that trains from 7,465 echocardiographic movies in the apical 4-chamber view and predicts the LVEF value.10
Their code and datasets are publicly available. Transfer learning was applied to overcome overfitting because the size of our dataset was very small.11
Firstly, we pretrained the R2+1D architecture using the publicly available EchoNet-Dynamic dataset, and then we replaced the final, fully connected layer that had a single output applied as a sigmoid nonlinearity to return the probability of CS. Finally, we retrained the pretrained R2+1D architecture on our training dataset. We called this the “Pretrained algorithm” (Figure 2A). To verify the usefulness of the transfer learning, we also developed an algorithm without pretraining; we trained the R2+1D architecture only with our training dataset and called it the “Non-pretrained algorithm” (Figure 2B).

During training, our training dataset was augmented with random rotation, horizontal flipping, inverting color, Gaussian blurring, upsampling, and downsampling. For algorithm input, 3 movie clips of 32 frames were generated from 1 echocardiographic movie. For predicting CS, our algorithms were trained to minimize the binary cross-entropy loss between the prediction and ground truth using Adam,15
which is an effective variant of the stochastic gradient descent optimization, with an initial learning rate of 0.00001 and batch size of 8 for 30 epochs. The learning rate was reduced by a factor of 2 if the loss on the validation dataset plateaued after 5 epochs. If the loss did not decrease for 10 consecutive epochs, model training was stopped even if 30 epochs had not been completed, and the model’s weights at the lowest loss value were saved.
The developed algorithms were applied to the test dataset to evaluate their diagnostic performance. However, because the input movie comprised 32 consecutive frames randomly cut from 1 movie, different inputs could be made to the algorithm for each evaluation. Therefore, the evaluation was performed 10 times, and the average value of each evaluation was used as the predicted value (i.e., the probability of the presence of CS calculated by the developed algorithms). Our algorithms were developed in Python using the PyTorch deep learning library and a Nvidia Tesla V-100 32 GB graphics processing unit.
Evaluation of the Developed Algorithm’s Performance
For the test dataset, we calculated the accuracy and sensitivity, specificity, positive predictive value (PPV), and negative predictive value (NPV) of the developed algorithms when the cutoff value was set to 0.5. The area under the receiver-operating curve (AUC) of the developed algorithms was also calculated. We compared the diagnostic performance of the Pretrained algorithm with that of the Non-pretrained algorithm to evaluate the usefulness of transfer learning.
Additionally, we compared the diagnostic performance of the Pretrained algorithm with that of 5 cardiologists interpreting the test dataset. All of the cardiologists were board-certified with more than 7 years of clinical experience. The movies of the test dataset were classified as CS (score 1) or normal (score 0). We calculated the accuracy and sensitivity, specificity, PPV, and NPV of each cardiologist. The AUCs of the cardiologists were also calculated using the average value of each predicted score.
Similarly, we calculated the diagnostic performance of the Pretrained algorithm, the Non-pretrained algorithm, and the cardiologist’s interpretations on 29 echocardiographic movies from 24 participants (7 movies from 2 CS patients and 22 movies from 22 healthy subjects) with preserved LV systolic function (defined as LVEF ≥50%) in the test dataset.
Furthermore, to visualize the areas of interest on which the algorithms focused, we used M3D-CAM, which is a library for generating attention maps with a CNN-based model for 2D and 3D data, as well as with classification and segmentation tasks.16
Statistical Analysis
Continuous variables are presented as mean and standard deviation, and were compared using the unpaired Student’s t-test or Mann-Whitney U test. Categorical variables are expressed as frequencies and percentages, and were compared using the Chi-squared test. The 95% confidence intervals (CIs) of the accuracy, sensitivity, specificity, PPV, and NPV were evaluated using boot-strapping (10,000 times resampling with replacement).17
The DeLong method was used to compare the AUCs of the developed algorithms with those of the cardiologists.18
Statistical analysis was performed using R version 4.0.2. (pROC-package authorized by Xavier Robin). Statistical significance was defined as P<0.05.
Results
Participants’ Characteristics and Development of the Algorithm
This study included 302 echocardiographic movies from 50 CS patients and 149 healthy subjects. The participants’ characteristics and conventional echocardiographic parameters are shown in
Table 1. The mean and standard deviation of the participants’ ages was 64.7±11.2. There were 70 movies from 21 males in the CS group, and 70 movies from 69 males in the Control group. In the CS group, a diagnosis of basal septum aneurysm was made in 33 (21.9%) echocardiographic movies (Table 1). In addition, 47 (31.1%) echocardiographic movies were considered to be subclinical CS, and a diagnosis of isolated CS was made in 53 echocardiographic movies (35.1%). The baseline demographic characteristics and conventional echocardiographic parameters in preserved LV systolic function and impaired LV systolic function subgroup of the CS patients are shown in
Supplementary Table 1. Among 302 echocardiographic movies collected from 199 participants, the training dataset, validation dataset, and test dataset included 212 movies from 138 participants (70.2%), 49 movies from 31 participants (16.2%), and 41 movies from 30 participants (13.6%), respectively (Figure 1).
Table 1.
Baseline Demographic Characteristics and Conventional Echocardiographic Parameters
| |
CS group
(151 movies from
50 patients) |
Control group
(151 movies from
149 subjects) |
P value |
| Age (years) |
64.7 (11.2) |
64.7 (11.2) |
1.000 |
| Male |
70 (46.4%) |
70 (46.4%) |
1.000 |
| Height (cm) |
160.3 (9.5) |
161.4 (9.8) |
0.312 |
| Body weight (kg) |
58.8 (14.0) |
58.8 (12.0) |
0.996 |
| IVS (mm) |
9.2 (2.5) |
8.3 (1.2) |
<0.001 |
| LVPWd (mm) |
9.0 (2.1) |
8.4 (1.16) |
0.004 |
| LVDd (mm) |
50.1 (8.5) |
42.8 (4.7) |
<0.001 |
| LVDs (mm) |
38.1 (11.3) |
26.5 (3.3) |
<0.001 |
| LVEF (%) |
49.6 (16.7) |
68.5 (5.5) |
<0.001 |
| LA (mm) |
36.9 (6.9) |
32.4 (4.3) |
<0.001 |
| RVSP (mmHg) |
25.1 (7.3) |
22.8 (5.8) |
0.008 |
| WMS |
1.5 (0.6) |
1.0 (0.0) |
<0.001 |
| MR |
|
|
<0.001 |
| No |
16 (10.6%) |
44 (29.1%) |
|
| Trivial |
77 (51.0%) |
104 (68.9%) |
|
| Mild |
47 (31.1%) |
0 (0.0%) |
|
| Mild-moderate |
6 (4.0%) |
0 (0.0%) |
|
| Moderate |
3 (2.0%) |
0 (0.0%) |
|
| Moderate-severe |
1 (0.7%) |
0 (0.0%) |
|
| Severe |
1 (0.7%) |
0 (0.0%) |
|
| LV aneurysm |
55 (36.4%) |
0 (0.0%) |
<0.001 |
| Basal septum aneurysm |
33 (21.9%) |
0 (0.0%) |
<0.001 |
Data are presented as n (%) or mean (standard deviation). P values are from the unpaired Student’s t-test or the Chi-squared test for differences in the distribution of values between the CS and Control groups. CS, cardiac sarcoidosis; IVS, interventricular septum; LA, left atrium; LV, left ventricular; LVDd, LV end-diastolic diameter; LVDs, LV end-systolic diameter; LVEF, LV ejection fraction; LVPWd, LV posterior wall thickness; MR, mitral regurgitation; RVSP, right ventricular systolic pressure; WMS, wall motion score.
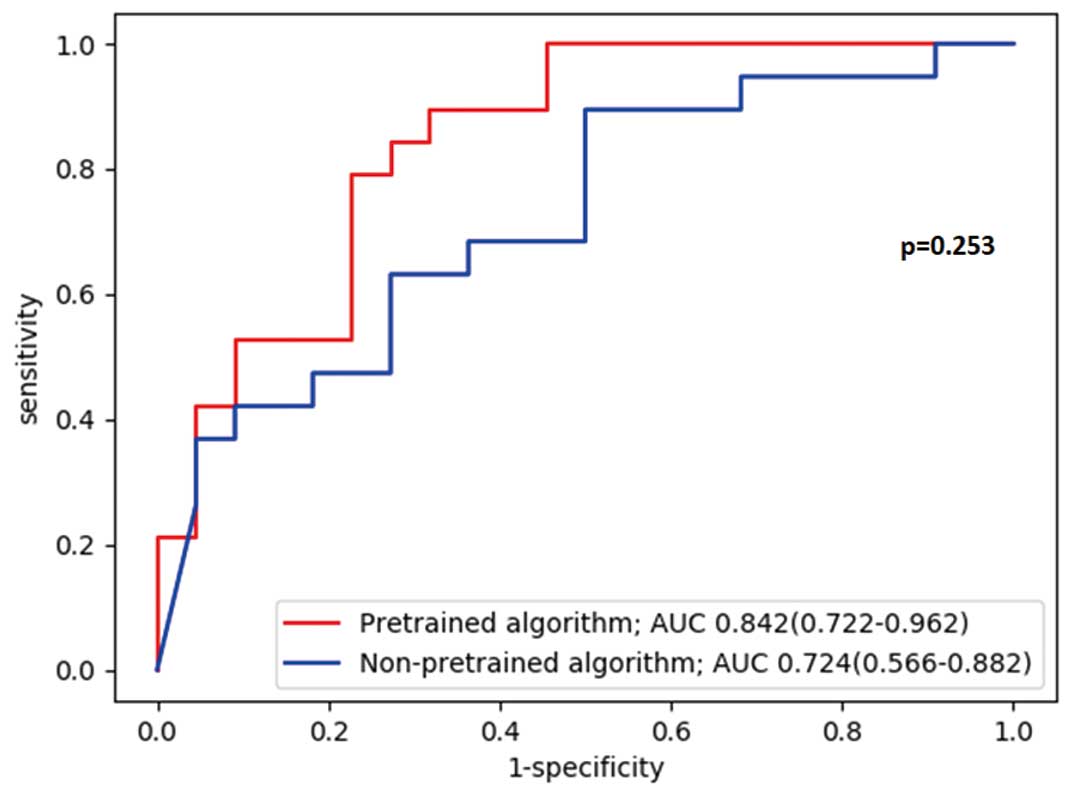
Diagnostic performance values of both the Pretrained and Non-pretrained algorithms on the test dataset when the cutoff value was set to 0.5 are shown in
Table 2. The accuracies of the Pretrained and Non-pretrained algorithms were 70.7% (95% CI: 54.5–83.9) and 65.9% (95% CI: 49.4–80.0), respectively, sensitivities were 89.5% (95% CI: 66.9–98.7) and 63.2% (95% CI: 38.4–83.7), respectively, and specificities were 54.6% (95% CI: 32.2–75.6) and 68.2% (95% CI: 45.1–86.1), respectively. The AUC of the Pretrained algorithm was greater than that of Non-pretrained algorithm (0.842, 95% CI: 0.722–0.962 vs. 0.724, 95% CI: 0.566–0.882: P=0.253), although the difference did not reach the statistical significance (Figure 3).
Table 2.
Algorithms’ Diagnostic Performance on the Test Dataset
| Algorithm name |
Accuracy |
Sensitivity |
Specificity |
PPV |
NPV |
| For all echocardiographic movies in the test dataset |
| Non-pretrained algorithm |
65.9% (49.4–80.0) |
63.2% (38.4–83.7) |
68.2% (45.1–86.1) |
63.2% (46.0–77.6) |
68.2% (52.7–80.5) |
| Pretrained algorithm |
70.7% (54.5–83.9) |
89.5% (66.9–98.7) |
54.6% (32.2–75.6) |
63.0% (51.2–73.4) |
85.7% (60.5–95.9) |
| For echocardiographic movies with preserved LV systolic function in the test dataset |
| Non-pretrained algorithm |
62.1% (42.3–79.3) |
42.9% (9.9–81.6) |
68.2% (45.1–86.1) |
30.0% (13.0–55.1) |
79.0% (65.0–88.3) |
| Pretrained algorithm |
62.1% (42.3–79.3) |
85.7% (42.1–99.6) |
54.6% (32.2–75.6) |
37.5% (25.7–51.0) |
92.3% (65.3–98.7) |
Data are presented as percentage (95% confidence interval). PPV, positive predictive value; NPV, negative predictive value.
Diagnostic performance values of the cardiologists’ interpretations of the test dataset are shown in
Table 3. The accuracy, sensitivity, and specificity of the cardiologists’ interpretations were (mean±SD) 75.1±8.6%, 72.6±7.0%, and 77.3±14.4%, respectively. The AUCs of the cardiologists’ interpretation are shown in
Figure 4. There was no significant difference between the AUCs of the cardiologists’ interpretation and that of Pretrained algorithm on the test dataset (0.855, 95% CI: 0.735–0.975 vs. 0.842, 95% CI: 0.722–0.962: P=0.885).
Table 3.
Cardiologists’ Diagnostic Performance on the Test Dataset
| Cardiologist |
Accuracy |
Sensitivity |
Specificity |
PPV |
NPV |
| 1 |
87.8% |
84.2% |
90.9% |
88.9% |
87.0% |
| 2 |
75.6% |
63.2% |
86.4% |
80.0% |
73.1% |
| 3 |
61.0% |
73.7% |
50.0% |
56.0% |
68.8% |
| 4 |
73.2% |
68.4% |
77.3% |
72.0% |
73.9% |
| 5 |
78.1% |
73.7% |
81.8% |
77.8% |
78.3% |
| Mean±SD |
75.1±8.6% |
72.6±7.0% |
77.3±14.4% |
75.0±10.9% |
76.2±6.2% |
Cardiologists’ diagnostic performances on the test dataset are shown as percentages. The mean value and standard deviation (SD) are also shown. NPV, negative predictive value; PPV, positive predictive value.

For the echocardiographic movies with preserved LV systolic function in the test dataset, diagnostic performance values of both the Pretrained and Non-pretrained algorithms when the cutoff value was set to 0.5 are shown in
Table 2. The accuracies of the Pretrained and Non-pretrained algorithms were 62.1% (95% CI: 42.3–79.3) and 62.1% (95% CI: 42.3–79.3), respectively, sensitivities were 85.7% (95% CI: 42.1–99.6) and 42.9% (95% CI: 9.9–81.6), respectively, and specificities were 54.6% (95% CI: 32.2–75.6) and 68.2% (95% CI: 45.1–86.1), respectively. The AUCs of the Pretrained and Non-pretrained algorithms are shown in
Supplementary Figure 1. The AUC of the Pretrained algorithm was greater than that of the Non-pretrained algorithm (0.825, 95% CI: 0.661–0.989 vs. 0.685, 95% CI: 0.474–0.896: P=0.359), although the difference did not reach statistical significance. The diagnostic performance values of the cardiologists’ interpretations are shown in
Supplementary Table 2. The accuracy, sensitivity, and specificity of the cardiologists’ interpretations were (mean±SD) 69.0±9.0%, 42.9±20.2%, and 77.3±14.4%, respectively. The AUCs of the cardiologists’ interpretations are shown in
Supplementary Figure 2. The AUC of the cardiologists’ interpretation was less than that of Pretrained algorithm (0.701, 95% CI: 0.479–0.924 vs. 0.825, 95% CI: 0.661–0.989: P=0.455), although the difference did not reach statistical significance.
Visualizing the Algorithm’s Decision
The M3D-CAM method depicted the focus of the Pretrained algorithm when interpreting an echocardiographic movie. For the Control group, the Pretrained algorithm focused on the interventricular septum and basal lateral wall, whereas for the CS group, the algorithm focused on the mitral valve (Figure 5, Supplementary Movie).
Discussion
The algorithm we developed using transfer learning showed a diagnostic performance comparable to that of cardiologists in distinguishing CS patients from healthy subjects using echocardiographic movies. In addition, our study demonstrated that the developed algorithm focused on the area of the mitral valve in the CS movies.
This is the first report of an algorithm that can successfully detect heart disease by analyzing echocardiographic movies. When applying deep learning to echocardiography, whether the input data is an echocardiographic still image or an echocardiographic movie is thought to be essential. A previous study showed that a deep learning algorithm can predict heart disease, such as hypertrophic cardiomyopathy, cardiac amyloidosis, and pulmonary hypertension, using echocardiographic images with high accuracy.9
However, whereas a movie is time-series data of the image, the echocardiographic still images lack the temporal information in the echocardiographic movies, such as myocardial motion, heart rate, and heart rhythm. For action recognition tasks, it is more appropriate to analyze with temporal information.19
Therefore, if the features can be appropriately extracted from both the temporal and spatial information in the echocardiographic movies, the accuracy of the heart disease prediction should be improved by analyzing echocardiographic movies rather than analyzing echocardiographic still images.
In addition, an algorithm that can make a diagnosis of CS using echocardiographic data has not been developed, likely because a large amount of data on CS have not been collected due to the rarity of the disease. We were only able to collect 151 echocardiographic movies from 50 CS cases. When training complex algorithms with small amounts of data, overfitting often reduces the accuracy. To overcome this, transfer learning was adopted in this study (Pretrained algorithm). In particular, transfer learning is often applied in the medical field, where available data are limited.12
For example, CheXNeXt, a CNN that detects the presence of 14 different pathologies from a chest X-ray, uses transfer learning of a 2D CNN.20
In addition, AppendiXNet,21
a 3D-CNN to detect appendicitis from computed tomography (CT), was developed using a small training dataset of less than 500 training CT exams after pretraining on a large collection of YouTube videos called Kinetics that consist of approximately 500,000 video clips annotated for 1 of 600 human action classes. We used transfer learning of the spatiotemporal CNN of EchoNet-Dynamic, which was trained from 7,465 echocardiographic movies annotated for the LVEF value.10
The resulting algorithm was developed even with a small dataset of echocardiographic movies of CS, and could provide a powerful diagnostic performance comparable to cardiologists’. To our best knowledge, there has not been any study of transfer learning using the EchoNet-Dynamic dataset,10
but there is potential to develop algorithms for predicting the presence of various heart diseases.
Furthermore, by using the M3D-CAM method, we found that the Pretrained algorithm likely focused on the area of the mitral valve for the CS movies to distinguish CS patients from healthy subjects. In a CS patient, 3 factors can change the movement of the mitral valve. First, chronic inflammation in the myocardium increases myocardial stiffness, resulting in LV diastolic dysfunction.22
A previous study demonstrated that LV diastolic dysfunction causes changes in the mitral inflow pattern, resulting in changes in the mitral valve’s movement.23
Second, mitral valve regurgitation or prolapse can occur because of papillary muscle dysfunction from sarcoid infiltration of the papillary muscles.22,24
Finally, functional mitral valve regurgitation because of LV dilatation can restrict diastolic opening of the mitral leaflets.25
These changes hay have been detected by the Pretrained algorithm as changes in the mitral valve on the echocardiographic movies of CS patients.
Moreover, we found that our algorithm could distinguish CS patients from healthy subjects with high sensitivity, even in participants with normal cardiac function. Previous studies showed that echocardiography has a low sensitivity and NPV to diagnose early or localized mild CS.26,27
On echocardiographic movies from participants with preserved LV systolic function in the test dataset, the Pretrained algorithm had a sensitivity of 85.7% (95% CI: 42.1–99.6) and NPV of 92.3% (95% CI: 65.3–98.7), whereas the sensitivity and NPV of the cardiologists (mean±SD) were 42.9±20.2% and 81.3±4.2%, respectively. These findings suggested that our algorithm might detect subtle abnormal findings appearing in early-stage CS, which could not be detected as conventional echocardiographic parameters.
In the near future, we will develop a deep learning algorithm that can be used as a clinical screening tool to detect cases of previously underestimated CS, such as asymptomatic CS or early-stage CS with preserved cardiac function. In health check-ups or primary care without cardiologists, the developed algorithm using echocardiographic movies will enable us to detect asymptomatic or subclinical CS patients in the general population, who should then undergo PET or MRI. Furthermore, in the general hospital, this developed algorithm will aid in the early diagnosis of CS, which will lead to improvement in prognosis. At present, our developed algorithm can distinguish abnormal cardiac findings in CS from normal cardiac findings, which has cleared an important first step in the process of developing an algorithm that can diagnose CS using echocardiographic movies in the clinical setting.
Study Limitations
Firstly, although the M3D-CAM method clearly depicted the focus of the developed algorithm in interpreting cardiac findings in echocardiographic movies, it is unknown whether the features extracted from the echocardiographic movies by the algorithm were specific to CS or universal across the cardiac diseases. Because the aim of this study was to distinguish CS patients from healthy subjects, we included healthy subjects in the Control group. Because our algorithm cannot train data for other heart diseases, it is not possible to distinguish CS from other heart diseases. In order to achieve our ultimate goal of developing a deep learning algorithm that can diagnose CS with high accuracy using echocardiographic movies, as the next step we have to develop a deep learning algorithm to differentially diagnose CS and other heart diseases. In the future, it will be necessary to create a dataset that includes a large number of cardiomyopathy cases and develop an algorithm that classifies CS from among them. Secondly, the available data were limited. We had 151 echocardiographic movies from CS patients. It is necessary to have and learn more data to develop a better algorithm because 3D-CNN has a large number of parameters that need to be optimized. If more data can be collected, it may be possible to develop an algorithm that exceeds the diagnostic performance of cardiologists. However, because available data at a single facility are limited, it is necessary to collect CS cases from multiple institutions to increase the data and develop a more accurate algorithm. Moreover, the EchoNet-Dynamic dataset for pretraining contained only echocardiographic movies in the apical 4-chamber view. If echocardiographic movies in other views, such as the apical 2-chamber view or long-axis view, can be used, the diagnostic performance can be improved even more. However, in order to analyze the echocardiographic movies in various views, it is necessary to classify them, and extract the features of CS in each view. Probably, our limited data were insufficient to analyze the echocardiographic movies in various views. In addition, because the available echocardiographic movie dataset did not include echocardiographic movies in multiple views, it was also not possible to apply transfer learning to analyzing the echocardiographic movies in various views. Therefore, it is necessary to collect more CS cases or obtain a public dataset of echocardiographic movies consisting of various views. Finally, this study was a single-center retrospective study, limiting generalizability. Further study using external data is needed.
Conclusions
The 3D-CNN Pretrained algorithm using EchoNet-Dynamic dataset could detect CS with high accuracy using a small number of echocardiographic movies. Deep learning is expected to be a promising tool for diagnosing CS using echocardiographic movies.
Acknowledgments
This work was supported by scholarship donation number 197100000928. We thank Nisei Kimura and Gyo Uchida for supporting deep learning model development. We thank Ashleigh Cooper, PhD, from Edanz Group (https://en-author-services.edanz.com/ac) for editing a draft of this manuscript.
Disclosures
The authors have no financial relationships relevant to this article to disclose. H.A., H.M., and I.K. are members of
Circulation Journal’s Editorial Team.
IRB Information
This study was approved by the Institutional Review Board of the University of Tokyo (reference no. 2650).
Data Availability
The deidentified participant data will not be shared.
Supplementary Files
Supplementary Movie.
Representative movies of M3D-CAM for the Pretrained algorithm on the test dataset.
A
is the echocardiographic movie of two cases of the Control group.
B
is the echocardiographic movie of two cases of the CS group. In each set, the left side movie is the original echocardiographic movie and the right side movie is the echocardiographic movie with M3D-CAM for the Pretrained algorithm. The red and yellow areas represented by M3D-CAM indicate the areas upon which the algorithm focused.
Please find supplementary file(s);
http://dx.doi.org/10.1253/circj.CJ-21-0265
References
- 1.
Sekiguchi M, Hiroe M, Take M, Hirosawa K. Clinical and histopathological profile of sarcoidosis of the heart and acute idiopathic myocarditis. Concepts through a study employing endomyocardial biopsy. II: Myocarditis. Jpn Circ J 1980; 44: 264–273.
- 2.
Roberts WC, McAllister HA Jr, Ferrans VJ. Sarcoidosis of the heart: A clinicopathologic study of 35 necropsy patients (Group I) and review of 78 previously described necropsy patients (Group II). Am J Med 1977; 63: 86–108.
- 3.
Kandolin R, Lehtonen J, Airaksinen J, Vihinen T, Miettinen H, Ylitalo K, et al. Cardiac sarcoidosis: Epidemiology, characteristics, and outcome over 25 years in a nationwide study. Circulation 2015; 131: 624–632.
- 4.
Birnie DH, Sauer WH, Bogun F, Cooper JM, Culver DA, Duvernoy CS, et al. HRS expert consensus statement on the diagnosis and management of arrhythmias associated with cardiac sarcoidosis. Heart Rhythm 2014; 11: 1304–1323.
- 5.
Terasaki F, Azuma A, Anzai T, Ishizaka N, Ishida Y, Isobe M, et al; on behalf of the Japanese Circulation Society Joint Working Group. JCS 2016 guideline on diagnosis and treatment of cardiac sarcoidosis: Digest version. Circ J 2019; 83: 2329–2388.
- 6.
Kusano KF, Satomi K. Diagnosis and treatment of cardiac sarcoidosis. Heart 2016; 102: 184–190.
- 7.
Satou M, Shishido H, Satou S, Iwata Y, Ooki K, Kondou E, et al. A hard case to diagnose: Cardiac sarcoidosis. Med J Asahikawa RCH 2014; 28: 25–30.
- 8.
Lecun Y, Bengio Y, Hinton G. Deep learning. Nature 2015; 521: 436–444.
- 9.
Zhang J, Gajjala S, Agrawal P, Tison GH, Hallock LA, Beussink-Nelson L, et al. Fully automated echocardiogram interpretation in clinical practice: Feasibility and diagnostic accuracy. Circulation 2018; 138: 1623–1635.
- 10.
Ouyang D, He B, Ghorbani A, Yuan N, Ebinger J, Langlotz CP, et al. Video-based AI for beat-to-beat assessment of cardiac function. Nature 2020; 580: 252–256.
- 11.
Shin HC, Roth HR, Gao M, Lu L, Xu Z, Nogues I, et al. Deep convolutional neural networks for computer-aided detection: CNN architectures, dataset characteristics and transfer learning. IEEE Trans Med Imaging 2016; 35: 1285–1298.
- 12.
Chan HP, Samala RK, Hadjiiski LM, Zhou C. Deep learning in medical image analysis. Adv Exp Med Biol 2020; 1213: 3–21.
- 13.
Lang RM, Badano LP, Victor MA, Afilalo J, Armstrong A, Ernande L, et al. Recommendations for cardiac chamber quantification by echocardiography in adults: An update from the American Society of Echocardiography and the European Association of Cardiovascular Imaging. J Am Soc Echocardiogr 2015; 28: 1–39.e14.
- 14.
Tran D, Wang H, Torresani L, Ray J, Lecun Y, Paluri M. A closer look at spatiotemporal convolutions for action recognition. arXiv:1711.11248v3 [cs.CV], 2018. https://arxiv.org/abs/1711.11248v3.
- 15.
Kingma DP, Ba JL. Adam: A method for stochastic optimization. In: Bengio Y, LeCun Y, editors. ICLR 2015 Conference Track Proceedings [Proceedings of the 3rd International Conference on Learning Representations], 7–9 May 2015, San Diego, CA, USA.
- 16.
Gotkowski K, Gonzalez C, Bucher A, Mukhopadhyay A. M3d-CAM: A PyTorch library to generate 3D data attention maps for medical deep learning. arXiv:2007.00453 [cs.CV], 2020. https://arxiv.org/abs/2007.00453 (accessed June 2021).
- 17.
Carpenter J, Bithell J. Bootstrap confidence intervals: When, which, what?: A practical guide for medical statisticians. Stat Med 2000; 19: 1141–1164.
- 18.
Delong ER, DeLong DM, Clarke-Pearson DL. Comparing the areas under two or more correlated receiver operating characteristic curves: A nonparametric approach. Biometrics 2016; 44: 837–845.
- 19.
Lemley J, Bazrafkan S, Corcoran P. Transfer learning of temporal information for driver action classification. In: Proceedings of 28th Modern Artificial Intelligence and Cognitive Science Conference, Fort Wayne, IN, April 2017; 123–128.
- 20.
Rajpurkar P, Irvin J, Ball RL, Zhu K, Yang B, Mehta H, et al. Deep learning for chest radiograph diagnosis: A retrospective comparison of the CheXNeXt algorithm to practicing radiologists. PLoS Med 2018; 15: 1–17.
- 21.
Rajpurkar P, Park A, Irvin J, Chute C, Bereket M, Mastrodicasa D, et al. AppendiXNet: Deep learning for diagnosis of appendicitis from a small dataset of CT exams using video pretraining. Sci Rep 2020; 10: 1–7.
- 22.
Kurmann R, Mankad SV, Mankad R. Echocardiography in sarcoidosis. Curr Cardiol Rep 2018; 20: 118.
- 23.
Kheradvar A, Gharib M. On mitral valve dynamics and its connection to early diastolic flow. Ann Biomed Eng 2009; 37: 1–13.
- 24.
Sayah DM, Bradfield JS, Moriarty JM, Belperio JA, Lynch JP. Cardiac involvement in sarcoidosis: Evolving concepts in diagnosis and treatment. Semin Respir Crit Care Med 2017; 38: 477–498.
- 25.
Otsuji Y, Gilon D, Jiang L, He S, Leavitt M, Roy MJ, et al. Restricted diastolic opening of the mitral leaflets in patients with left ventricular dysfunction: Evidence for increased valve tethering. J Am Coll Cardiol 1998; 32: 398–404.
- 26.
Burstow DJ, Tajik AJ, Bailey KR, DeRemee RA, Taliercio CP. Two-dimensional echocardiographic findings in systemic sarcoidosis. Am J Cardiol 1989; 63: 478–482.
- 27.
Freeman AM, Curran-Everett D, Weinberger HD, Fenster BE, Buckner JK, Gottschall EB, et al. Predictors of cardiac sarcoidosis using commonly available cardiac studies. Am J Cardiol 2013; 112: 280–285.

