Abstract
Background:
Premature atrial contractions (PACs) are predictors of atrial fibrillation, stroke, and cardiovascular mortality. The present study aimed to assess relevant factors for PACs among a general population of Japanese men.
Methods and Results:
This study conducted a population-based, cross-sectional study among 517 men, aged 40–79 years, with neither apparent myocardial infarction nor atrial fibrillation. 24-h Holter electrocardiography to assess PAC frequency was used. Age, body mass index, height, low-density lipoprotein cholesterol, triglycerides, high-density lipoprotein cholesterol, mean heart rate, diabetes mellitus, hypertension, physical activity, smoking, alcohol consumption, and lipid-lowering therapy were included in multivariable negative binomial regression analyses to assess correlation for the number of PACs per hour. Almost all participants (99%) had at least 1 PAC in 1 h (median number 2.84 PACs per h). In multivariable negative binomial regression after adjusting for all covariates simultaneously, age (relative risk [95% confidence interval], 1.30 [1.08–1.57] per 1-standard deviation [SD] increment), height (1.19 [1.02–1.39] per 1-SD increment), triglycerides (0.79 [0.65–0.97] per 1-SD increment), mean heart rate (0.69 [0.59–0.80] per 1-SD increment), physical activity (0.63 [0.43–0.93]), current smoking (1.69 [1.06–2.69]), current moderate (1.97 [1.23–3.16]) and heavy (1.84 [1.12–3.01]) alcohol consumption were independently associated with PAC frequency.
Conclusions:
PAC frequency was independently associated with age, height, smoking, alcohol consumption, heart rate, physical activity, and triglycerides.
Atrial fibrillation (AF), the most common type of cardiac arrhythmia, can cause substantial mortality, stroke, and heart failure, and is responsible for reduced quality of life.1,2
Some cardiovascular risk factors, including elevated blood pressure, obesity, diabetes, and smoking, have been demonstrated as important determinants of AF.3,4
Although guideline-adherent antithrombotic treatment is important,5
there is also increasing interest in premature atrial contraction (PACs) as a crucial subclinical arrhythmia related to AF, stroke, and mortality.6–8
However, studies that have assessed the prevalence of PACs and the association between PACs and cardiovascular risk factors in a general population are scarce.9
Furthermore, the epidemiology of PACs and their determinants may be more important in East Asia, where the stroke is dominant among cardiovascular diseases.10
Therefore, the present study aimed to assess the prevalence and relevant factors for PACs among a general population of Japanese men aged between 40 and 79 years.
Methods
Study Participants and Setting
The Shiga Epidemiological Study of Subclinical Atherosclerosis (SESSA) is a population-based observational study examining determinants of subclinical atherosclerosis. The design of this study and the information regarding baseline characteristics have been described previously.11
In brief, from 2006 to 2008, the investigators from SESSA randomly selected and invited 2,379 Japanese men aged between 40 and 79 years from Kusatsu City in Shiga prefecture, based on the Basic Residents’ Register of the city. Among them, 1,094 men participated in the baseline assessment. During the follow-up examination from October 2010 to August 2014, 853 of the original participants were reassessed. For the current research, they were invited to join the SESSA Holter Study from October 2014 through September 2015, and a total of 542 agreed to participate (Figure 1). We excluded 10 with known myocardial infarction and 15 diagnosed with persistent or paroxysmal AF. The remaining 517 men were analyzed for the present study. Written informed consent was obtained from all participants prior to the study. The study followed the code of ethics of the World Medical Association (1975 Declaration of Helsinki). The study obtained approval from the Institutional Review Board of Shiga University of Medical Science (G2008-61).

Details of Holter electrocardiography have been described previously.12
We used a 2-channel digital device (FM 800; Fukuda Denshi, Tokyo, Japan) with a frequency response of 0.05–40.0 Hz, sampling frequency of 125 Hz, and resolution of 10 bits for 24-h Holter recordings to assess PACs. All recordings were scanned and interpreted via SCM-510 software (Fukuda Denshi, Tokyo, Japan) and interpreted by using the interactive method. We have counted the short run of PACs and took those into account while counting PACs. The SCM-510 software was programmed to automatically identify arrhythmic events or artificial noises. The basis of verification of PAC consisted of 3 criteria: prematurity, post-contraction pause, and morphology.6
A PAC was defined by a coupling interval to the preceding QRS complex <70% of the mean RR interval, and the QRS complexes had a duration of <0.11 s unless aberration was suspected and the post-contraction pause had to be non-compensatory. The total number of PACs was summed during the entire period. To account for the slight variations in recording time, the mean number of PACs per h was used as the primary outcome variable in this study. The primary editing and analyses were manually performed by one well-trained medical technologist supervised by one expert cardiologist (T.H.), certified by the Japanese Circulation Society, who were blinded regarding the status and related information of participants. Regarding ensuring intrareader reproducibility of PAC, it was tested by a blinded reanalysis of a random sample of 50 recordings, and the intraclass correlation coefficient was 0.97. The median (25%, 75% tiles) of the recording duration was 24.0 (23.6, 24.4) h, and all recordings met the definition of a valid recording as a recording duration of at least 18 h.9
We also assessed premature ventricular contractions (PVCs); frequency response of 0.05–40.0 Hz, sampling frequency of 125 Hz, and resolution of 10 bits for 24-h Holter recordings. PVCs were defined as premature beats with a QRS duration of >120 ms and different QRS-wave and T-wave morphology compared with normal sinus beats. The intrareader reproducibility of PVCs was also tested by a blinded reanalysis of a random sample of 50 recordings, and the intraclass correlation coefficient was 0.99. The median (25%, 75% tiles) of the recording duration was 24.0 (23.6, 24.4) h. All recordings met the definition of a valid recording with a recording duration of at least 18 h.9
Study Variables
Demographic data, medical history, use of medications, and lifestyle factors including smoking and alcohol consumption were collected from the participants by trained research technicians using a self-administered questionnaire. Details of the assessment of covariates have been described elsewhere.11
Briefly, smokers and alcohol drinking habits were defined as either “current” (smoke/consume alcohol in the last 30 days), “past” (those who quit 30 days prior to the study), or “never” (those who never smoke/consume alcohol). “Current drinkers” were again subdivided into “light drinkers” (<23 g/day), “moderate drinkers” (>23–46 g/day), or “heavy drinkers” (>46 g/day). We asked drinkers to estimate the frequency and amount of alcohol they consume during a usual week. Volumes were converted to the estimated amount of ethanol consumed in grams per week.13
Body mass index (BMI) was defined as body weight (kg) divided by the square of the height (m). Using an automated sphygmomanometer (BP-8800SF; Omron Health Care, Kyoto, Japan), the mean of 2 consecutive measurements on the right arm with participants in a seated position after a strict 5-min rest period was used to determine blood pressure. Hypertension was defined as systolic blood pressure of ≥140 mmHg, diastolic blood pressure of ≥90 mmHg, or use of antihypertensive medication. Heart rate was measured as heartbeats per minute on a 24-h Holter electrocardiogram. We used maximum (the highest value), resting (the lowest values usually in a resting position), and mean heart rate (the average value) recorded during 24 h. The participants who exercised more than 10 min over the current 3 months or more were defined as physically active, and the data were recorded as number of days per week of leisure-time physical activity.13
Venipuncture was performed early in the clinic visit following measurement of blood pressure after at least a 12-h fast. Samples were sent for routine laboratory tests including the assessment of lipid profiles and glucose. Total cholesterol and triglycerides were measured using enzymatic assays, and high-density lipoprotein (HDL) cholesterol was measured using a direct method (Kyowa Medix, Tokyo, Japan). We calculated low-density lipoprotein (LDL) cholesterol by using the Friedewald equation.14
Lipid measurements were standardized annually according to the protocol of the Centers for Disease Control and Prevention/Cholesterol Reference Method Laboratory Network. Plasma glucose levels were determined by sodium fluoride-treated plasma using the hexokinase glucose-6 phosphate-dehydrogenase enzymatic assay. Glycated hemoglobin (HbA1c) was measured by the latex agglutination inhibition assay according to either the Japan Diabetes Society (JDS) protocol or that of the National Glycohemoglobin Standardization Program (NGSP). JDS values were converted to NGSP values using the equation recommended by the JDS as follows: NGSP value (%) = 1.02 × JDS value (%) + 0.25.15
Diabetes mellitus was defined as fasting glucose of ≥126 mg/dL or HbA1c (NGSP) of ≥6.5%, or use of any antidiabetic medication. Serum creatinine levels were measured using an enzymatic assay (Espa CRE-liquid II; NIPRO, Osaka, Japan). The estimated glomerular filtration rate (eGFR) was calculated using serum creatinine levels for Japanese men: eGFR (mL/min/1.73 m2)=194×serum creatinine−1.094
×age−0.287.16
Statistical Analysis
The participants were divided into 2 groups based on the median value of PACs per h (2.85 PACs per h). Participants’ characteristics are shown using medians and interquartile ranges for continuous variables and percentages for categorical variables. The characteristics between the 2 groups were compared using the unpaired Student’s t-test or Wilcoxon rank-sum test for continuous variables and the chi-squared test for categorical variables. Number of PACs per h according to age categories (40–59, 60–69, and 70–79 years) was compared by using the Kruskal-Wallis test. Similarly, the number of PACs were also compared according to height, mean heart rate, triglycerides, physical activity, smoking, and drinking categories. We performed a negative binomial regression to assess the factors independently related to the number of PACs per h.9
Our analyses were performed with sequential adjustment: Model 1 was adjusted for age and Model 2 was simultaneously adjusted for all variables. To assess whether number of PVCs was associated with PAC frequency, we additionally added number of PVCs to a multivariable model. Covariates with a skewed distribution were log transformed; missing data were not included in the analyses.
For selection of the appropriate variables for statistical modeling, we performed the stepwise approach based on the value of the Akaike Information Criterion, which gives a measure of the goodness of fit. We also checked background information carefully to identify the clinically strong variables to set our final analysis model. Because aging itself is related to other cardiovascular risk factors, we also checked for the interaction of age with related factors showing no persistent interaction between them (non-significant). For the sensitivity analysis, we examined the quartiles of number of PACs per h (≤1.19, 1.20–2.84, 2.85–7.86, and >7.86) as dependent variables in multivariable ordinal logistic regression. We also performed a negative binomial regression analysis excluding the participants with anti-hypertensive medication use because β-blockers or calcium channel blockers may affect the incidence of PACs. Furthermore, we estimated the risk ratios (RRs) and 95% confidence intervals (CIs) per 10-unit increment in age [years], HDL-C [mg/dL], LDL-C [mg/dL], and mean heart rate [beats/min]; per 1-unit increment in BMI [kg/m2] and TG [log]; per 0.1 unit increment in height [m] for PAC frequency. All analyses were performed by using SAS version 9.4 (SAS Institute, Cary, NC, USA). A 2-tailed P value of <0.05 was prespecified to indicate statistical significance.
Results
The mean age of the participants was 66.6 (standard deviation [SD], 7.2) years. PACs were very common, as 99% (n=513) of the participants had at least 1 PAC on 24-h Holter electrocardiogram.
Table 1
shows the characteristics of participants stratified by the median number of PACs per h. The group having a higher number of PACs was older and had lower levels of resting and mean heart rates, and lower triglycerides, compared with the group with a lower number of PACs.
Table 1.
Participant Characteristics Stratified by the Median Number of PACs per h, SESSA, Shiga, Japan (2010–2015)
| Characteristics |
<2.85 PACs/h
(n=258) |
≥2.85 PACs/h
(n=259) |
P value* |
| No. of PACs per h |
1.1 (0.6–1.8) |
7.8 (4.6–22.6) |
|
| Age, years |
67.0 (62.0–70.0) |
69.0 (66.0–73.0) |
<0.001 |
| Height, m |
1.66 (1.63–1.70) |
1.66 (1.62–1.70) |
0.316 |
| BMI, kg/m2 |
23.3 (21.7–25.0) |
23.1 (21.5–24.8) |
0.451 |
| Systolic BP, mmHg |
128.7 (118.0–140.5) |
131.7 (120.5–143.5) |
0.116 |
| Diastolic BP, mmHg |
78.0 (71.5–84.0) |
76.2 (69.5–83.0) |
0.053 |
| Total cholesterol, mg/dL |
204.5 (178.0–229.0) |
199.0 (181.0–221.0) |
0.184 |
| LDL-C, mg/dL |
117.0 (97.0–140.0) |
115.0 (99.0–135.0) |
0.435 |
| HDL-C, mg/dL |
56.0 (47.0–70.0) |
59.0 (50.0–71.0) |
0.276 |
| Triglycerides, mg/dL |
112.5 (78.0–164.0) |
99.0 (71.0–137.0) |
0.011 |
| Maximum HR, beats/min |
111.0 (103.0–123.0) |
112.0 (100.0–123.0) |
0.143 |
| Resting HR, beats/min |
53.0 (48.0–57.0) |
50.2 (46.0–54.0) |
<0.001 |
| Mean HR, beats/min |
72.6 (67.0–78.0) |
69.4 (63.0–75.0) |
<0.001 |
| eGFR, mL/min/1.73 m2 |
70.3 (61.7–78.8) |
69.4 (61.5–78.8) |
0.859 |
| HbA1c, % |
5.8 (5.5–6.2) |
5.8 (5.5–6.2) |
0.815 |
| No. of PVC per h |
3.0 (1.0–27.0) |
10.0 (3.0–83.0) |
0.065 |
| Physical activity |
192 (74.4) |
201 (77.6) |
0.396 |
| Hypertension |
139 (53.8) |
142 (55.0) |
0.790 |
| Diabetes mellitus |
54 (20.9) |
58 (22.4) |
0.669 |
| Diabetic medication |
36 (13.9) |
40 (15.5) |
0.619 |
| Anti-hypertensive medication |
95 (36.8) |
94 (36.5) |
0.953 |
| Lipid lowering therapy |
63 (24.4) |
53 (20.5) |
0.291 |
| Smoking status |
| Past |
157 (60.8) |
150 (58.1) |
0.802 |
| Current |
49 (18.9) |
54 (20.9) |
|
| Drinking status |
| Past |
8 (3.1) |
15 (5.8) |
0.558 |
| Light |
105 (40.7) |
107 (41.4) |
|
| Moderate |
63 (24.4) |
61 (23.6) |
|
| Heavy |
44 (17.0) |
36 (13.95) |
|
Data are expressed as median (interquartile range) or n (%). Number of observations across the categories may not add up to the total given number because of missing data. Diabetes mellitus was defined as fasting glucose of ≥126 mg/dL, hemoglobin A1c of ≥6.5%, or the use of any antidiabetic medication. Hypertension was defined as systolic BP of ≥140 mmHg, diastolic BP of ≥90 mmHg, or use of antihypertensive medication. The participants who exercised more than 10 min regularly over the current 3 months or more were defined as physically active. *Based on the unpaired Student’s t-test/Wilcoxon rank-sum test for continuous variables and a chi-squared test for categorical variables. BMI, body mass index; BP, blood pressure; eGFR, estimated glomerular filtration rate; HbA1c, hemoglobin A1c; HDL-C, high-density lipoprotein cholesterol; HR, heart rate; LDL-C, low-density lipoprotein cholesterol; PAC, premature atrial contraction; PVC, premature ventricular contraction; SESSA, Shiga Epidemiological Study of Subclinical Atherosclerosis.
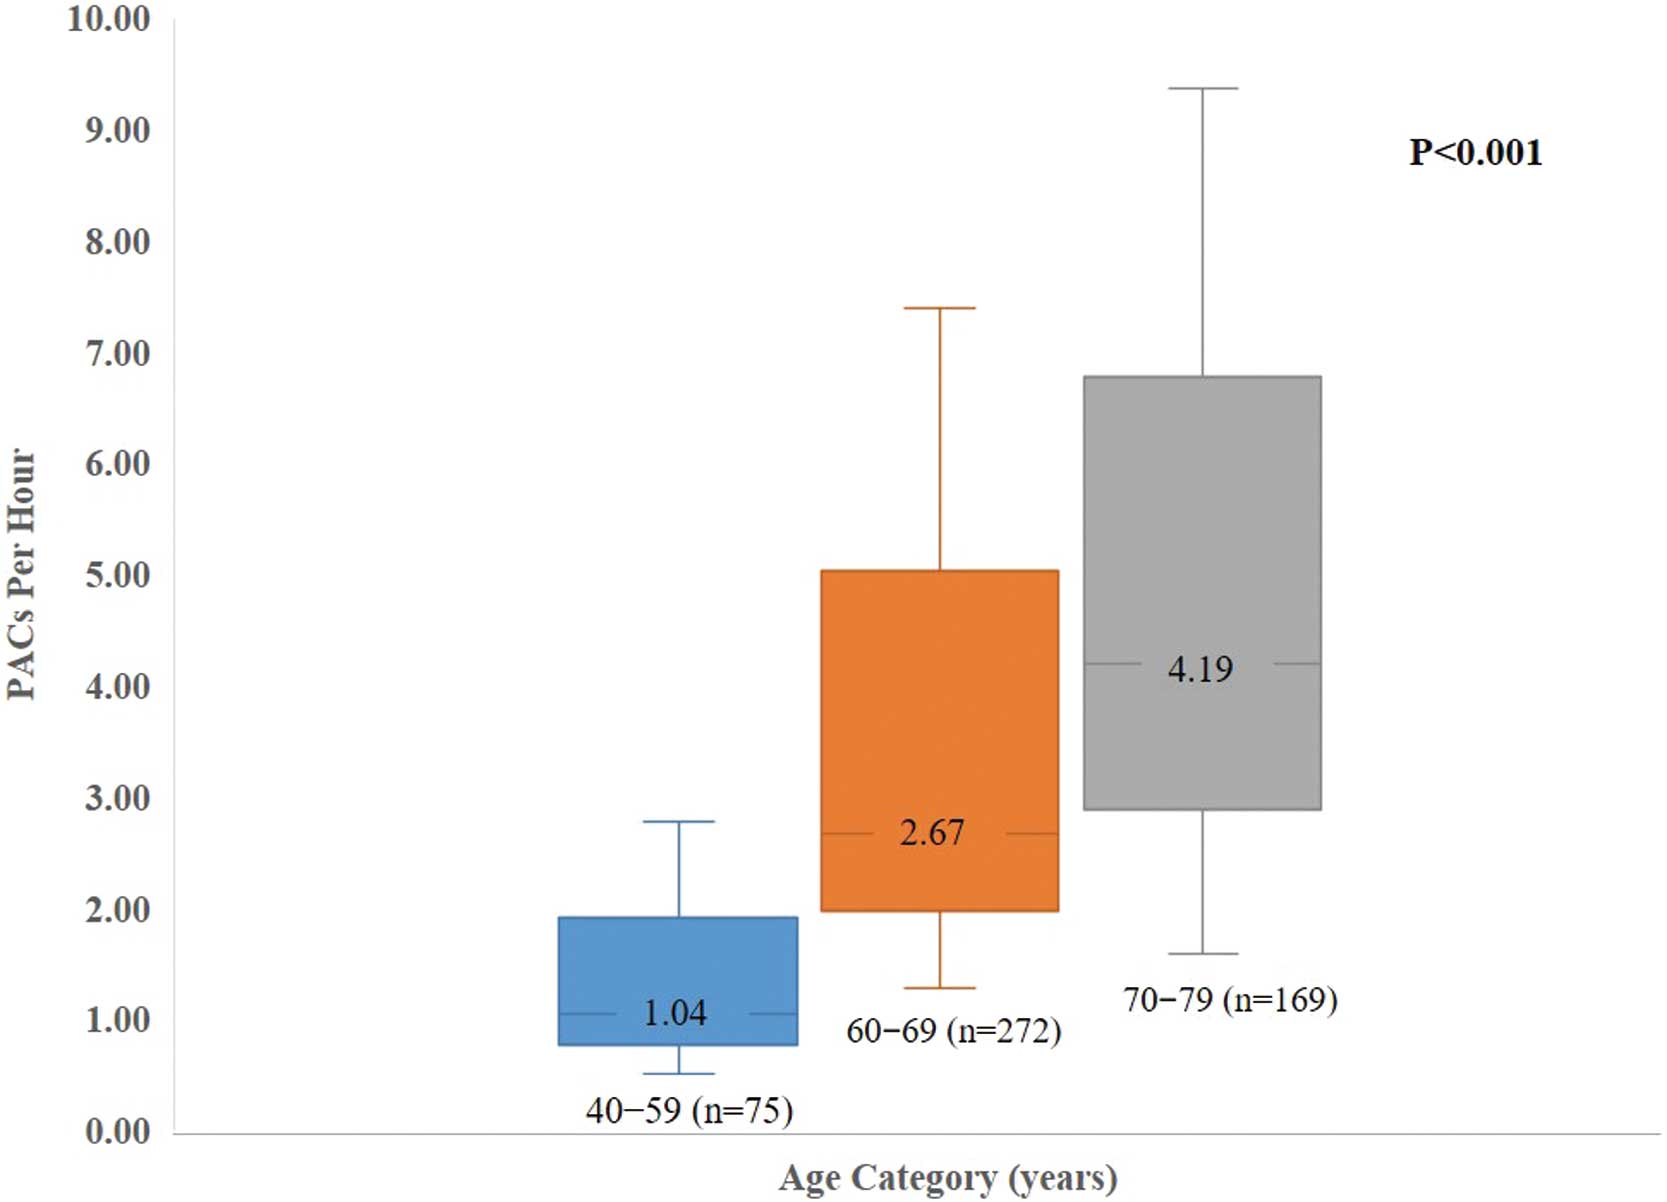
In
Figure 2, the median number (interquartile range) of PACs per h was 1.04 (0.50–2.78), 2.67 (1.28–7.39), and 4.19 (1.58–9.37) among the participants aged 40–59, 60–69, and 70–79 years, respectively (P<0.001). In
Supplementary Figure A–F, the median number (interquartile range) of PACs per h according to categories of height, was 3.28 (1.39–7.72), 2.05 (1.01–7.87), 2.94 (1.30–7.75), triglycerides was 3.28 (1.55–9.47), 3.41 (1.38–9.65), 2.14 (0.87–5.22), mean heart rates were 3.92 (1.53–9.74), 2.74 (1.18–6.91), 2.05 (1.00–6.80); physical activity categories was 3.42 (1.19–8.48), 2.66 (1.05–6.65); smoking and drinking categories was 2.89 (1.28–6.48), 2.75 (1.19–7.52), 3.37 (1.03–10.47) and 3.23 (1.04–7.27), 3.94 (1.67–12.54), 2.78 (1.19–7.83) respectively.
The results from a negative binomial regression are shown in
Table 2. In Model 1, adjustment for age showed that height (RR per 1-SD increment, 1.22; 95% CI, 1.06–1.40; P<0.001), HDL cholesterol (RR per 1-SD increment, 1.30; 95% CI, 1.10–1.54; P<0.001), and current moderate alcohol consumption compared with never consumers (RR, 1.64; 95% CI, 1.06–2.54; P<0.05) were positively associated with the number of PACs per h, whereas LDL cholesterol (RR per 1-SD increment, 0.86; 95% CI, 0.75–0.98; P<0.05), triglycerides (RR per 1-SD increment, 0.81; 95% CI, 0.67–0.97; P<0.05), mean heart rate (RR per 1-SD increment, 0.76; 95% CI, 0.64–0.89; P<0.001), and physical activity (RR, 0.60; 95% CI, 0.42–0.85; P<0.01) were inversely associated with the number of PACs per h. After adjustment by all covariates simultaneously (Model 2), age (RR per 1-SD increment, 1.30; 95% CI, 1.08–1.57; P<0.001), height (RR per 1-SD increment, 1.19; 95% CI, 1.02–1.39; P<0.05), current smoking (RR, 1.69; 95% CI, 1.06–2.69; P<0.05), and current moderate (RR, 1.97; 95% CI, 1.23–3.16; P<0.01) and heavy (RR, 1.84; 95% CI, 1.12–3.01; P<0.05) alcohol consumption were positively associated with the number of PACs per h, whereas triglycerides (RR per 1-SD increment, 0.79; 95% CI, 0.65–0.97; P<0.05), mean heart rate (RR per 1-SD increment, 0.69; 95% CI, 0.59–0.80; P<0.001), and physical activity (RR, 0.63; 95% CI, 0.43–0.93; P<0.005) were inversely associated with the number of PACs per h. BMI as a continuous variable showed a borderline association with number of PACs per h (RR per 1-SD increment, 1.18; 95% CI, 0.99–1.41; P=0.051). Additionally, we defined obesity based on a BMI ≥25 kg/m2
as a categorical variable, and we found a strong association between obesity and PAC frequency in both Model 1 (RR, 1.73; 95% CI, 1.25–2.40; P<0.001) and Model 2 (RR, 2.34; 95% CI, 1.63–3.37; P<0.001) (data not shown in tables to avoid concern of over adjustments).
Table 2.
Negative Binomial Regression to Assess Variables Related to the Number of PACs per h
| Variables |
Model 1 |
Model 2 |
| Risk ratio* (95% CI) |
P value |
Risk ratio* (95% CI) |
P value |
| Age (per 1-SD) |
1.37 (1.20–1.58) |
<0.001 |
1.30 (1.08–1.57) |
<0.001 |
| BMI (per 1-SD) |
1.06 (0.92–1.21) |
0.399 |
1.18 (0.99–1.41) |
0.051 |
| Height (per 1-SD) |
1.22 (1.06–1.40) |
0.005 |
1.19 (1.02–1.39) |
0.027 |
| LDL-C (per 1-SD) |
0.86 (0.75–0.98) |
0.031 |
0.94 (0.80–1.11) |
0.499 |
| Triglycerides (log, per 1-SD) |
0.81 (0.67–0.97) |
0.023 |
0.79 (0.65–0.97) |
0.024 |
| HDL-C (per 1-SD) |
1.30 (1.10–1.54) |
0.001 |
1.14 (0.93–1.41) |
0.190 |
| Mean HR (per 1-SD) |
0.76 (0.64–0.89) |
<0.001 |
0.69 (0.59–0.80) |
<0.001 |
| Diabetes mellitus (Yes vs. No) |
0.86 (0.61–1.22) |
0.414 |
0.74 (0.50–1.11) |
0.151 |
| Hypertension (Yes vs. No) |
1.24 (0.91–1.69) |
0.156 |
0.93 (0.65–1.34) |
0.727 |
| Physical activity (Yes vs. No) |
0.60 (0.42–0.85) |
0.004 |
0.63 (0.43–0.93) |
0.021 |
| Smoking |
| Current vs. Never |
1.38 (0.87–2.16) |
0.160 |
1.69 (1.06–2.69) |
0.027 |
| Past vs. Never |
0.97 (0.66–1.41) |
0.874 |
0.75 (0.50–1.12) |
0.171 |
| Drinking |
| Light vs. Never |
1.52 (0.70–3.30) |
0.283 |
2.13 (0.97–4.65) |
0.056 |
| Moderate vs. Never |
1.64 (1.06–2.54) |
0.023 |
1.97 (1.23–3.16) |
0.004 |
| Heavy vs. Never |
1.42 (0.88–2.28) |
0.141 |
1.84 (1.12–3.01) |
0.014 |
| Past vs. Never |
1.33 (0.79–2.25) |
0.278 |
1.25 (0.72–2.17) |
0.426 |
| Lipid-lowering therapy (Yes vs. No) |
1.36 (0.97–1.92) |
0.069 |
1.40 (0.92–2.13) |
0.114 |
| No. of PVCs per h |
1.28 (0.81–2.02) |
0.287 |
1.07 (0.61–1.87) |
0.799 |
Model 1 is adjusted for age; Model 2 includes all variables simultaneously. *Data are risk ratio per 1-SD increment for continuous variables or compared with the reference group for categorical variables. Age (per 1-SD)=7.24 years; BMI (per 1-SD)=2.80 kg/m2; Height (per 1-SD)=0.05 m; LDL-C (per 1-SD)=30.5 mg/dL; Triglycerides (log per 1-SD)=0.53; HDL-C (per 1-SD)=17.0 mg/dL; Mean HR (per 1-SD)=7.0 beats/min; No. of PVCs (per 1-SD)=2 counts/h. CI, confidence interval; HR, heart rate; SD, standard deviation. Other abbreviations as in Table 1.
In multivariable ordinal logistic regression (Table 3), age (odds ratio [OR] per 1-SD increment, 1.94; 95% CI, 1.59–2.37; P<0.001), height (OR per 1-SD increment, 1.30; 95% CI, 1.08–1.56; P<0.05), triglycerides (OR per 1-SD increment, 0.76; 95% CI, 0.62–0.93; P<0.05), and mean heart rate (OR per 1-SD increment, 0.73; 95% CI, 0.62–0.86; P<0.001) showed independent associations with PAC frequency (Model 2).
Table 3.
Ordinal Logistic Regression to Assess Variables Related to the Number of PACs per h
| Risk factors |
Model 1 |
Model 2 |
| Odds ratio* (95% CI) |
P value |
Odds ratio* (95% CI) |
P value |
| Age (per 1-SD) |
1.81 (1.48–2.22) |
<0.001 |
1.94 (1.59–2.37) |
<0.001 |
| BMI (per 1-SD) |
0.94 (0.80–1.11) |
0.500 |
1.09 (0.90–1.30) |
0.353 |
| Height (per 1-SD) |
1.24 (1.05–1.21) |
0.038 |
1.30 (1.08–1.56) |
0.004 |
| LDL-C (per 1-SD) |
0.87 (0.73–1.02) |
0.094 |
0.90 (0.76–1.06) |
0.220 |
| Triglyceride (log, per 1-SD) |
0.72 (0.60–0.86) |
<0.001 |
0.76 (0.62–0.93) |
0.010 |
| HDL-C (per 1-SD) |
1.13 (0.96–1.33) |
0.132 |
1.08 (0.89–1.31) |
0.390 |
| Mean HR (per 1-SD) |
0.73 (0.62–0.86) |
<0.001 |
0.73 (0.62–0.86) |
<0.001 |
| Diabetes mellitus (Yes vs. No) |
0.93 (0.62–1.38) |
0.735 |
1.03 (0.69–1.55) |
0.870 |
| Hypertension (Yes vs. No) |
0.94 (0.67–1.32) |
0.759 |
0.97 (0.68–1.37) |
0.874 |
| Physical activity (Yes vs. No) |
1.11 (0.76–1.60) |
0.579 |
1.16 (0.80–1.68) |
0.413 |
| Smoking |
| Current vs. Never |
1.19 (0.71–2.00) |
0.498 |
1.49 (0.88–2.50) |
0.130 |
| Past vs. Never |
0.85 (0.56–1.28) |
0.445 |
0.91 (0.60–1.38) |
0.683 |
| Drinking |
| Light vs. Never |
1.14 (0.71–1.83) |
0.566 |
1.17 (0.72–1.91) |
0.509 |
| Moderate vs. Never |
1.19 (0.71–2.00) |
0.493 |
1.23 (0.71–2.14) |
0.455 |
| Heavy vs. Never |
1.16 (0.66–2.05) |
0.596 |
1.38 (0.74–2.55) |
0.304 |
| Past vs. Never |
1.65 (0.70–3.85) |
0.244 |
1.76 (0.73–4.19) |
0.201 |
| Lipid-lowering therapy (Yes vs. No) |
0.82 (0.55–1.21) |
0.327 |
1.04 (0.69–1.57) |
0.832 |
| No. of PVCs per h |
1.39 (0.73–2.66) |
0.306 |
1.29 (0.59–2.81) |
0.511 |
Model 1 is adjusted for age; Model 2 includes all variables simultaneously. *Data are odds ratio per 1-SD increment for continuous variables and compared with reference group for categorical variables. Age (per 1-SD)=7.24 years; BMI (per 1-SD)=2.80 kg/m2; Height (per 1-SD)=0.05 m; LDL-C (per 1-SD)=30.5 mg/dL; Triglycerides (log per 1-SD)=0.53; HDL-C (per 1-SD)=17.0 mg/dL; Mean HR (per 1-SD)=7.0 beats/min; No. of PVCs (per 1-SD)=2 counts/h. Abbreviations as in Tables 1,2.
In negative binomial regression analysis (Supplementary Table 1), after excluding those participants having a history of anti-hypertensive medication (n=328) use, age (RR per 1-SD increment, 1.25; 95% CI, 1.08–1.57; P<0.001), triglycerides (RR 0.79; 95% CI, 0.65–0.97; P<0.050), mean heart rate (RR 0.78; 95% CI, 0.65–0.94; P<0.050), physical activity (RR, 0.71; 95% CI, 0.43–0.93; P<0.050), current smoking (RR, 1.62; 95% CI, 1.02–2.95; P<0.05), and current light (RR, 2.63; 95% CI, 1.02–6.77; P<0.05) and heavy drinking (RR, 2.59; 95% CI, 1.37–4.89; P<0.010) showed an independent association with PACs (Model 2). In
Supplementary Table 2, we observed similar results; age (RR, 1.45; 95% CI [1.12–1.87] per 10-years increment), height (1.02 [1.01–1.05] per 0.1 meter increment), triglycerides (0.69 [0.49–0.97], log, per 1-unit increment), mean heart rate (0.65 [0.54–0.78] per 10 beats/min increment), physical activity (0.63 [0.43–0.93]), current smoking (1.69 [1.06–2.69]), current moderate (1.97 [1.23–3.16]) and heavy (1.84 [1.12–3.01]) alcohol consumption were associated with PAC frequency.
Discussion
In this population-based study of apparently healthy middle-aged to older men, the number of PACs per h was associated with age, height, smoking, alcohol consumption, heart rate, physical activity, and triglycerides. To our best knowledge, this is the first population-based study in East Asia to examine the burden of PACs based on 24-h Holter monitoring data and their determinants, where stroke is dominant among cardiovascular diseases. Our findings are also comparable with those reported in Western countries with similar interests.9,17
In our study, we estimated that 99% of all participants had at least 1 PAC during 24 h. The distribution of a higher number of PACs was higher among older participants. Similarly, a higher number of PACs was observed with advancing age among middle-aged or older participants from the Cardiovascular Health Study (age range, >65 years)17
and from the Swiss cohort Study on Air Pollution and Lung Diseases in Adults (SAPALDIA) (age range, ≥50 years).9
Our study has revealed the interesting finding of an inverse association between PAC frequencies and mean heart rates; a previous study focusing on AF also reported similar findings.18
Lower heart rate could be related to larger stroke volume, possibly leading to increased atrial stretch or strain, which might result in structural and electrical remodeling and can initiate AF.19
Furthermore, lower heart rate is also known as a measure of autonomic imbalance leading to AF.20
Understandably a large number of PACs are associated with higher risk of AF occurrence;6
another explanation could simply be that when the heart rate is lower, there is more time for an extra beat to occur; finally, we may assume that the association between PAC frequency and lower heart rate follows pathophysiology similar to that for AF.19
We also first revealed an interesting inverse association between PAC frequency and triglyceride levels. It has been reported by recent studies showing that lipid profiles, including triglycerides, have an inverse association with AF.21,22
The pathophysiology behind this inverse association may be explained by the fact that as all cholesterols including triglycerides are essential for the cell membrane, changes in cholesterol levels can lead to alteration of cell membrane properties that can affect cell membrane permeability and membrane proteins including ion channels, pumps, and receptors,23
which can hamper electrical gradient and resting potential through the cell membrane, leading to vulnerability to arrhythmia. In the SAPALDIA study,9
they reported an inverse association between HDL-C and PACs frequency because the overall inverse relationship between HDL cholesterol and cardiovascular disease, including incident AF, might be the pathophysiology.24,25
Controversially, this finding could not be confirmed in a more recent analysis as no significant association between HDL-C and incident AF was found.26
In terms of LDL-C, being an essential lipid for the cell membrane and was found to be inversely related to incident AF,26
we could not report any association with PACs, similar to findings of a prior study.9
The difference in the findings between the SAPALDIA study and ours may be due to the differences in participants’ characteristics (e.g., race/ethnicity, age, or sex) or discrepancies in lipid levels; however, for further evaluation, future studies are required.27
BMI, as a continuous variable, showed a borderline positive association with PAC frequency, whereas defined obesity (BMI ≥25 kg/m2) as a categorical variable showed a significant association with PAC frequency. Obesity adversely affects cardiovascular hemodynamics and cardiac structures, and increases risk of incident AF through the development of the electro-anatomic remodeling in the atrium.3,28,29
However, cross-sectional analyses from the SAPALDIA study did not report such an association between BMI and PACs,9
perhaps because of the difference in the distribution of BMI between the cohorts, or the Japanese population being thinner.
Previous studies9,30–34
have revealed an association between AF and height, smoking, and drinking habits; we also reported positive associations of height, current smoking, and drinking habits with a larger number of PACs. It has been hypothesized that the higher frequency of PACs among taller individuals may be a result of a close relationship between body size and left atrial size.33
Interestingly, genetic or early-life determinants might play an important role in this relationship.30
An earlier study has revealed a positive association between PACs and being taller among the Western population;9
we have found similar findings in an Asian population. To confirm the effect of any ethnic variation on PACs, future studies are recommended. Smoking contributes to the development of atrial fibrosis via nicotine, which can lead to atrial arrhythmias by reducing electrical impulse conduction in cardiac tissue.35
A systematic review and meta-analysis clarified that the risk for current smokers of developing AF was higher than that in former smokers.36
Our study reported that current smoking, but not former smoking, was positively associated with PAC frequency, suggesting that a longer time since quitting smoking might be associated with a lower likelihood of atrial arrhythmia.
Higher alcohol consumption was linked to a higher risk of AF,32
which may result from an alcoholic heart disorder such as cardiomyopathy;31
however, data from previous epidemiological studies showed that mild-to-moderate alcohol consumption protected against the development of heart failure,37
which could lead to a lower risk of atrial arrhythmia. Therefore, our finding regarding the association between moderate alcohol consumption and PAC frequency remains controversial.
We found an inverse association between physical activity and number of PACs per h. Our findings support the previous findings of the SAPALDIA study.9
A prospective cohort study reported that moderate physical activity was associated with a reduced risk of AF, whereas higher activity attenuated the benefits of moderate activity on AF risk, suggesting a J-shaped relationship between leisure-time physical activity and AF,38
indicating that vigorous activity might increase the risk of AF. In our current research, we did not collect information regarding physical activity levels; therefore, it is difficult to explain the underlying pathophysiology clearly.
Regarding the sensitivity analysis, we chose to perform ordinal logistic regression to discover how the dependent variable behaves (quartiles of PACs per h) in an ordinal fashion to each independent variable. The different outcomes in ordinal logistic regression may cause some determinants to be missed in comparison with negative binomial regression (Table 2). For
Supplementary Table 1, a negative binomial regression analysis was performed, excluding participants with anti-hypertensive medication use, because β-blockers or calcium channel blockers may affect the incidence of PACs and observed results of this study.
Study Limitations
Several limitations of the present study warrant consideration. First, we studied only middle-aged to older men, and the sample was obtained from a single area in Japan, both of which may limit the generalizability of the present study results. Second, owing to the cross-sectional study design, the true relationship between PACs and their determinants might have been somewhat diluted. Third, the number of PACs recorded may have had day-to-day variability, which we were unable to assess because only 1 recording per individual was obtained. Assuming that this variability is random, this might have slightly reduced our power to detect significant associations. Fourth, we currently do not have the data for β-blocker and other antiarrhythmic drug intake for the present study. Fifth, in the current study, we could not indicate the relationship of heart rate per each clock hour (circadian variation) or biomarkers representing myocardial damage (e.g., B-type natriuretic peptide, troponin, or creatine phosphokinase) and PAC frequency. Finally, as very few earlier studies have been conducted primarily focusing on the risk factors for PACs, in some cases, we had to discuss possible pathophysiologies regarding AF that are not directly related to PACs; therefore, evidence for this particular field is essential.
Conclusions
In a middle-aged to older male cohort of the general population in Japan with neither apparent cardiovascular disease nor AF, the majority of the participants had at least 1 PAC per h on a 24-h Holter electrocardiogram. Age, height, current smoking, current alcohol consumption, heart rate, physical activity, and triglycerides were identified as independent determinants of PAC frequency. This study has generated new knowledge about the modifiable determinants for the prevention of PACs related to future AF and stroke, and expressly underlines the importance of a healthy lifestyle. Future research is warranted to investigate the association of frequent PAC with incident AF among this study population.
Acknowledgments
The authors thank the SESSA investigators, staff, and study participants for their dedication and commitment. The names of the members of the SESSA research group have been provided in the
Supplementary File. We also thank Ms. Muramatsu for providing assistance with the analysis of Holter electrocardiograms.
Sources of Funding
This study has been funded by Grants-in-Aid for Scientific Research: (A) 13307016, (A) 17209023, (A) 21249043, (A) 23249036, (A) 25253046, (A) 15H02528, (A) 18H04074, (C) 20K10529, Grants-in-Aid for Scientific Research Young Scientists: (B) 17K15827; Research Activity Start-up 25893097 from the Ministry of Education, Culture, Sports, Science, and Technology, Japan; by grant R01HL 068200 from the National Institute of Health, Japan; and from Kao Research Council for the Study of Healthcare Science (Tokyo, Japan).
Disclosures
The authors declare no conflicts of interest.
IRB Information
This study was approved by the Institutional Review Board of Shiga University of Medical Science (G2008-61).
Data Availability
The deidentified participant data will not be shared.
Supplementary Files
Please find supplementary file(s);
http://dx.doi.org/10.1253/circj.CJ-21-0872
References
- 1.
Conen D, Chae CU, Glynn RJ, Tedrow UB, Everett BM, Buring JE, et al. Risk of death and cardiovascular events in initially healthy women with new-onset atrial fibrillation. JAMA 2011; 305: 2080–2087.
- 2.
Magnani JW, Rienstra M, Lin H, Sinner MF, Lubitz SA, McManus DD, et al. Atrial fibrillation: Current knowledge and future directions in epidemiology and genomics. Circulation 2011; 124: 1982–1993.
- 3.
Huxley RR, Lopez FL, Folsom AR, Agarwal SK, Loehr LR, Soliman EZ, et al. Absolute and attributable risks of atrial fibrillation in relation to optimal and borderline risk factors: The Atherosclerosis Risk in Communities (ARIC) study. Circulation 2011; 123: 1501–1508.
- 4.
Lau DH, Nattel S, Kalman JM, Sanders P. Modifiable risk factors and atrial fibrillation. Circulation 2017; 136: 583–596.
- 5.
Miyazawa K, Ogawa H, Mazurek M, Shantsila E, Lane DA, Wolff A, et al. Guideline-adherent treatment for stroke and death in atrial fibrillation patients from UK and Japanese AF Registries. Circ J 2019; 83: 2434–2442.
- 6.
Binici Z, Intzilakis T, Nielsen OW, Køber L, Sajadieh A. Excessive supraventricular ectopic activity and increased risk of atrial fibrillation and stroke. Circulation 2010; 121: 1904–1911.
- 7.
Himmelreich JCL, Lucassen WAM, Heugen M, Bossuyt PMM, Tan HL, Harskamp RE, et al. Frequent premature atrial contractions are associated with atrial fibrillation, brain ischaemia, and mortality: A systematic review and meta-analysis. Europace 2019; 21: 698–707.
- 8.
Huang BT, Huang FY, Peng Y, Liao YB, Chen F, Xia TL, et al. Relation of premature atrial complexes with stroke and death: Systematic review and meta-analysis. Clin Cardiol 2017; 40: 962–969.
- 9.
Conen D, Adam M, Roche F, Barthelemy JC, Felber Dietrich D, Imboden M, et al. Premature atrial contractions in the general population: Frequency and risk factors. Circulation 2012; 126: 2302–2308.
- 10.
Ueshima H, Sekikawa A, Miura K, Turin TC, Takashima N, Kita Y, et al. Cardiovascular disease and risk factors in Asia: A selected review. Circulation 2008; 118: 2702–2709.
- 11.
Ueshima H, Kadowaki T, Hisamatsu T, Fujiyoshi A, Miura K, Ohkubo T, et al. Lipoprotein-associated phospholipase A2 is related to risk of subclinical atherosclerosis but is not supported by Mendelian randomization analysis in a general Japanese population. Atherosclerosis 2016; 246: 141–147.
- 12.
Hisamatsu T, Miura K, Fujiyoshi A, Kunimura A, Ito T, Miyazawa I, et al. Association between excessive supraventricular ectopy and subclinical cerebrovascular disease: A population-based study. Eur J Neurol 2019; 26: 1219–1225.
- 13.
Siddiquee AT, Kadota A, Fujiyoshi A, Miyagawa N, Saito Y, Suzuki H, et al. Alcohol consumption and cognitive function in elderly Japanese men. Alcohol 2020; 85: 145–152.
- 14.
Friedewald WT, Levy RI, Fredrickson DS. Estimation of the concentration of low-density lipoprotein cholesterol in plasma, without use of the preparative ultracentrifuge. Clin Chem 1972; 18: 499–502.
- 15.
Kashiwagi A, Kasuga M, Araki E, Oka Y, Hanafusa T, Ito H, et al. International clinical harmonization of glycated hemoglobin in Japan: From Japan Diabetes Society to National Glycohemoglobin Standardization Program values. J Diabetes Investig 2012; 3: 39–40.
- 16.
Matsuo S, Imai E, Horio M, Yasuda Y, Tomita K, Nitta K, et al. Revised equations for estimated GFR from serum creatinine in Japan. Am J Kidney Dis 2009; 53: 982–992.
- 17.
Stein PK, Barzilay JI, Chaves PH, Domitrovich PP, Gottdiener JS. Heart rate variability and its changes over 5 years in older adults. Age Ageing 2009; 38: 212–218.
- 18.
Persson AP, Fedorowski A, Hedblad B, Persson M, Juul-Möller S, Engström G, et al. Heart rate and premature atrial contractions at 24 hECG independently predict atrial fibrillation in a population-based study. Heart 2020; 106: 287–291.
- 19.
Nattel S, Harada M. Atrial remodeling and atrial fibrillation: Recent advances and translational perspectives. J Am Coll Cardiol 2014; 63: 2335–2345.
- 20.
Fedorowski A, Hedblad B, Engström G, Gustav Smith J, Melander O. Orthostatic hypotension and long-term incidence of atrial fibrillation: The Malmö Preventive Project. J Intern Med 2010; 268: 383–389.
- 21.
Lee HJ, Lee SR, Choi EK, Han KD, Oh S. Low lipid levels and high variability are associated with the risk of new-onset atrial fibrillation. J Am Heart Assoc 2019; 8: e012771.
- 22.
Suzuki S. “Cholesterol paradox” in atrial fibrillation. Circ J 2011; 75: 2749–2750.
- 23.
Goonasekara CL, Balse E, Hatem S, Steele DF, Fedida D. Cholesterol and cardiac arrhythmias. Expert Rev Cardiovasc Ther 2010; 8: 965–979.
- 24.
Lewington S, Whitlock G, Clarke R, Sherliker P, Emberson J, Halsey J, et al. Blood cholesterol and vascular mortality by age, sex, and blood pressure: A meta-analysis of individual data from 61 prospective studies with 55,000 vascular deaths. Lancet 2007; 370: 1829–1839.
- 25.
Watanabe H, Tanabe N, Watanabe T, Darbar D, Roden DM, Sasaki S, et al. Metabolic syndrome and risk of development of atrial fibrillation: The Niigata preventive medicine study. Circulation 2008; 117: 1255–1260.
- 26.
Lopez FL, Agarwal SK, Maclehose RF, Soliman EZ, Sharrett AR, Huxley RR, et al. Blood lipid levels, lipid-lowering medications, and the incidence of atrial fibrillation: The atherosclerosis risk in communities study. Circ Arrhythm Electrophysiol 2012; 5: 155–162.
- 27.
Nitsch D, Felber Dietrich D, von Eckardstein A, Gaspoz JM, Downs SH, Leuenberger P, et al. Prevalence of renal impairment and its association with cardiovascular risk factors in a general population: Results of the Swiss SAPALDIA study. Nephrol Dial Transplant 2006; 21: 935–944.
- 28.
Wang TJ, Parise H, Levy D, D’Agostino RB Sr, Wolf PA, Vasan RS, et al. Obesity and the risk of new-onset atrial fibrillation. JAMA 2004; 292: 2471–2477.
- 29.
Lavie CJ, Pandey A, Lau DH, Alpert MA, Sanders P. Obesity and atrial fibrillation prevalence, pathogenesis, and prognosis: Effects of weight loss and exercise. J Am Coll Cardiol 2017; 70: 2022–2035.
- 30.
Conen D, Tedrow UB, Cook NR, Buring JE, Albert CM. Birth weight is a significant risk factor for incident atrial fibrillation. Circulation 2010; 122: 764–770.
- 31.
Frost L, Vestergaard P. Alcohol and risk of atrial fibrillation or flutter: A cohort study. Arch Intern Med 2004; 164: 1993–1998.
- 32.
Larsson SC, Drca N, Wolk A. Alcohol consumption and risk of atrial fibrillation: A prospective study and dose-response meta-analysis. J Am Coll Cardiol 2014; 64: 281–289.
- 33.
Rosengren A, Hauptman PJ, Lappas G, Olsson L, Wilhelmsen L, Swedberg K. Big men and atrial fibrillation: Effects of body size and weight gain on risk of atrial fibrillation in men. Eur Heart J 2009; 30: 1113–1120.
- 34.
Staerk L, Wang B, Preis SR, Larson MG, Lubitz SA, Ellinor PT, et al. Lifetime risk of atrial fibrillation according to optimal, borderline, or elevated levels of risk factors: Cohort study based on longitudinal data from the Framingham Heart Study. BMJ 2018; 361: k1453.
- 35.
Goette A, Lendeckel U, Kuchenbecker A, Bukowska A, Peters B, Klein HU, et al. Cigarette smoking induces atrial fibrosis in humans via nicotine. Heart 2007; 93: 1056–1063.
- 36.
Aune D, Schlesinger S, Norat T, Riboli E. Tobacco smoking and the risk of atrial fibrillation: A systematic review and meta-analysis of prospective studies. Eur J Prev Cardiol 2018; 25: 1437–1451.
- 37.
Walsh CR, Larson MG, Evans JC, Djousse L, Ellison RC, Vasan RS, et al. Alcohol consumption and risk for congestive heart failure in the Framingham Heart Study. Ann Intern Med 2002; 136: 181–191.
- 38.
Morseth B, Graff-Iversen S, Jacobsen BK, Jørgensen L, Nyrnes A, Thelle DS, et al. Physical activity, resting heart rate, and atrial fibrillation: The Tromsø Study. Eur Heart J 2016; 37: 2307–2313.
