Abstract
Background: Patients with acute myocardial infarction (AMI) caused by calcified nodules (CN) have worse clinical outcomes following primary percutaneous coronary intervention (PCI). This study investigated the late vascular response after everolimus-eluting stent (EES) implantation assessed by optical coherence tomography (OCT) in patients with AMI caused by CN, by comparing with plaque rupture (PR) and plaque erosion (PE).
Methods and Results: Based on the OCT findings in AMI culprit lesions before PCI, a total of 141 patients were categorized into 3 groups (PR, PE, or CN), and the OCT findings immediately and 10 months after PCI were compared. The frequency of PR, PE, and CN was 85 (60%), 45 (32%), and 11 patients (8%), respectively. In the 10-month follow-up OCT, the frequency of lesions with uncovered struts and lesions with malapposed struts were highest in the CN group, followed by the PR and PE groups (82% vs. 52% vs. 40%, P=0.042 and 73% vs. 26% vs. 16%, P<0.001, respectively). The incidence of intra-stent thrombus, re-appearance of CN within the stent, and target lesion revascularization were higher in the CN group compared with the PR and PE groups (36% vs. 9% vs. 7%, P=0.028; 27% vs. 0% vs. 0%, P<0.001; and 18% vs. 2% vs. 2%, P=0.024, respectively).
Conclusions: Late arterial healing response at 10 months after EES implantation in the CN was worse compared with PR and PE in patients with AMI.
Percutaneous coronary intervention (PCI) using newer-generation drug-eluting stents (DES), such as everolimus-eluting stent (EES), is the established therapy for patients with acute myocardial infarction (AMI). Previous clinical trials have demonstrated the superior efficacy and safety of EES in AMI patients compared with bare-metal stents and first-generation DES.1,2 In addition, optical coherence tomography (OCT) studies assessed late phase vascular response after primary stenting for AMI and demonstrated that EES had a lower rate of uncovered struts, malapposed struts, and intra-stent thrombus in comparison with first-generation DES.3
AMI is mainly caused by plaque rupture (PR), plaque erosion (PE), or calcified nodules (CN) with subsequent occlusive thrombus formation.4–8 Recent OCT and intravascular ultrasound studies have demonstrated that the rate of target lesion revascularization (TLR), including recurrence of myocardial infarction after DES implantation, was highest in patients with CN compared to PR or PE.8,9 One autopsy case report with ex vivo intravascular imaging including OCT showed an unfavorable vascular response at the late phase after second-generation DES implantation for CN, including minimal or no neointima coverage with intra-stent thrombus.10 Therefore, we hypothesized that the late-phase arterial healing response in patients with CN was worse compared with patients with PR and PE.
OCT is a high-resolution imaging modality that enables not only identifying PR, PE, and CN in patients with AMI, but also assessing the late-phase vascular response after stent implantation.3,5–8,11 In the present study, we investigated the late-phase vascular response such as neointimal strut coverage, strut malapposition, and intra-stent thrombus after EES implantation in patients with AMI caused by CN.
Methods
Study Population
This is a retrospective study of AMI patients who underwent PCI with OCT guidance between January 2013 and July 2016 at Wakayama Medical University, Wakayama, Japan. Among these patients, we retrospectively analyzed patients who met the following criteria: if (1) coronary angiography demonstrated a de novo culprit lesion of AMI in a native coronary artery; (2) OCT was performed to evaluate the culprit lesion before and immediately after PCI; (3) primary PCI with EES (Xience V/Xience Prime/Xience Xpedition; Abbott Vascular, Santa Clara, California, USA) was performed; and (4) scheduled follow-up angiography and OCT 10 months after the index procedure was performed. In our hospital, the scheduled follow-up angiography and OCT 10 months after primary PCI with EES for AMI patients was recommended during the present study period regardless of ischemic symptoms or objective signs, unless patients had chronic kidney failure (serum creatinine >1.5 mg/dL) without hemodialysis, were aged >80 years old, had poor activity of daily living, a high risk of procedural complication judged by the attending physicians, and/or who refused the scheduled follow-up angiography and OCT. Based on the OCT findings in the AMI culprit lesions before PCI, patients were categorized into 3 groups (PR, PE, or CN). AMI was defined according to the universal definition.12 Exclusion criteria were patients with AMI due to stent thrombosis, coronary artery bypass graft failure, vasospasm, coronary embolization, spontaneous coronary artery dissection, or tight stenosis. Exclusion criteria for use of OCT in our hospital were cardiogenic shock, chronic kidney failure (serum creatinine >2.0 mg/dL) without hemodialysis, small or extremely tortuous vessels, and aorto-ostial coronary lesions.
This study complied with the Declaration of Helsinki regarding investigations in humans and was approved by the Ethics Committee of Wakayama Medical University (Reference no. 2994). Informed consent was obtained in the form of an opt-out option at the Wakayama Medical University.
Coronary Angiography, Primary PCI, and OCT Imaging
Before the index coronary catheterization, patients received oral aspirin (200 mg), and prasugrel 20 mg or clopidogrel 300 mg. During coronary catheterization, patients received intravenous heparin (a bolus of 100 IU/kg and additional doses aimed at achieving activated clotting time of 250–300 s). Thrombolysis was not performed for any patient. Coronary angiography was carried out in a standard manner. The culprit lesion was identified on the basis of the findings of a coronary angiogram, as well as an electrocardiogram and transthoracic echocardiogram. In patients with a Thrombolysis in Myocardial Infarction (TIMI) flow grade ≤2, aspiration thrombectomy with a 5.1-Fr aspiration catheter (Thrombuster III GR, Kaneka, Osaka, Japan or Export Advance, Medtronic Japan, Tokyo, Japan) or balloon angioplasty with a small balloon of ≤2.0 mm in diameter were allowed prior to the OCT imaging. Intracoronary isosorbide dinitrate (2–3 mg) was administered before the OCT procedure. A frequency domain OCT (FD-OCT) imaging system (C7-XR, St. Jude Medical, St. Paul, Minnesota, USA, ILUMIEN OPTIS, Abbott Vascular, Santa Clara, California, USA, or LUNAWAVE, Terumo, Tokyo, Japan) was used in the present study. The OCT catheter was advanced distally to the culprit lesion over a 0.014-inch conventional angioplasty guidewire. The OCT images were acquired during intracoronary contrast injection and automatic catheter pullback. After OCT imaging, PCI was performed with OCT guidance according to the following criteria for stent sizing and optimization.13–15 Proximal and distal reference sites adjacent to the lesion were determined at coronary segments with normal-looking lumen and no lipid-rich plaque were present. Stent diameter was determined to be 0–0.5 mm larger than distal reference lumen diameter. Stent length was determined by measuring the distance from the distal to proximal reference site. Post-dilatation was performed with the aim to achieve a stent expansion index (defined as the minimum stent area/average reference lumen area) >0.9 without major tissue protrusion and stent malapposition. An additional stent was used to treat major stent-edge dissection. Dual anti-platelet therapy with aspirin (100 mg/day), and prasugrel 3.75 mg/day or clopidogrel 75 mg/day was continued until the 10-month follow up. The 10-month follow-up coronary angiography and OCT were also carried out in the same manner.
Angiographic Analysis
Coronary angiograms before any intervention were evaluated using CAAS-5 (Pie Medical, Maastricht, The Netherlands) by 2 independent investigators (Y.S. and T.W.) who were blinded to the clinical information and OCT findings. Reference vessel diameter, minimum lumen diameter (MLD), percent diameter stenosis [(1 − MLD / reference lumen diameter) × 100], and lesion length were measured in the culprit lesion. Late lumen loss was defined as the difference between the MLD within the stent at post-stenting and at follow up. In-segment binary restenosis was defined as a percent diameter stenosis >50% in the stented segment plus the margins 5-mm proximal and distal to the stent at follow up. TLR was defined as either repeat percutaneous intervention of the target lesion or bypass surgery of the target vessel due to in-segment restenosis with the presence of symptoms or objective signs of ischemia.
OCT Analysis
OCT analysis was performed using dedicated off-line review systems (Abbott Vascular, Santa Clara, CA, USA or Terumo, Tokyo, Japan). The OCT images before and immediately after PCI were analyzed by 2 independent investigators (A.K. and T.K.) who were blinded to the clinical information and angiographic findings. The 10-month follow-up OCT images were analyzed by 2 independent investigators (M.T. and Y.I.) who were blinded to the clinical information, angiographic findings, and the OCT findings before and immediately after PCI. When there was any discordance between the observers, a consensus reading was obtained.
OCT images before PCI were analyzed using previously validated criteria for plaque characterization.6–8,14,16 Lipid was semi-quantified by measuring the lipid arc. When the lipid arc stretched for >90°, the plaque was deemed to be lipid-rich. Thin-cap fibroatheroma was defined as a plaque with a lipid arc >90°, with the thinnest fibrous cap thickness being <65 μm. PR was identified as fibrous cap disruption with a clear cavity formed inside the plaque; PE was defined as the presence of attached thrombus overlying an intact and visualized plaque, luminal surface irregularity at the culprit lesion in the absence of thrombus, or attenuation of underlying plaque by thrombus without superficial lipid or calcification immediately proximal or distal to the site of thrombus; and CN was defined as fibrous cap disruption detected over a calcified plaque characterized by protruding calcification, superficial calcium, and/or the presence of substantive calcium proximal and/or distal to the lesion.5–8 All cross-sectional frames were initially screened to assess quality. Inadequate images, including those of poor quality caused by residual blood or artifact; non-circumferential stent visualization caused by imaging wire bias; and bifurcations of side branches, were excluded from the analyses.3,11 The OCT analysis immediately after PCI included minimum lumen areas in the stent segment, minimum stent area, stent symmetry index (defined as minimum stent diameter divided by the maximum stent diameter at the minimum stent area site), and maximum malapposition area. Edge dissection was defined as disruption of the luminal vessel surface at the stent edges; stent malapposition as any strut with a distance between the center of the strut blooming and the adjacent vessel surface ≥110 mm (the criterion was determined by adding the actual strut thickness and polymer thickness to the OCT resolution limit [EES: 81 μm + 7.8 μm + 20 μm = 108.8 μm]); and tissue protrusion as tissue prolapse between adjacent stent struts towards the lumen.3,11,13–16
In 10-month follow-up OCT images, qualitative imaging assessment was performed at every frame to detect the presence of intra-stent thrombus and re-appearance of CN within the stent. Intra-stent thrombus was identified as a mass protruding into the lumen with significant attenuation behind the mass.3,11 Re-appearance of CN within the stent was defined as a high backscattering protruding mass with signal attenuation within the stent.10,17 Quantitative strut level analysis was performed at 1-mm intervals along the entire stented segment. Neointimal coverage was assessed on each individual strut. A malapposed strut was defined as above. Each stent strut condition was classified into 1 of 4 categories: (1) covered and apposed strut; well-apposed to the vessel wall with neointimal coverage on the strut; (2) covered and malapposed strut; incompletely apposed to the vessel wall with neointimal coverage; (3) uncovered and apposed strut; well-apposed to the vessel wall without neointimal coverage; and (4) uncovered and malapposed strut; incompletely apposed to the vessel wall without neointimal coverage.3,11 The maximum length of uncovered struts and malapposed struts was estimated as the number of consecutive frames with uncovered struts and malapposed struts. If uncovered struts (or malapposed struts) were observed separately within the same stent, the longer part was selected. Cross-sectional areas of the stent, lumen (defined as intra-stent lumen plus extra-stent lumen), neointima (defined as stent minus intra-stent lumen), and malapposition (defined as extra-stent lumen) were also measured at intervals of 1 mm within the entire stented segment.3,11 The volume was calculated with the use of the trapezoid rule.
Statistical Analysis
All statistical analysis was performed with the statistical software package, JMP 13.0 software (SAS Institute, Cary, NC, USA). Categorical variables were presented as number (%), and the comparisons were performed with the chi-squared or Fisher’s exact test (for an expected cell value <5). Continuous variables were presented as medians and interquartile ranges (IQRs) and were compared among PR, PE, and CN by using Kruskal-Wallis analysis using the Steel-Dwass test for multiple comparisons. All P values were 2-sided, and P<0.05 was considered statistically significant.
Results
Patient Clinical Characteristics
During the study period, we performed PCI for 386 patients with AMI. From these patients, we identified 308 (80%) patients who underwent PCI with OCT guidance. Of these, 85 patients were excluded from the analysis because of no OCT images before PCI (n=25), inadequate OCT images including massive thrombus that precludes visualization of underlying plaque (n=12), AMI due to stent thrombosis (n=9), coronary bypass graft failure (n=6), vasospasm (n=1), coronary embolization (n=3), spontaneous coronary artery dissection (n=2), or tight stenosis (n=2), no stent implantation (n=12), and other types of implanted stents (n=13). Furthermore, 82 patients were excluded because of subacute stent thrombosis (n=1), cardiac death (n=2), non-cardiac death (n=3) during the 10-month follow up, and no 10-month scheduled follow-up angiography and/or OCT (n=76). Thus, 141 patients constituted the final study population (Supplementary Figure). In the final study population, the frequency of PR, PE, and CN was 85 (60%), 45 (32%), and 11 patients (8%), respectively.
Patient clinical characteristics are shown in Table 1. Age and frequency of hypertension in patients with CN were not significantly but were numerically higher as compared with PR and PE. Hemodialysis was more often seen in patients with CN compared with PR and PE (P=0.024). Other coronary risk factors, frequency of ST-elevation acute myocardial infarction (STEMI), and the medications and laboratory data at follow up were not different among patients with PR, PE, and CN. Dual antiplatelet therapy was continued throughout the follow-up period in >93% of patients in all groups.
Table 1. Patient Clinical Characteristics
| |
PR
(n=85) |
PE
(n=45) |
CN
(n=11) |
P value |
| Age, years |
66 (60–74) |
65 (58–70) |
73 (61–80) |
0.322 |
| Male gender, n (%) |
71 (84) |
35 (78) |
7 (64) |
0.265 |
| Coronary risk factors, n (%) |
| Hypertension |
67 (79) |
39 (87) |
11 (100) |
0.155 |
| Dyslipidemia |
59 (69) |
32 (71) |
8 (73) |
0.962 |
| Diabetes mellitus |
35 (41) |
15 (33) |
5 (45) |
0.616 |
| Cigarette smoking |
35 (41) |
19 (42) |
3 (27) |
0.647 |
| Obesity |
24 (28) |
16 (36) |
2 (18) |
0.467 |
| Family history |
15 (18) |
12 (27) |
2 (18) |
0.471 |
| Hemodialysis |
2 (2) |
1 (2) |
2 (18) |
0.024 |
| Prior myocardial infarction |
7 (8) |
4 (9) |
1 (9) |
0.989 |
| Indication of index PCI, n (%) |
| STEMI/ NSTEMI |
60/25 (71/29) |
34/11 (76/24) |
8/3 (73/27) |
0.834 |
| Medications at follow up, n (%) |
| Aspirin |
83 (98) |
44 (98) |
11 (100) |
0.999 |
| Thienopiridine |
79 (93) |
43 (96) |
11 (100) |
0.853 |
| Statin |
76 (89) |
40 (89) |
10 (91) |
0.999 |
| ACEI/ARB |
62 (73) |
35 (78) |
10 (91) |
0.397 |
| β-blocker |
46 (54) |
25 (56) |
5 (45) |
0.832 |
| Laboratory data at follow up |
| Total cholesterol, mg/dL |
141 (129–159) |
148 (125–166) |
140 (122–152) |
0.564 |
| LDL-cholesterol, mg/dL |
70 (63–88) |
70 (62–89) |
69 (62–82) |
0.887 |
| HDL-cholesterol, mg/dL |
41 (35–49) |
44 (36–50) |
46 (41–50) |
0.377 |
| Triglyceride, mg/dL |
116 (86–172) |
97 (81–136) |
105 (65–145) |
0.158 |
| Fasting glucose, mg/dL |
117 (103–150) |
110 (99–118) |
120 (102–145) |
0.101 |
| HbA1C, % |
5.7 (5.4–6.8) |
5.7 (5.2–6.5) |
6.1 (5.4–6.3) |
0.570 |
| hs-CRP, mg/L |
0.08 (0.04–0.13) |
0.06 (0.03–0.11) |
0.03 (0.02–0.20) |
0.524 |
| Time from stent implantation to follow-up OCT |
10 (10–11) |
10 (10–11) |
10 (9–10) |
0.247 |
Data are presented as n (%) or median (interquartile range). ACEI/ARB, angiotensin-converting enzyme inhibitor/angiotensin II receptor blocker; CN, calcified nodule; HbA1C, hemoglobin A1C; HDL, high-density lipoprotein; hs-CPR, high sensitive C-reactive protein; LDL, low-density lipoprotein; NSTEMI, non-ST-segment elevation myocardial infarction; OCT, optical coherence tomography; PCI, percutaneous coronary intervention; PE, plaque erosion; PR, plaque rupture.
Angiographic findings and procedural characteristics are shown in Table 2. Maximal pressure tended to be higher in patients with CN compared with PR and PE. Post-intervention percent diameter stenosis was significantly smallest in patients with CN. Other angiographic findings at pre- and post-intervention, and 10-month follow up, and procedures including stent size were not different among patients with PR, PE, and CN. Although the in-stent restenosis rate was not different (P=0.231), the rate of in-segment binary restenosis and TLR were higher in patients with CN compared with PR and PE (27% vs. 2% vs. 2%, P<0.001 and 18% vs. 2% vs. 2%, P=0.024, respectively). TLR was performed in 5 patients, consisting of 3 patients with in-stent restenosis and 2 patients with margin restenosis.
Table 2. Angiographic Findings and Procedural Characteristics
| |
PR
(n=85) |
PE
(n=45) |
CN
(n=11) |
P value |
| Pre-intervention |
| LAD/LCX/RCA |
38/17/30 |
30/5/10 |
6/2/3 |
0.208 |
| TIMI flow grade 0 or 1 |
62 (73) |
32 (71) |
7 (64) |
0.809 |
| Reference vessel diameter, mm |
2.75 (2.45–3.25) |
2.72 (2.40–3.02) |
2.75 (2.45–3.28) |
0.730 |
| Minimum lumen diameter, mm |
0.30 (0–0.62) |
0.31 (0–0.64) |
0.25 (0–0.64) |
0.833 |
| Percent diameter stenosis, % |
92 (76–100) |
90 (74–100) |
91 (81–100) |
0.699 |
| Lesion length, mm |
14 (11–19) |
14 (12–19) |
13 (10–18) |
0.644 |
| Stents and procedures |
| Number of stents per lesion, n |
1 (1–1) |
1 (1–1) |
1 (1–1) |
0.278 |
| Stent diameter, mm |
3 (3–3.5) |
3 (2.5–3.5) |
3 (3–3.5) |
0.461 |
| Stent length, mm |
23 (15–28) |
23 (18–28) |
23 (18–23) |
0.978 |
| Stent-to-artery ratio |
1.08 (1.04–1.20) |
1.08 (1.03–1.22) |
1.13 (1.08–1.27) |
0.133 |
| Maximal pressure, atm |
16 (14–18) |
16 (12–18) |
18 (16–20) |
0.158 |
| Thrombectomy, n (%) |
45 (53) |
20 (44) |
3 (27) |
0.229 |
| Post-intervention |
| Minimum lumen diameter, mm |
2.80 (2.51–3.20) |
2.70 (2.44–3.06) |
2.61 (2.55–2.93) |
0.188 |
| Percent diameter stenosis, % |
5 (3–7) |
5 (2–9) |
9 (6–10) |
0.009 |
| 10-month follow up |
| Minimum lumen diameter, mm |
2.68 (2.27–3.05) |
2.48 (2.21–2.86) |
2.45 (2.38–2.65) |
0.155 |
| Percent diameter stenosis, % |
10 (6–13) |
9 (5–15) |
11 (10–14) |
0.180 |
| In-stent late loss, mm |
0.14 (0.06–0.18) |
0.11 (0.05–0.17) |
0.15 (0.10–0.18) |
0.355 |
| In-segment binary restenosis, n (%) |
2 (2) |
1 (2) |
3 (27) |
<0.001 |
| In-stent restenosis, n (%) |
1 (1) |
1 (2) |
1 (9) |
0.231 |
| Proximal margin, n (%) |
0 (0) |
0 (0) |
1 (9) |
0.003 |
| Distal margin, n (%) |
1 (1) |
0 (0) |
1 (9) |
0.070 |
| Target lesion revascularization, n (%) |
2 (2) |
1 (2) |
2 (18) |
0.024 |
| Repeat percutaneous intervention, n (%) |
2 (2) |
1 (2) |
1 (9) |
0.429 |
| Bypass surgery, n (%) |
0 (0) |
0 (0) |
1 (9) |
0.003 |
Data are presented as n (%) or median (interquartile range). LAD, left anterior descending artery; LCX, left circumflex artery; RCA, right coronary artery; TIMI, Thrombolysis in Myocardial Infarction; other abbreviations as per Table 1.
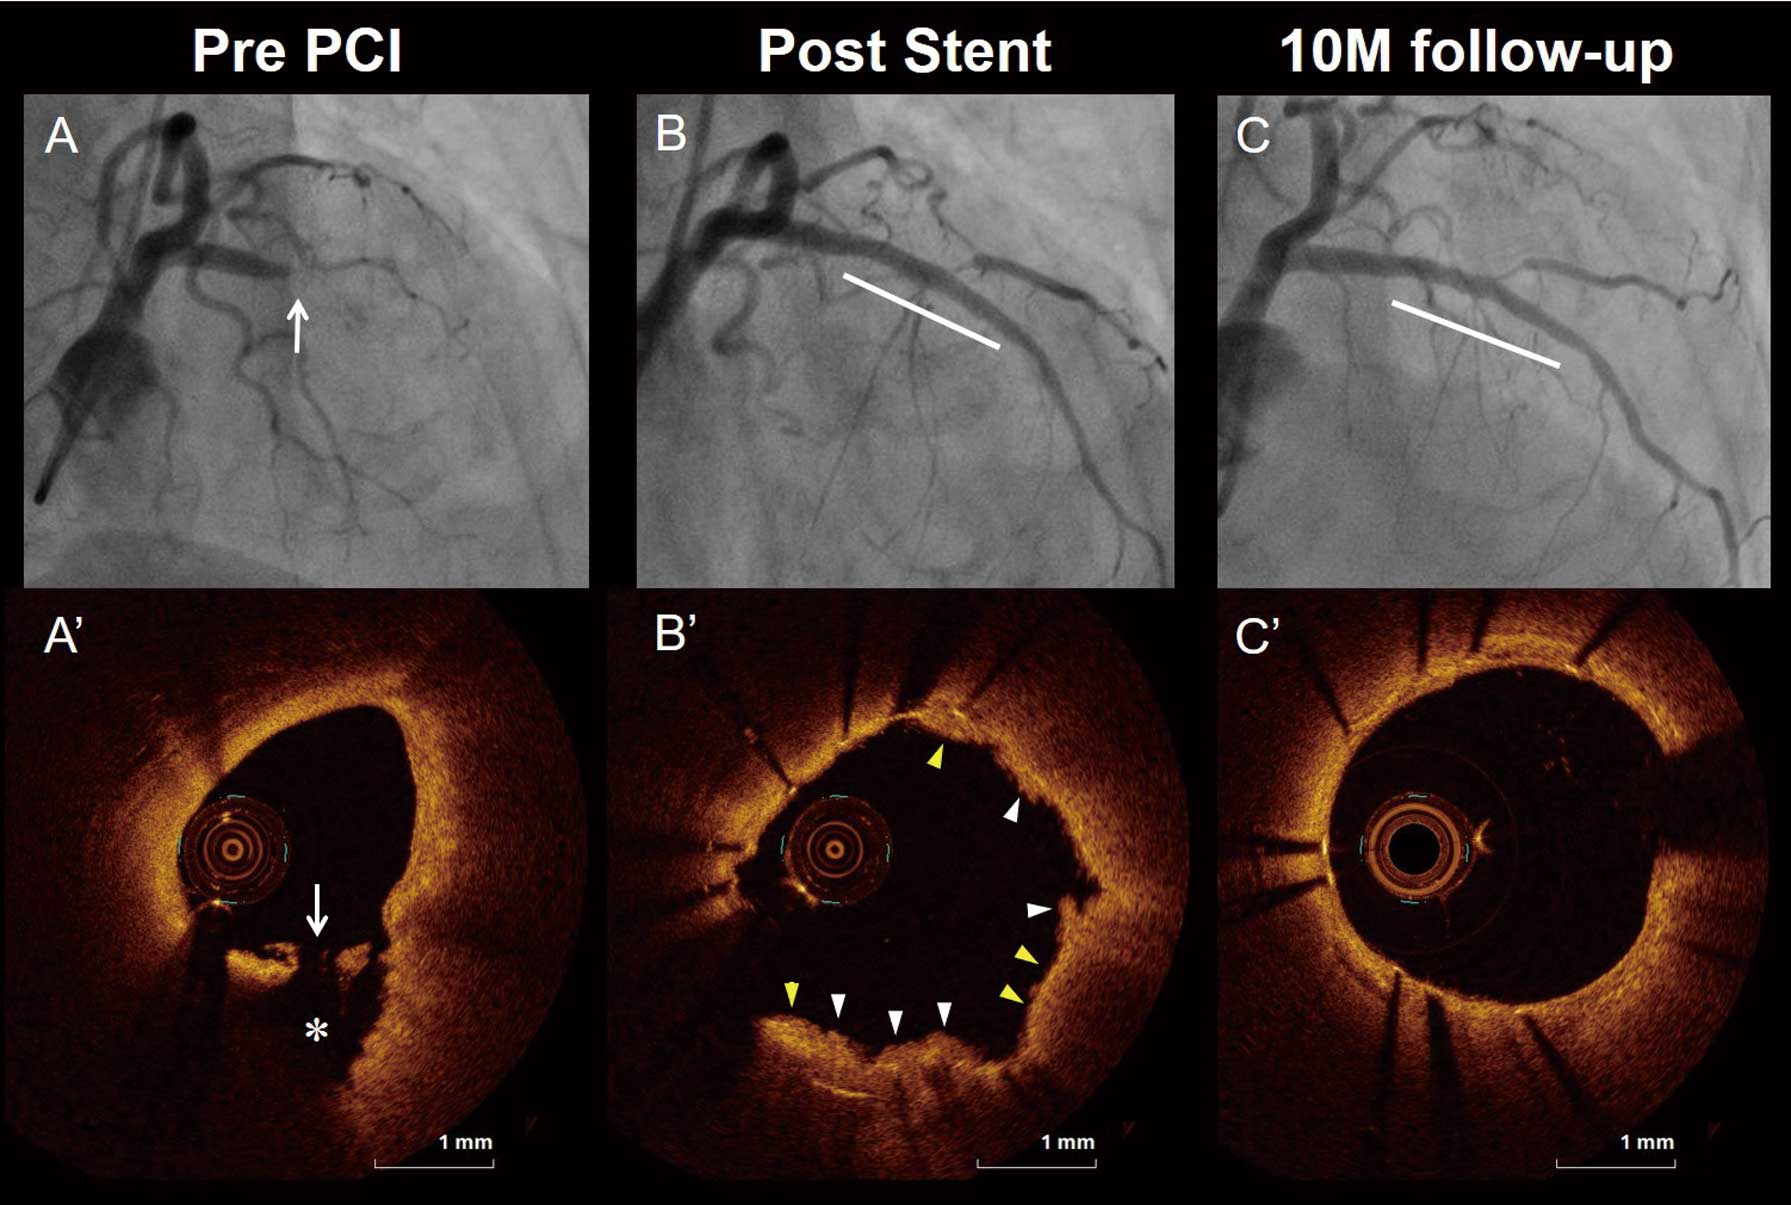
We analyzed a total of 3,014 frames with 30,958 struts. Representative OCT images after EES implantation for patients with PR, PE, and CN are shown in Figures 1–3, respectively. The OCT findings before and immediately after PCI are shown in Supplementary Table 1. The frequency of lipidic rich plaque and thin-cap fibroatheroma were significantly higher, fibrous cap thickness was thinner, and lipid arc was greater in patients with PR compared with PE and CN. The frequency of calcification was significantly higher in patients with CN compared with PR and PE. The incidence of tissue protrusion and irregular tissue protrusion were significantly higher (99% vs. 91% vs. 82%, P=0.015 and 82% vs. 49% vs. 45%, P<0.001, respectively), and maximum tissue protrusion area and tissue protrusion volume were significantly larger in patients with PR compared with PE and CN. The incidence of malapposition was significantly higher (73% vs. 42% vs. 27%, P=0.015), and maximum malapposition area and malapposition volume were significantly larger in patients with CN compared with PR and PE. Minimum stent area and stent symmetry index tended to be smaller in patients with CN compared with PR and PE (5.02 mm2
[IQR: 4.10–6.48] vs. 6.26 mm2
[IQR: 4.59–7.67] vs. 5.24 mm2
[IQR: 3.94–7.01], P=0.070 and 0.81 [IQR: 0.70–0.88] vs. 0.86 [IQR: 0.81–0.90] vs. 0.87 [IQR: 0.84–0.89], P=0.062, respectively).


The OCT findings at the 10-month follow up are shown in Table 3 and Supplementary Table 2. In the stent-treated lesion level analysis, the percentage of uncovered struts and percentage of malapposed struts were highest in patients with CN, followed by PR and PE (10.9% [IQR: 3.6–25.9] vs. 0.4% [IQR: 0–3.5] vs. 0% [IQR: 0–2.0], P<0.001 and 2.2% [IQR: 0–3.6] vs. 0% [IQR: 0–0.5] vs. 0% [IQR: 0–0], P<0.001, respectively). The frequency of lesions with any uncovered struts and lesions with any malapposed struts were highest in patients with CN, followed by PR and PE (82% vs. 52% vs. 40%, P=0.042 and 73% vs. 26% vs. 16%, P<0.001, respectively). The maximum length of uncovered struts and that of malapposed struts were longest in patients with CN, followed by PR and PE (2 mm [IQR: 1–9] vs. 0 mm [IQR: 0–2] vs. 0 mm [IQR: 0–1], P=0.005 and 2 mm [IQR: 1–2] vs. 0 mm [IQR: 0–1] vs. 0 mm [IQR: 0–0], P<0.001, respectively). The incidence of intra-stent thrombus and re-appearance of CN within the stent were higher in patients with CN compared with PR and PE (36% vs. 9% vs. 7%, P=0.028 and 27% vs. 0% vs. 0%, P<0.001, respectively; Figure 4). In the morphometric analysis, the maximum malapposition area and malapposition volume were larger in patients with CN compared with PR and PE (0.26 mm2
[IQR: 0.13–1.06] vs. 0 mm2
[IQR: 0–0.13] vs. 0 mm2
[IQR: 0–0], P<0.001 and 0.71 mm3
[IQR: 0.19–1.50] vs. 0 mm3
[IQR: 0–0.14] vs. 0 mm3
[IQR: 0–0], P<0.001, respectively).
Table 3. OCT Findings at 10-Month Follow up
| |
PR
(n=85) |
PE
(n=45) |
CN
(n=11) |
P value |
P value |
PR vs.
PE |
PE vs.
CN |
PR vs.
CN |
| Stent-treated lesion level analysis |
Length of the stented segment
measured with OCT, mm |
22
(15–27) |
22
(18–27) |
23
(18–23) |
0.789 |
N/A |
N/A |
N/A |
| Number of stent struts per lesion, n |
207
(169–254) |
226
(155–262) |
252
(202–278) |
0.286 |
N/A |
N/A |
N/A |
| Stent strut condition |
| Uncovered struts, % |
0.4
(0–3.7) |
0
(0–2.0) |
3.9
(1.9–25.9) |
0.006 |
0.466 |
0.005 |
0.020 |
| Malapposed struts, % |
0
(0–0.5) |
0
(0–0) |
1.8
(0–3.6) |
<0.001 |
0.339 |
<0.001 |
0.003 |
Lesion with any uncovered struts,
n (%) |
44
(52) |
18
(40) |
9
(82) |
0.042 |
0.201 |
0.013 |
0.059 |
Lesion with any malapposed struts,
n (%) |
22
(26) |
7
(16) |
8
(73) |
<0.001 |
0.179 |
<0.001 |
0.002 |
Maximum length of uncovered
struts, mm |
0
(0–2) |
0
(0–1) |
2
(1–9) |
0.005 |
0.299 |
0.004 |
0.029 |
Maximum length of malapposed
struts, mm |
0
(0–1) |
0
(0–0) |
2
(1–2) |
<0.001 |
0.410 |
<0.001 |
0.001 |
| Morphometric analysis |
| Minimum stent area, mm2 |
6.25
(4.81–7.59) |
5.49
(4.01–7.15) |
5.16
(4.16–6.46) |
0.147 |
N/A |
N/A |
N/A |
| Maximum neointimal area, mm2 |
1.57
(1.00–2.29) |
1.35
(1.02–2.11) |
0.93
(0.58–1.90) |
0.139 |
N/A |
N/A |
N/A |
| Minimum lumen area, mm2 |
5.19
(3.60–6.82) |
4.48
(3.74–6.41) |
4.45
(3.70–5.44) |
0.532 |
N/A |
N/A |
N/A |
| Maximum malapposition area, mm2 |
0
(0–0.13) |
0
(0–0) |
0.26
(0.13–1.06) |
<0.001 |
0.410 |
<0.001 |
0.001 |
| Malapposition volume, mm3 |
0
(0–0.14) |
0
(0–0) |
0.71
(0.19–1.50) |
<0.001 |
0.518 |
<0.001 |
<0.001 |
Data are presented as n (%) or median (interquartile range). N/A, not applicable; other abbreviations as per Table 1.

Discussion
The main findings of the present study were as follows: (1) the incidence of malapposition immediately after PCI was higher in patients with CN compared with PR and PE; (2) at the 10-month follow-up OCT, the percentage of uncovered struts and malapposed struts were highest in patients with CN, followed by PR and PE; (3) the maximum malapposition area and malapposition volume were larger in patients with CN compared with PR and PE; and (4) the incidence of intra-stent thrombus, re-appearance of CN within the stent, and TLR were higher in patients with CN compared with PR and PE. To the best of our knowledge, this is the first study that demonstrates the most unfavorable late vascular response, such as higher incidence of uncovered struts, malapposed struts, and intra-stent thrombus, using OCT at 10 months after EES implantation in AMI patients due to CN.
Vascular Response After DES Implantation in CN
Calcified nodules are pathologically defined as the presence of a fracture of a calcified plaque, interspersed fibrin and a disrupted fibrous cap with an overlying thrombus. These disrupted eruptive calcified nodules are usually eccentric, protruding into the lumen, and there is no endothelium and collagen above the nodules of calcium with intraluminal thrombus.4 A recent pathological study demonstrated that severe calcification of a stented lesion causes delayed healing due to a lack of smooth muscle cells and loss of endothelial cells from destruction during the process of ballooning and stenting.18 Furthermore, the luminal surface of a calcified area being in direct contact with a stent strut and stent malapposition are independent predictors of uncovered struts at the late phase.18 One autopsy case report that used ex vivo intravascular imaging including OCT showed an unfavorable late vascular response after second generation DES implantation for CN, including minimal neointimal coverage with loose extracellular matrix and no endothelial cells.10 These are consistent with the results of the present study. Furthermore, the frequency of intra-stent thrombus at the late phase was highest in patients with CN, and this is associated with stent uncoverage and malapposition due to delayed healing.
Re-Appearance of CN Within the Stent
A recent OCT study reported that CN was frequently observed in calcified tortuous lesions, where the torsion stress is maximal. The mechanical stress may be associated with the development of eruptive CN.19,20 As this was an observational study using OCT without validation of histopathological findings, the precise mechanism of CN re-appearance within the stent is uncertain. The first possible mechanism is the protrusion of a CN followed by calcifying fibrin thrombus after stent implantation in the early phase.21 The second possible mechanism is the deposition of fragments of calcification and fibrin caused by mechanical destruction of sheet calcification at the time of stent implantation in the mid-phase.21 The third possible mechanism is the appearance of de novo CN within the neointima that protrudes into the lumen in the late phase, which is very rare.21 The present study found only 3 cases of CN re-appearance within the stent; therefore, in order to clarify the mechanism of CN re-appearance, the larger clinical trials are required.
Appropriate Treatment of CN
The present study demonstrated that the frequency of uncovered struts, malapposed struts, and re-appearance of CN within the stent at a late phase was higher in patients with CN compared to PR or PE. This might be associated with the higher incidence of major adverse cardiac events, including TLR and re-myocardial infarction in CN lesions.8,9 The use of a debulking technique such as rotational/orbital atherectomy and excimer laser coronary angioplasty before stent implantation and post dilatation with non-compliant or a larger balloon with OCT guidance could decrease the incidence of malapposition immediately after PCI. Furthermore, a non-stent strategy after the use of a debulking technique may be one alternative treatment strategy for patients with CN.22
Study Limitations
The present study has several limitations. First, this was a retrospective study at a single institution with a relatively small sample size, especially in terms of CN patients (only 11 patients). Second, although OCT-guided PCI was performed in 308 of 386 patients (80%), scheduled follow-up angiography and OCT was only performed in 141 of 223 patients (63%) during the study period; therefore, the existence of selection bias cannot be completely excluded. Third, the prevalence of PR is lower in patients with STEMI (60/102, 58.8%) than in those with NSTEMI (25/39, 64%), which is not consistent with previous studies using OCT. In the present study, 10 STEMI patients with massive thrombus that precluded visualization of underlying plaque were excluded. The etiology in most of these 10 STEMI patients might be plaque rupture, because a previous OCT study demonstrated that thrombus volume was significantly larger in patients with PR compared with PE.23 The inconsistency may be attributable to the potential selection bias for this study and/or exclusion of STEMI patients with PR due to massive thrombus. Forth, in patient with TIMI flow grade ≤2, balloon angioplasty with a small balloon of ≤2.0 mm in diameter was allowed prior to OCT imaging; therefore, some patients with tight stenosis and thrombus might be diagnosed as having PE if fibrous cap disruption or superficial calcification was not observed in OCT images after small balloon angioplasty. Finally, this study was not designed to assess the relationship between the unfavorable late vascular response, as determined by the follow-up OCT examination, and future development of stent thrombosis or restenosis. Further studies are required to clarify clinical implications of OCT findings at 10 months after stent implantation.
Conclusions
Late phase vascular response after EES implantation was different among patients with PR, PE, and CN. The unfavorable late phase vascular response such as uncovered struts, malapposed struts, intra-stent thrombus, and re-appearance of CN within the stent, was more often seen in patients with CN compared with PR and PE. The plaque morphology in AMI culprit lesions might affect the late phase vascular response after EES implantation.
Acknowledgments
The authors thank their colleagues who helped with this study.
Sources of Funding
This study did not receive any specific funding.
Disclosures
The authors have no conflicts of interest to declare.
IRB Information
This study was approved by the Ethics Committee of Wakayama Medical University (Reference no. 2994).
Data Availability
The deidentified participant data will not be shared.
Supplementary Files
Please find supplementary file(s);
http://dx.doi.org/10.1253/circj.CJ-21-1059
References
- 1.
Sabate M, Cequier A, Iñiguez A, Serra A, Hernandez-Antolin R, Mainar V, et al. Everolimus-eluting stent versus bare-metal stent in ST-segment elevation myocardial infarction (EXAMINATION): 1 year results of a randomised controlled trial. Lancet 2012; 380: 1482–1490.
- 2.
Hofma SH, Brouwer J, Velders MA, van’t Hof AW, Smits PC, Queré M, et al. Second-generation everolimus-eluting stents versus first-generation sirolimus-eluting stents in acute myocardial infarction: 1-year results of the randomized XAMI (XienceV Stent vs. Cypher Stent in Primary PCI for Acute Myocardial Infarction) trial. J Am Coll Cardiol 2012; 60: 381–387.
- 3.
Sawada T, Shinke T, Otake H, Mizoguchi T, Iwasaki M, Emoto T, et al. Comparisons of detailed arterial healing response at seven months following implantation of an everolimus- or sirolimus-eluting stent in patients with ST-segment elevation myocardial infarction. Int J Cardiol 2013; 168: 960–966.
- 4.
Virmani R, Kolodgie FD, Burke AP, Farb A, Schwartz SM. Lessons from sudden coronary death: A comprehensive morphological classification scheme for atherosclerotic lesions. Arterioscler Thromb Vasc Biol 2000; 20: 1262–1275.
- 5.
Khalifa AKM, Kubo T, Ino Y, Terada K, Emori H, Higashioka D, et al. Optical coherence tomography comparison of percutaneous coronary intervention among plaque rupture, erosion, and calcified nodule in acute myocardial infarction. Circ J 2020; 84: 911–916.
- 6.
Takahata M, Ino Y, Kubo T, Tanimoto T, Taruya A, Terada K, et al. Prevalence, features, and prognosis of artery-to-artery embolic ST-segment-elevation myocardial infarction: An optical coherence tomography study. J Am Heart Assoc 2020; 9: e017661.
- 7.
Wang Y, Fang C, Zhang S, Li L, Wang J, Yin Y, et al. Predictors of coronary plaque erosion in current and non-current smokers with ST-segment elevation myocardial infarction: An optical coherence tomography study. Circ J 2021; 85: 1814–1822.
- 8.
Kobayashi N, Takano M, Tsurumi M, Shibata Y, Nishigoori S, Uchiyama S, et al. Features and outcomes of patients with calcified nodules at culprit lesions of acute coronary syndrome: An optical coherence tomography study. Cardiology 2018; 139: 90–100.
- 9.
Sugane H, Kataoka Y, Otsuka F, Nakaoku Y, Nishimura K, Nakano H, et al. Cardiac outcomes in patients with acute coronary syndrome attributable to calcified nodule. Atherosclerosis 2021; 318: 70–75.
- 10.
Kawakami R, Hao H, Takagi Y, Fujino A, Tsuchida YA, Imanaka T, et al. Drug-eluting stent implantation on calcified nodule: Ex vivo intravascular images and histopathology. JACC Cardiovasc Interv 2015; 8: e127–e128.
- 11.
Ino Y, Kubo T, Tanaka A, Liu Y, Tanimoto T, Kitabata H, et al. Comparison of vascular response between everolimus-eluting stent and bare metal stent implantation in ST-segment elevation myocardial infarction assessed by optical coherence tomography. Eur Heart J Cardiovasc Imaging 2015; 16: 513–520.
- 12.
Hartikainen TS, Sörensen NA, Haller PM, Goßling A, Lehmacher J, Zeller T, et al. Clinical application of the 4th Universal Definition of Myocardial Infarction. Eur Heart J 2020; 41: 2209–2216.
- 13.
Kubo T, Shinke T, Okamura T, Hibi K, Nakazawa G, Morino Y, et al; OPINION Investigators. Optical frequency domain imaging vs. intravascular ultrasound in percutaneous coronary intervention (OPINION trial): One-year angiographic and clinical results. Eur Heart J 2017; 38: 3139–3147.
- 14.
Ino Y, Kubo T, Matsuo Y, Yamaguchi T, Shiono Y, Shimamura K, et al. Optical coherence tomography predictors for edge restenosis after everolimus-eluting stent implantation. Circ Cardiovasc Interv 2016; 9: e004231.
- 15.
Ando H, Nakano Y, Sawada H, Ohashi H, Takashima H, Suzuki A, et al. Diagnostic performance of high-resolution intravascular ultrasound for abnormal post-stent findings after stent implantation: A comparison study between high-resolution intravascular ultrasound and optical coherence tomography. Circ J 2021; 85: 883–890.
- 16.
Fujii K, Kubo T, Otake H, Nakazawa G, Sonoda S, Hibi K, et al. Expert consensus statement for quantitative measurement and morphological assessment of optical coherence tomography. Cardiovasc Interv Ther 2020; 35: 13–18.
- 17.
Kawakami R, Imanaka T, Ishihara M, Kihara T, Fujii K, Hirota S, et al. Protruding in-stent mass after bioresorbable polymer sirolimus-eluting stent: Ex vivo intravascular imaging and histopathology. Circ J 2018; 82: 932–933.
- 18.
Torii S, Jinnouchi H, Sakamoto A, Mori H, Park J, Amoa FC, et al. Vascular responses to coronary calcification following implantation of newer-generation drug-eluting stents in humans: Impact on healing. Eur Heart J 2020; 41: 786–796.
- 19.
Lee T, Mintz GS, Matsumura M, Zhang W, Cao Y, Usui E, et al. Prevalence, predictors, and clinical presentation of a calcified nodule as assessed by optical coherence tomography. JACC Cardiovasc Imaging 2017; 10: 883–891.
- 20.
Otake H, Hamana T. Calcified plaques in the human coronary artery: Each calcified plaque is never the same. Circ J 2021; 85: 2029–2031.
- 21.
Nakamura N, Torii S, Tsuchiya H, Nakano A, Oikawa Y, Yajima J, et al. Formation of calcified nodule as a cause of early in-stent restenosis in patients undergoing dialysis. Calcified nodule: An early and late cause of in-stent failure. J Am Heart Assoc 2020; 9: e016595.
- 22.
Iwai S, Watanabe M, Okamura A, Kyodo A, Nogi K, Kamon D, et al. Prognostic impact of calcified plaque morphology after drug eluting stent implantation: An optical coherence tomography study. Circ J 2021; 85: 2019–2028.
- 23.
Saia F, Komukai K, Capodanno D, Sirbu V, Musumeci G, Boccuzzi G, et al. Eroded versus ruptured plaques at the culprit site of STEMI: In vivo pathophysiological features and response to primary PCI. JACC Cardiovasc Imaging 2015; 8: 566–575.
