Nomogram Including Serum Ion Concentrations to Screen for New-Onset Hypertension in Rural Chinese Populations Over a Short-Term Follow-up
論文ID: CJ-22-0016
この記事には本公開記事があります。

詳細
論文ID: CJ-22-0016
Background: This study aimed to establish a clinically useful nomogram to evaluate the probability of hypertension onset in the Chinese population.
Methods and Results: A prospective cohort study was conducted in 2012–2013 and followed up in 2015 to identify new-onset hypertension in 4,123 participants. The dataset was divided into development (n=2,748) and verification (n=1,375) cohorts. After screening risk factors by lasso regression, a multivariate Cox regression risk model and nomogram were established. Among the 4,123 participants, 818 (19.8%) developed hypertension. The model identified 10 risk factors: age, waist-to-hip ratio, systolic blood pressure, diastolic blood pressure, high pulse rate, history of diabetes, family history of hypertension and stroke, intake frequency of bean products, and intensity of physical labor. The C-indices of the model in the development and validation cohorts were 0.744 and 0.768, respectively. After the inclusion of serum calcium and magnesium concentrations, the C-indices in the development and validation cohorts were 0.764 and 0.791, respectively, with areas under the curve for the updated model of 0.907 and 0.917, respectively. The calibration curve showed that the nomogram accurately predicted the probability of hypertension. The updated nomogram was clinically beneficial across thresholds of 10–60%.
Conclusions: The newly developed nomogram has good predictive ability and may effectively assess hypertension risk in high-risk rural areas in China.
Hypertension is an independent risk factor for cardiovascular events and a major modifiable risk factor for cardiovascular disease and premature death.1 Current estimates suggest that there are 435.3 million people with prehypertension worldwide, accounting for 41.3% of the population aged >18 years. The prevalence rates of (especially hemorrhagic) stroke and non-ischemic heart failure are higher in the East Asian than Western hypertensive population.2 However, high blood pressure is more harmful to health in East Asia, where blood pressure shows seasonal and temperature-dependent changes.3 The high incidence of hypertension in the East Asian population means that this condition also affects low-income areas.4 In China, the economically underdeveloped Liaoning Province in northeast China has the highest prevalence of hypertension,5 adhering to the general trend of high rates of hypertension in the north of China and lower rates in the south.6 In the rural areas of Liaoning Province, treatment compliance and disease awareness are relatively poor, and this population needs more attention.4 However, containment of the high-risk hypertensive population is expected to solve the problem of uncontrolled hypertension in China. Increasing evidence shows that early identification of potential high-risk groups may effectively improve the cardiovascular health of low-income populations.7 Due to the low levels of economic and social development in Liaoning Province, the high-salt diet of the population, the long snow periods, and the cold and arid climate in rural Liaoning, predictors of hypertension and incidence prediction models may differ for this population. Furthermore, to the best of our knowledge, there is no hypertension model based on prospective cohorts of individuals of Han Chinese origin.
Editorial p ????
The aims of this study were to establish and verify a nomogram model for the risk prediction of hypertension in rural Liaoning, China. The success or failure of hypertension control in rural areas of Liaoning Province may be related to the success or failure of hypertension control in China. Regarding the focus on hypertension control, a simple and feasible incidence model is needed to predict the incidence of hypertension and pay more attention to the potential hypertensive population so that mortality and disability rates due to hypertension can be reduced. This incidence model may improve the chances of preventing primary hypertension in China.
The Northeast China Rural Cardiovascular Health Study is a prospective cohort study that has been conducted in rural areas of northeast China since 2012. A multistage, random-stratified cluster sampling scheme was used to select Dawa, Zhangwu, and Liaoyang counties in Liaoning Province for inclusion in the study. The baseline study, conducted between 2012 and 2013, recruited 11,956 participants aged ≥35 years. All participants were invited to take part in the follow-up study in 2015. Of the original 11,956 participants, 1,256 refused, another 884 were lost to follow-up, and 48 participants had died between the baseline and follow-up studies. Participants with hypertension (n=5,548) or no blood pressure value (n=97) at baseline were excluded from the follow-up study. The remaining 4,123 participants were divided in 2 : 1 into a development set for model construction (n=2,748) and a validation set for model verification (n=1,375; Supplementary Figure 1).
The procedures followed in this study were performed in accordance with the tenets of Declaration of Helsinki. The Ethics Committee of China Medical University (Shenyang, China AF-SDP-7-1, 0-01) approved the study protocol. Written informed consent was obtained from all participants (or their parents or legal guardians).
Study VariablesThe models in this study were established, validated, and updated in accordance with the Transparent Reporting of a multivariable prediction model for Individual Prognosis or Diagnosis (TRIPOD) statement.8 Detailed information on demographic characteristics, family socioeconomic status, lifestyle factors, medical history, and medication history was obtained using standardized questionnaires. Blood pressure was measured 3 times on different days using a standardized method and an automated sphygmomanometer (HEM-907; Omron, Tokyo, Japan). The participants wore light clothes and were barefoot when their weight and height were measured. Fasting blood samples were collected after fasting for at least 12 h to measure blood lipid levels, serum creatinine levels, blood electrolytes, and other routine blood biochemical indices (Olympus AU640; Olympus, Tokyo, Japan). The physical examinations performed and detailed data collection methods have been described elsewhere.9
Parameter DefinitionsHypertension was defined as systolic blood pressure (SBP) ≥140 mmHg or diastolic blood pressure (DBP) ≥90 mmHg or antihypertensive drugs taken within 2 weeks or as diagnosed by a doctor during a hospital examination. Diabetes was defined as fasting blood glucose ≥7.0 mmol/L or previous diagnosis by a physician.10 Physical labor intensity, defined as the intensity of agricultural occupational physical activity, was divided into 3 groups (light, moderate, and heavy). Current smoking was defined as the smoking of at least 1 cigarette per day, and current drinking was defined as any alcohol intake at least once a week, as proposed previously.6 Dyslipidemia was diagnosed according to the National Cholesterol Education Program’s Adult Treatment Panel III as total cholesterol ≥6.21 mmol/L, triglyceride ≥2.26 mmol/L, low-density lipoprotein ≥4.16 mmol/L (high), and high-density lipoprotein ≤1.03 mmol/L (low).11 The Chronic Kidney Disease Epidemiology Collaboration equation was used to calculate the estimated glomerular filtration rate.12
To facilitate application of the nomogram, all continuous variables were converted into categorical variables according to conventional clinical boundaries or previous data mining. The cut-off values for aspartate aminotransferase and alanine aminotransferase were 35 and 40 U/L, respectively. A high waist-to-hip ratio (WHR) was defined as ≥0.90 in men and ≥0.80 in women.13 Body mass index (BMI) was calculated as weight (kg) divided by height squared (m2) and subsequently categorized as low (<18.5 kg/m2), normal (18.5–23.9 kg/m2); overweight (24.0–27.9 kg/m2), or obese (≥28 kg/m2) according to the criteria of the Working Group on Obesity in China.14 Uric acid levels >420 µmol/L were defined as high. Hemoglobin <110 g/L was taken to indicate anemia. Low serum calcium, phosphorus, magnesium, potassium, sodium, and chlorine concentrations were defined as values below 2.25, 0.97, 0.87, 5.0, 145, and 105 mmol/L, respectively. High white blood cell and platelet counts were defined as values exceeding 10×109 and 350×109/L, respectively. All new-onset hypertension events were adjudicated by the endpoint evaluation committee.
Statistical AnalysisNormally distributed continuous variables are presented as the mean±SD, whereas categorical variables are presented as n (%). The significance of differences between groups were examined using Student’s t-test and the Chi-squared test, as appropriate. The Shapiro-Wilk and Kolmogorov-Smirnov tests were used to test the normality of the datasets.
Variables used to create the nomograms were screened using a 2-step method. First, the risk factors of hypertension were screened according to the results of the single-factor Cox proportional hazards regression model. The screening standard was P<0.20 (Wald χ2). After the preliminary screening, the least absolute shrinkage and selection operator (lasso) method was used to further screen the candidate variables, reduce dimensionality, optimize the model, and prevent model overfitting. Bootstrapping internal verification of the nomogram model was conducted using the repeated sampling method. Internal validation indicators included the C-index and calibration, which represent prediction accuracy and prediction consistency of the nomogram model, respectively. The calibration was represented using a calibration plot. The area under the receiver operating characteristic curve (AUC) was calculated as a supplementary index for prediction accuracy. SPSS (version 23.0; IBM, Chicago, IL, USA) was used to fill the missing data based on a multiple interpolation method.
The main statistical analysis software used in this study was R version 3.6.3 (R Foundation for Statistical Computing, Vienna, Austria). The following packages were used: “glmnet”, “rms”, “pROC”, “nricens”, “PredictABEL”, “rmda”, and “DynNom”. The performance of the nomograms was compared by calculating category-free net reclassification improvement (NRI) and integrated discrimination improvement (IDI). The IDI value was determined according to the formula, IDI = mean (IDI event) − mean (IDI non-event), and the P value was calculated using the Z-test. Decision curve analysis (DCA) was performed using Stdca. All tests were 2-sided, and statistical significance was set at P<0.05.
Baseline characteristics of the participants in the development and validation cohorts are presented in Table 1. The mean age of the participants in the development and validation cohorts was 50.22±9.35 and 50.06±9.57 years, respectively (P=0.88). The development cohort included 1,174 (57.3%) men and 1,574 (42.5%) women. The mean baseline SBP and DBP of the development cohort were 124.17±9.35 and 74.96±7.17 mmHg, respectively, compared with 124.35±9.74 mmHg (P=0.58) and 75.09±7.39 mmHg (P=0.58), respectively, in the validation cohort. The consumption of lard (fat pork refined into oil) in the development cohort was higher than in the validation cohort (61.2% vs. 42.3%, respectively; P=0.03). There were no significant differences between the 2 groups in other baseline characteristics.
| Development cohort | Validation cohort | P value | |
|---|---|---|---|
| No. participants | 2,748 | 1,375 | |
| Age (years) | 50.22±9.35 | 50.06±9.57 | 0.61 |
| Age groups (years) | |||
| 35–44 | 939 (34.2) | 484 (35.2) | 0.88 |
| 45–54 | 982 (35.7) | 474 (34.5) | |
| 55–64 | 629 (22.9) | 316 (23) | |
| 65–74 | 169 (6.1) | 89 (6.5) | |
| ≥75 | 29 (1.1) | 12 (0.9) | |
| Sex | 0.20 | ||
| Male | 1,174 (42.7) | 616 (44.8) | |
| Female | 1,574 (57.3) | 759 (55.2) | |
| Current smoking | 976 (35.5) | 499 (36.3) | 0.62 |
| Current drinking | 556 (20.2) | 285 (20.7) | 0.71 |
| BMI (kg/m2) | 24.03±3.46 | 24.18±3.91 | 0.21 |
| BMI groups (kg/m2) | |||
| ≤24.9 | 1,763 (64.2) | 875 (63.6) | 0.36 |
| 25.0–29.9 | 859 (31.3) | 423 (30.8) | |
| ≥30.0 | 126 (4.6) | 77 (5.6) | |
| High WHR (males, ≥0.90; females, ≥0.80) | 1,354 (49.3) | 679 (49.4) | 0.95 |
| Ethnicity | 0.38 | ||
| Han | 2,577 (93.8) | 1,299 (94.5) | |
| Other | 171 (6.2) | 76 (5.5) | |
| Marital status | 0.19 | ||
| Unmarried | 26 (0.9) | 10 (0.7) | |
| Married or remarried | 2,607 (94.9) | 1,297 (94.3) | |
| Divorced | 23 (0.8) | 7 (0.5) | |
| Widowed | 92 (3.3) | 61 (4.4) | |
| Education | 0.12 | ||
| Illiterate | 179 (6.5) | 92 (6.7) | |
| Primary school | 1,077 (39.2) | 494 (35.9) | |
| Junior high school | 1,195 (43.5) | 649 (47.2) | |
| High school and above | 297 (10.8) | 140 (10.2) | |
| Family income level (CNY) | 0.73 | ||
| High | 77 (2.8) | 40 (2.9) | |
| Middle | 1,717 (62.5) | 874 (63.6) | |
| Low | 871 (31.7) | 427 (31.1) | |
| Poor | 83 (3) | 34 (2.5) | |
| SBP (mmHg) | 124.17±9.35 | 124.35±9.74 | 0.58 |
| DBP (mmHg) | 74.96±7.17 | 75.09±7.39 | 0.58 |
| High pulse rate (>100/min) | 125 (4.5) | 51 (3.7) | 0.21 |
| Diabetes | 140 (5.1) | 61 (4.4) | 0.36 |
| FPG (mmol/L) | 5.59±1.09 | 5.63±1.40 | 0.33 |
| History of CAD | 87 (3.2) | 44 (3.2) | 0.95 |
| History of stroke | 38 (1.4) | 10 (0.7) | 0.06 |
| History of AF | 9 (0.3) | 7 (0.5) | 0.38 |
| History of HF | 13 (0.5) | 9 (0.7) | 0.45 |
| HF symptoms | 165 (6) | 90 (6.5) | 0.50 |
| Family history of hypertension | 2,214 (80.6) | 1,098 (79.9) | 0.58 |
| Family history of diabetes | 350 (12.7) | 173 (12.6) | 0.89 |
| Family history of CAD | 381 (13.9) | 192 (14) | 0.93 |
| Family history of stroke | 403 (14.7) | 200 (14.5) | 0.92 |
| Meat or fish consumption (g/week) | 0.25 | ||
| Rarely | 481 (17.5) | 214 (15.6) | |
| <250 | 680 (24.7) | 372 (27.1) | |
| 250–500 | 863 (31.4) | 422 (30.7) | |
| >500 | 724 (26.3) | 367 (26.7) | |
| Vegetable consumption (kg/week) | 0.62 | ||
| Rarely | 43 (1.6) | 27 (2) | |
| <1.0 | 196 (7.1) | 107 (7.8) | |
| 1.0–1.5 | 676 (24.6) | 341 (24.8) | |
| 1.5–2.0 | 795 (28.9) | 409 (29.7) | |
| >2.0 | 1,038 (37.8) | 491 (35.7) | |
| Fatty food (times/week) | 0.71 | ||
| Rarely | 2,171 (79) | 1,100 (80) | |
| 2–3 | 490 (17.8) | 231 (16.8) | |
| >4 | 87 (3.2) | 44 (3.2) | |
| Bean consumption (times/week) | 0.28 | ||
| Rarely | 1,068 (38.9) | 507 (36.9) | |
| 2–3 | 1,373 (50) | 723 (52.6) | |
| >4 | 307 (11.2) | 145 (10.5) | |
| Tea consumption (times/day) | 0.65 | ||
| Never | 1,764 (64.2) | 882 (64.1) | |
| 1 | 562 (20.5) | 294 (21.4) | |
| >1 | 422 (15.4) | 199 (14.5) | |
| Pickles consumption (times/week) | 0.58 | ||
| Rarely | 975 (35.5) | 504 (36.7) | |
| 2–3 | 1,426 (51.9) | 711 (51.7) | |
| >4 | 347 (12.6) | 160 (11.6) | |
| Lard consumption | 1,067 (61.2) | 581 (42.3) | 0.03 |
| Sleep duration (h/day) | 0.08 | ||
| <6 | 413 (15) | 176 (12.8) | |
| 6–8 | 1,797 (65.4) | 903 (65.7) | |
| >8 | 538 (19.6) | 296 (21.5) | |
| Physical labor intensity | 0.12 | ||
| Light | 847 (30.8) | 381 (27.2) | |
| Moderate | 521 (19) | 271 (19.7) | |
| Heavy | 1,380 (50.2) | 723 (52.6) | |
| Regular exercise | 490 (17.8) | 244 (17.7) | 0.95 |
| Snoring | 944 (65.6) | 934 (67.9) | 0.14 |
| WBC count (109/L) | 6.25±13.61 | 6.04±2.22 | 0.57 |
| Hb (g/L) | 136.89±19.41 | 137.87±20.12 | 0.14 |
| BUN (mmol/L) | 5.45±2.47 | 5.39±1.78 | 0.73 |
| eGFR (mL/min/1.73 m2) | 96.13±14.25 | 96.81±13.17 | 0.14 |
| PLT count (×109/L) | 215.28±83.38 | 214.40±61.65 | 0.73 |
| ALT (U/L) | 21,74±23.21 | 20.89±13.02 | 0.20 |
| AST (U/L) | 21.41±13.60 | 20.92±8.06 | 0.23 |
| UA (mmol/L) | 278.71±77.71 | 275.92±79.53 | 0.28 |
| TG (mmol/L) | 1.37±1.055 | 1.39±1.36 | 0.52 |
| TC (mmol/L) | 5.06±1.00 | 5.04±1.03 | 0.67 |
| LDL (mmol/L) | 2.80±0.76 | 2.79±0.76 | 0.78 |
| HDL (mmol/L) | 1.41±0.36 | 1.40±0.36 | 0.34 |
| Ca (mmol/L) | 2.30±0.13 | 2.30±0.13 | 0.37 |
| P (mmol/L) | 1.11±0.16 | 1.11±0.17 | 0.92 |
| Mg (mmol/L) | 0.84±0.16 | 0.84±0.08 | 0.72 |
| K (mmol/L) | 4.19±0.33 | 4.18±0.32 | 0.11 |
| Na (mmol/L) | 141.10±2.06 | 141.10±2.04 | 0.97 |
| Cl (mmol/L) | 102.16±2.48 | 102.08±2.43 | 0.35 |
Unless indicated otherwise, data are given as the mean±SD or n (%). Abbreviations: AF, atrial fibrillation; ALT, alanine aminotransferase; AST, aspartate aminotransferase; BMI, body mass index; BUN, blood urea nitrogen; CAD, coronary artery disease; CNY, Chinese Yuan; DBP, diastolic blood pressure; eGFR, estimated glomerular filtration rate; FPG, fasting plasma glucose; Hb, hemoglobin; HDL, high-density lipoprotein; HF, heart failure; LDL, low-density lipoprotein; PLT, platelet; SBP, systolic blood pressure; TC, total cholesterol; TG, triglyceride; UA, uric acid; WBC, white blood cell; WHR, waist-to-hip ratio.
In the development cohort, univariate Cox analysis was performed (Supplementary Table 1) and lasso-penalized Cox analysis was used to narrow down the list of candidate variables. There were 23 independent variables included in the Cox regression model for a minimum lambda value. In contrast, 10 independent variables were included for a lambda value of the standard error. Because the model resulting from a minimum lambda value was relatively inconvenient to use, we believed that it was reasonable to use the lambda value of the standard error. Baseline serum calcium and serum magnesium concentrations were used for subsequent model updating; hence, they were not screened. The process of variable screening and cross-validation using lasso–Cox regression are shown in Supplementary Figures 2,3. The model was screened for age, WHR, SBP, DBP, high pulse rate, history of diabetes, family history of hypertension, family history of stroke, intake of bean products, and physical labor intensity. These 10 variables were risk factors for new-onset hypertension in the development cohort (Supplementary Figure 4).
Construction and Validation of a Predictive Nomogram (Model 1)We constructed a nomogram to predict the incidence of hypertension in the general population over 2.5 years by using the 10 independent risk factors (Figure 1). The C-index of this model was 0.744 (95% confidence interval [CI] 0.721–0.767) in the development cohort and 0.768 (95% CI 0.0.745–0.798) in the validation cohort was. The AUCs of the 2.5-year cumulative hypertension incidence model were 0.818 and 0.816 in the development and validation datasets, respectively (Supplementary Figure 5). In 2.5 years of follow-up, the predicted and actual values of cumulative hypertension were consistent in the development and validation cohorts (Figure 2).
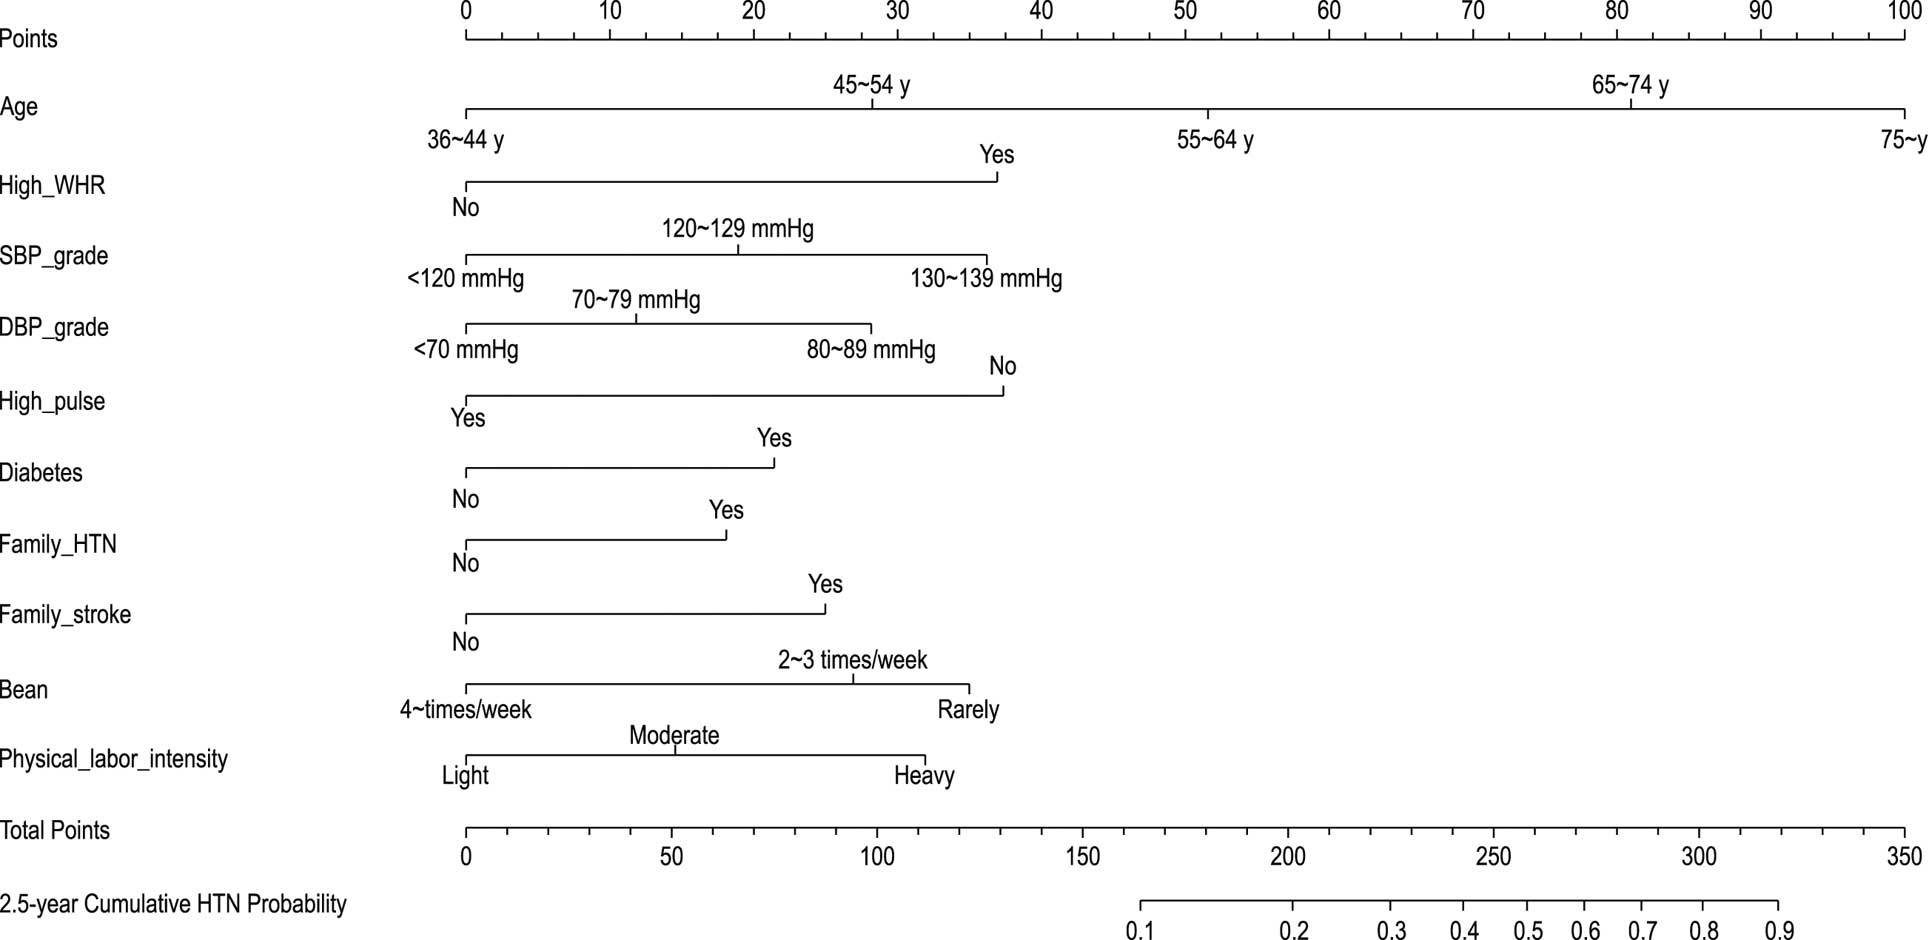
Nomogram of Model 1 predicting the probability of hypertension (HTN). DBP, diastolic blood pressure; SBP, systolic blood pressure; WHR, waist-to-hip ratio.
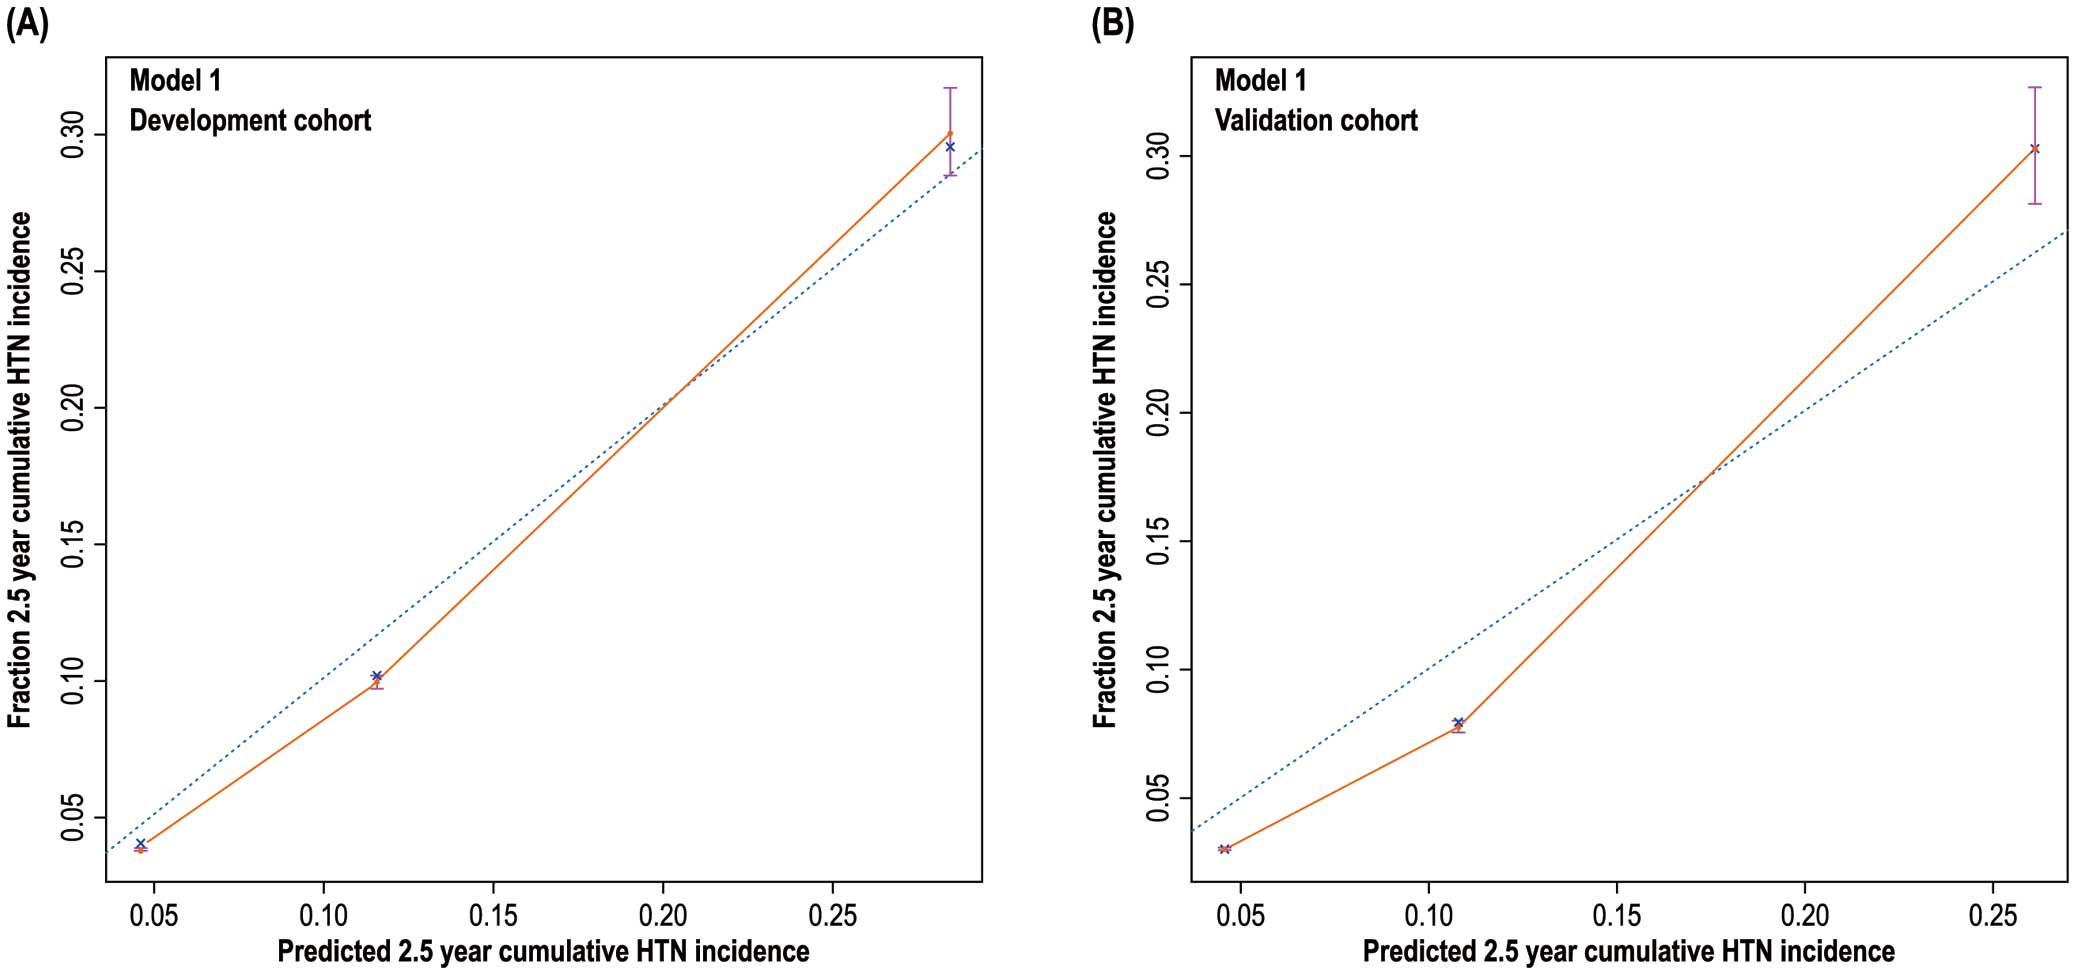
Model 1 calibration plots showing the 2.5-year cumulative hypertension (HTN) risk prediction in the (A) development and (B) validation cohorts.
In univariate Cox regression, low calcium and low magnesium concentrations were protective factors against hypertension with hazard ratios of 0.51 and 0.49, respectively (both P<0.001; Supplementary Table 1). Therefore, Model 1 was updated by including the parameters of low calcium and low magnesium concentrations. The updated multivariate Cox regression model is presented in Supplementary Table 2 and shown in Supplementary Figure 6. Figure 3 shows the updated nomogram based on Model 2, with the calibration plots presented in Figure 4. The C-indices of the updated model were 0.764 (95% CI 0.743–0.785) in the development cohort and 0.791 (95% CI 0.763–0.819) in the validation cohort. The AUC of the 2.5-year cumulative hypertension incidence was 0.907 in the development cohort and 0.917 in the validation cohort (Supplementary Figure 7). Thus, the AUC and C-index values of Model 2 were better than those of Model 1.
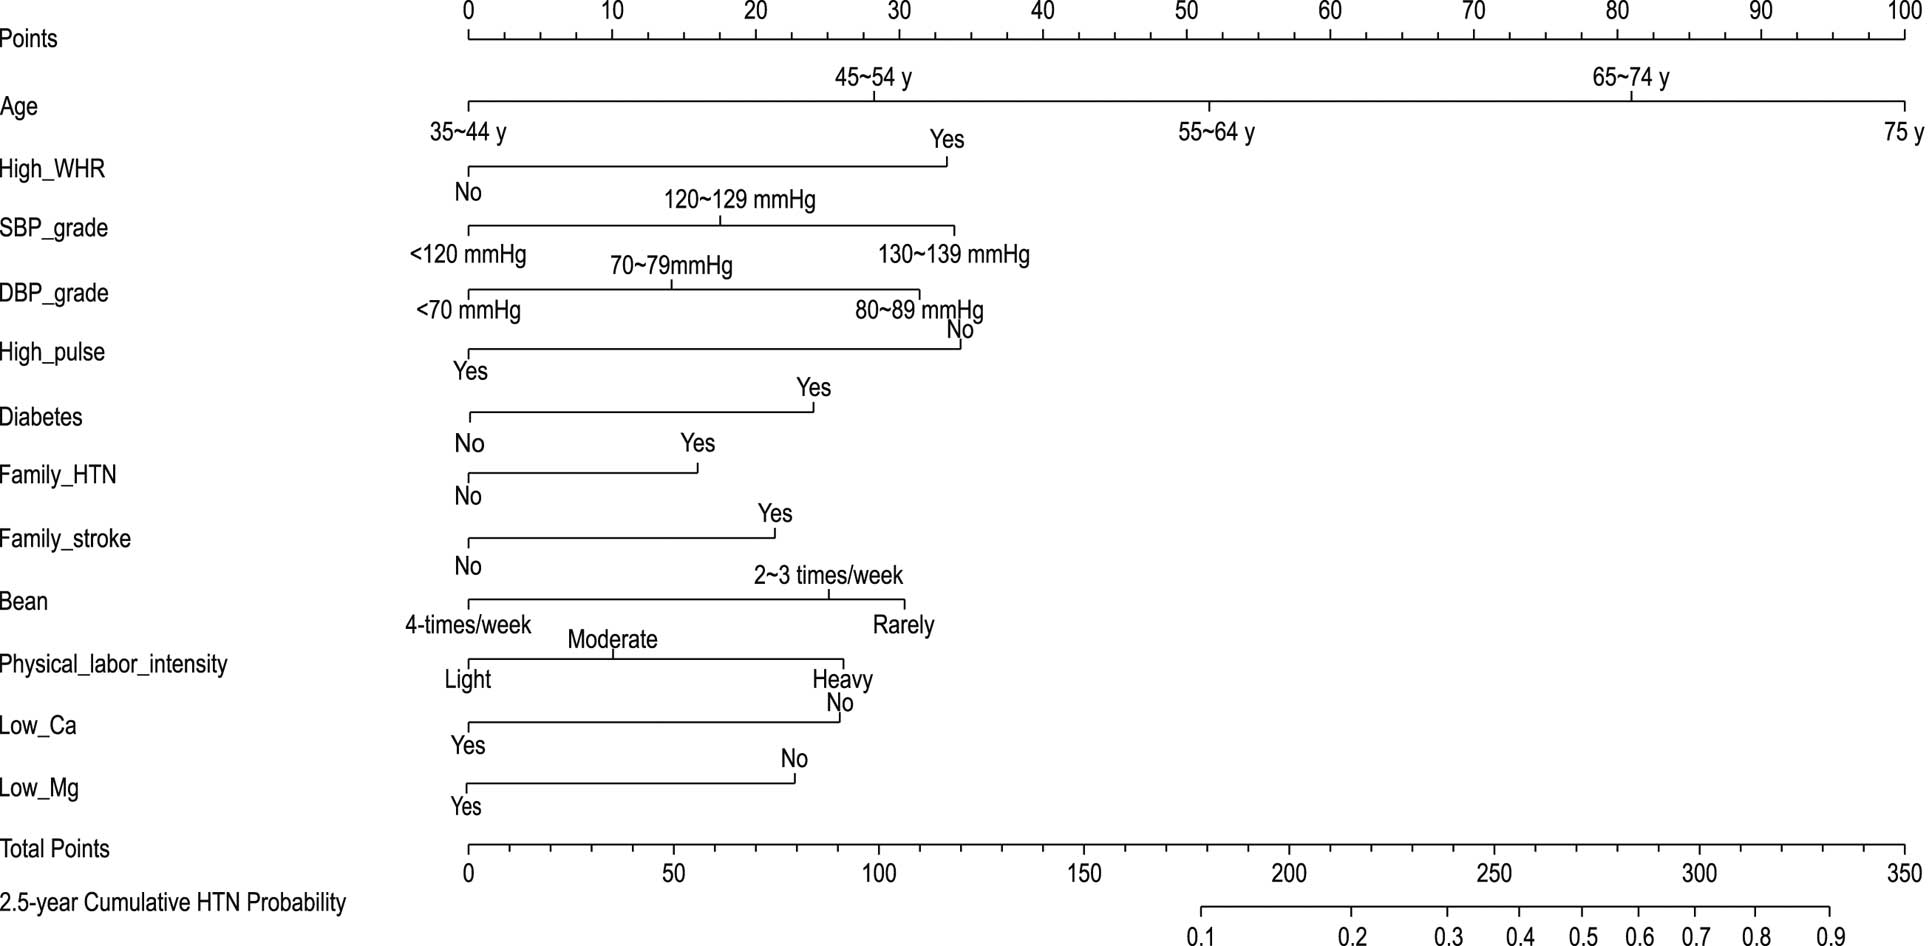
Nomogram of Model 2 predicting the 2.5-year cumulative incidence of hypertension (HTN). DBP, diastolic blood pressure; SBP, systolic blood pressure; WHR, waist-to-hip ratio.
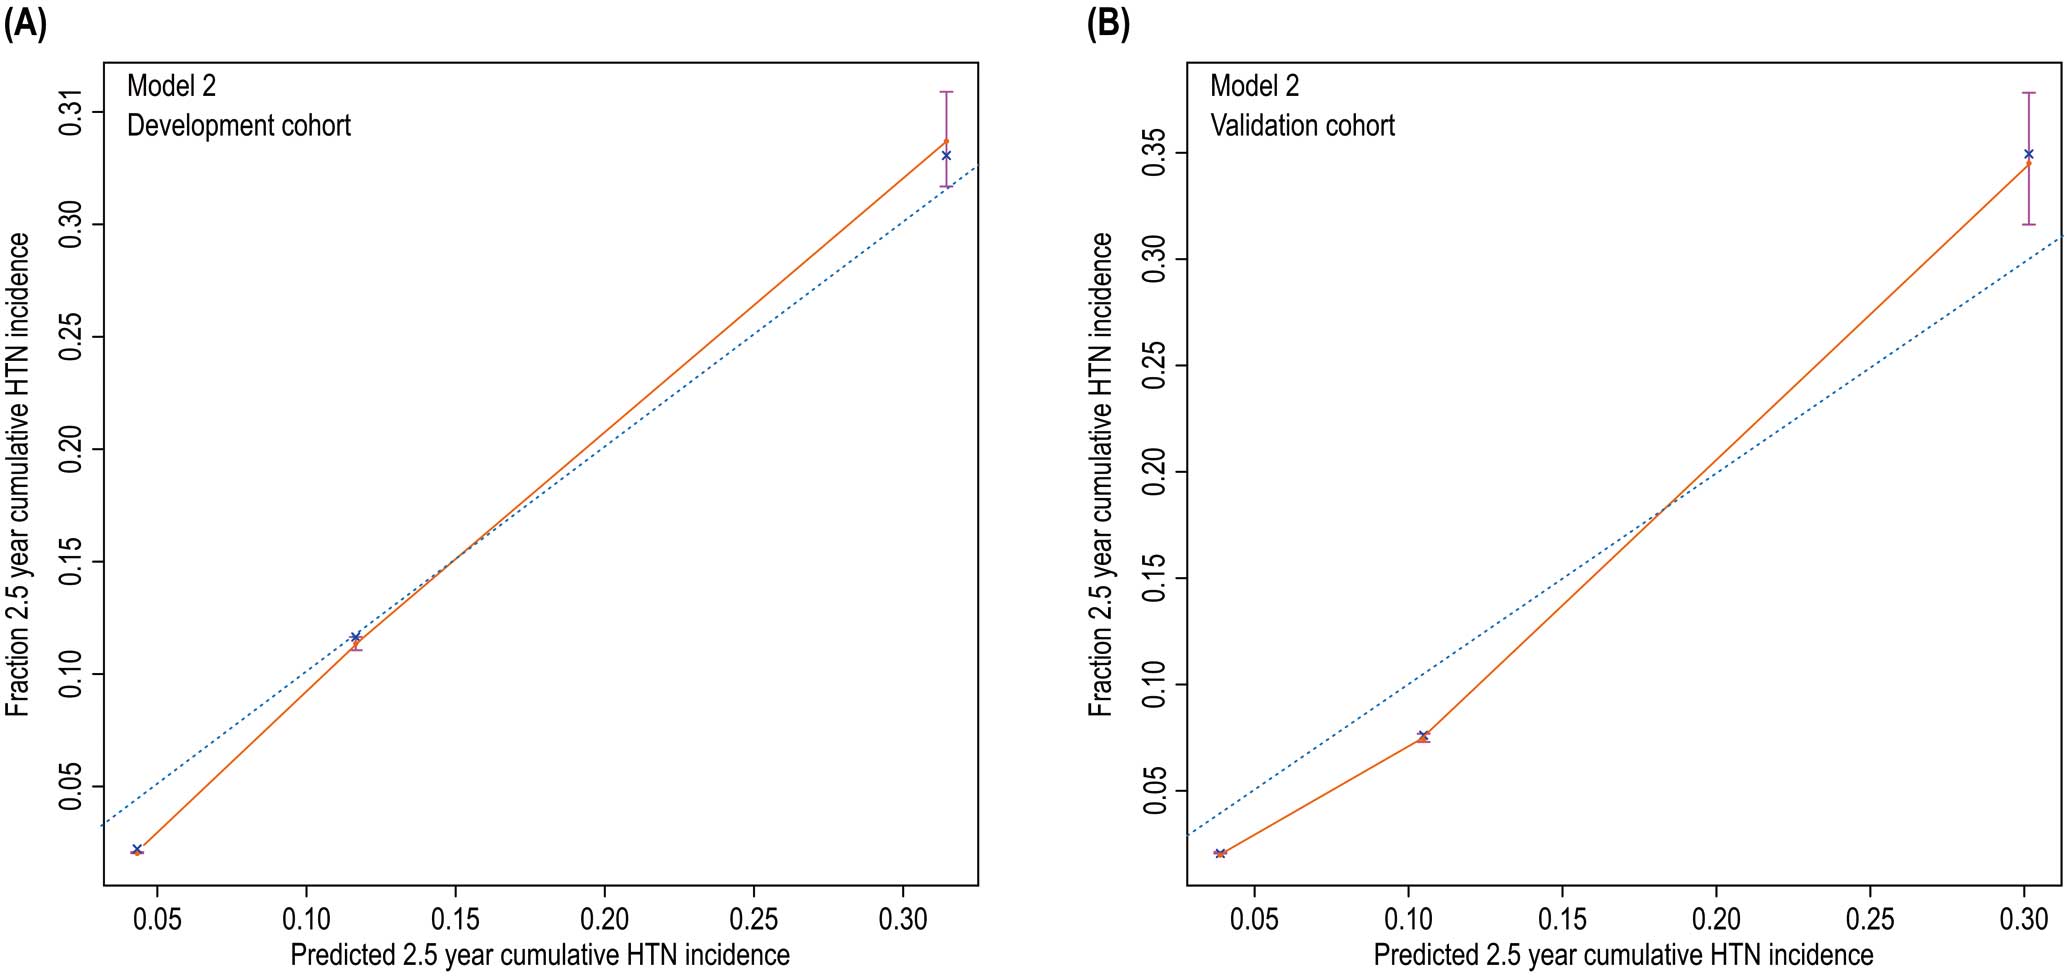
Model 2 calibration plots showing the 2.5-year cumulative hypertension (HTN) risk prediction in the (A) development and (B) validation cohorts.
NRI represents the extent to which the correct proportion of reclassification has increased.15 The updated Model 2 was more accurate in predicting hypertension, but the discriminatory ability of the 2 models regarding non-hypertension did not differ. The parameter IDI represents the extent to which the prediction ability of the new model is better than that of the old model. The IDI was >0, indicating that the overall discriminatory ability of the new model is significantly stronger (P<0.05; Table 2). In conclusion, the prediction of Model 2 was better than that of Model 1, especially in people with hypertension, and the prediction accuracies in the development and validation cohorts were increased by 62.4% and 70.1%, respectively. Compared to the IDIs of Model 1, the IDIs of Model 2 increased by 0.5% and 0.9% in the development and validation cohorts, respectively (P<0.05). This suggests that the overall prediction performance of the updated model was improved by adding serum calcium and serum magnesium concentrations as variables.
| Index | 2.5-year cumulative hypertension incidence | |
|---|---|---|
| Development cohort | Validation cohort | |
| NRI | Probability difference=2% | |
| NRI (95% CI) | 0.600 (0.471, 0.717)* | 0.700 (0.500, 0.870)* |
| NRI+ (95% CI) | 0.624 (0.506, 0.724)* | 0.701 (0.531, 0.853)* |
| NRI− (95% CI) | −0.024 (−0.058, 0.008) | −0.004 (−0.047, 0.042) |
| IDI (P value) | 0.005 (0.040)* | 0.009 (0.028)* |
*Means P<0.05. Abbreviations: CI, confidence interval; IDI, integrated discrimination improvement; NRI, net reclassification improvement.
Figure 5 shows the DCA curve of new hypertension cases in 2.5 years in the development and validation cohorts. In terms of hypertension occurrence in the general population within the prediction threshold range of 10–60%, the prediction of blood pressure intervention management according to the nomogram is better than “treat-all-patients” or “no-treatment” approaches. Considering that the hypertension incidence in the cohort during the 2.5 years was approximately 20%, we suggest a threshold probability of 20% for the participants. If the prediction probability of hypertension based on the nomogram is higher than 20%, frequent monitoring of blood pressure and intervention management should be performed.
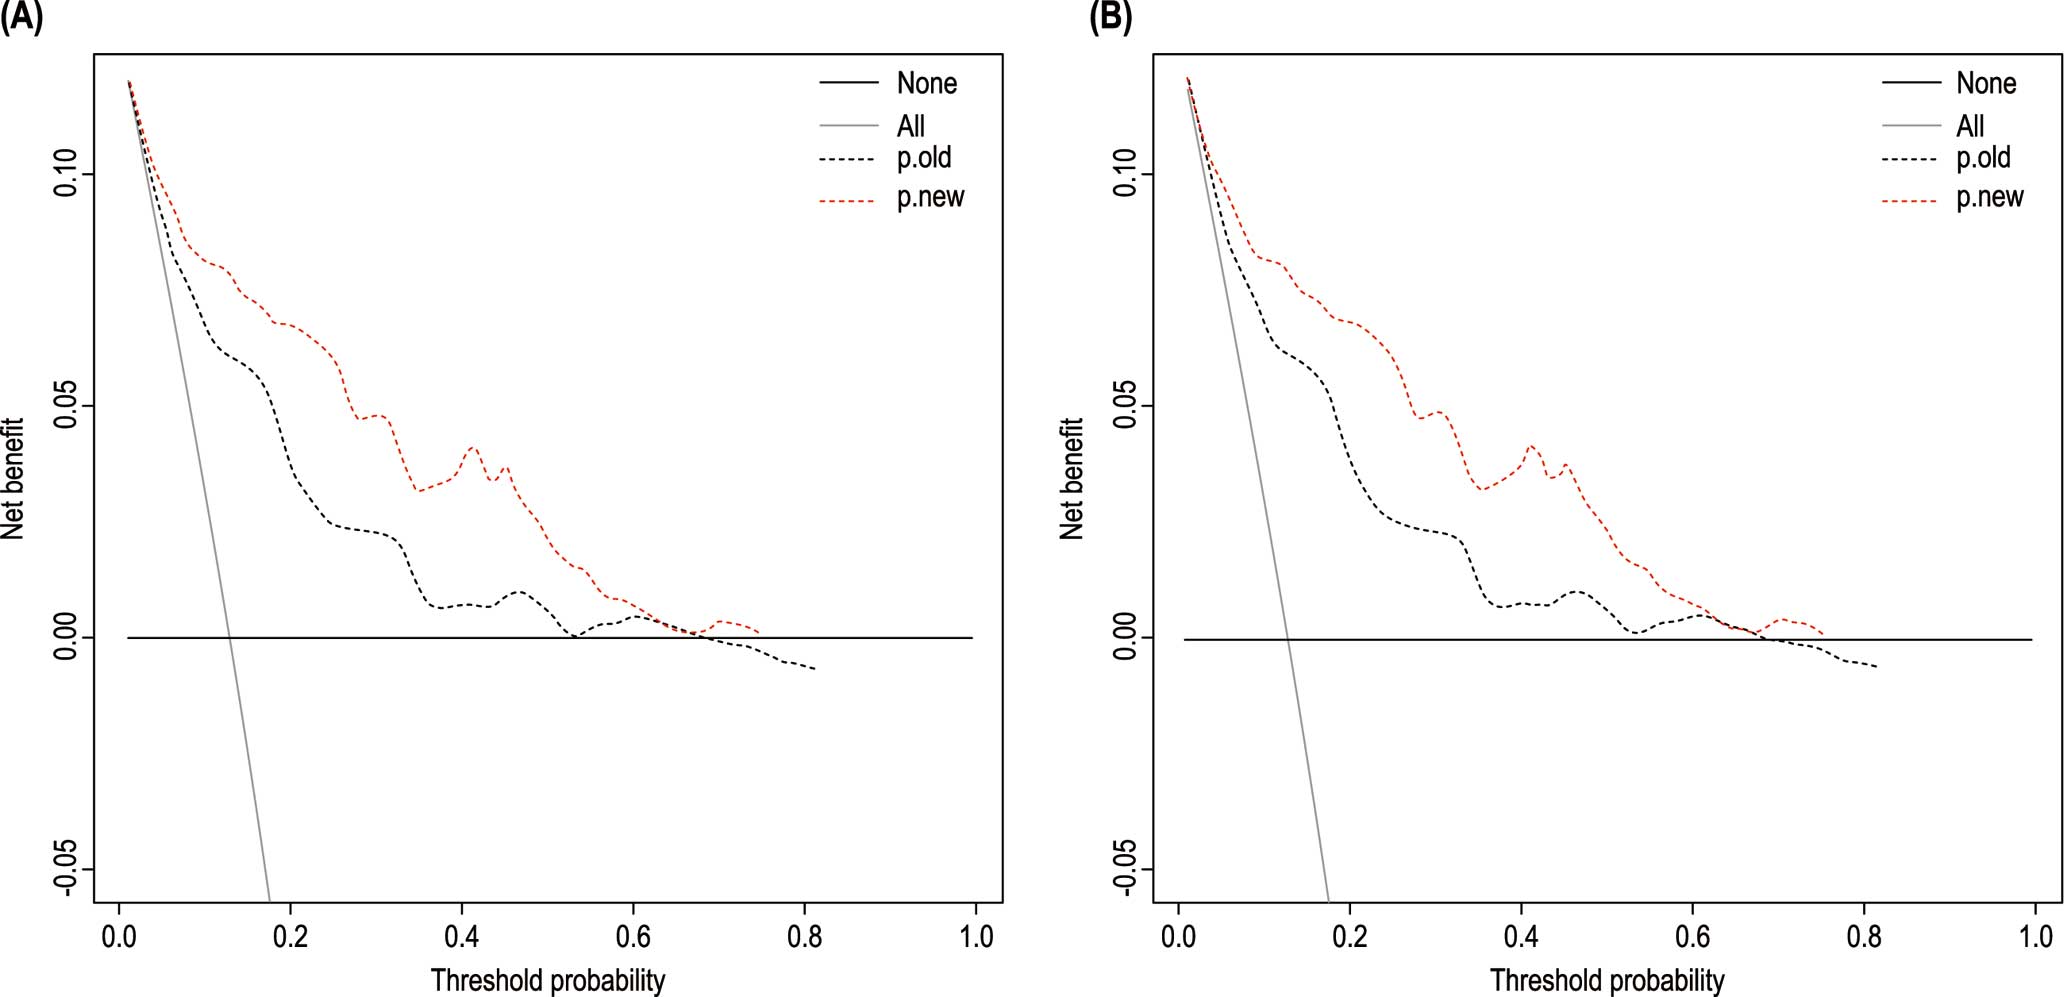
Decision curve analysis for the nomograms of the 2 models in the (A) development and (B) validation cohorts. The x- and y-axes measure the threshold probability and net benefit, respectively. The horizontal black line represents the hypothesis that none of the general population will receive an intervention. The grey solid line represents the hypothesis that interventions are offered to all participants. The other 2 lines represent the net benefits of offering interventions according to the threshold probabilities derived from the 2 nomograms.
The hypertension prediction model of non-diabetic populations based on the Framingham Heart Study established in 2008,16 which includes age, sex, SBP, DBP, BMI, and a family history of hypertension and smoking, is not applicable to rural areas of Liaoning, China, as demonstrated by our team in the past.17 Asian hypertension models have been developed in Iran,18 Taiwan,19 and South Korea,20 but most of these were based on data from urban populations from more than 10 years ago. Recently, Japan’s Jichi Genki hypertension prediction model incorporated new risk factors, such as uric acid, urinary protein, and eating frequency.21 This improved the prediction and differentiation among urban residents.21 At present, only 2 nomogram models exist to predict incident hypertension in China, both of which have some limitations.22,23 However, the model established in the rural area of the Central Plains of Henan Province cannot be applied to a general population because that study excluded patients with diabetes,22 and the model of ethnic minorities in Xinjiang was developed based on cross-sectional research.23 Therefore, we established an ideal prediction model for hypertension in rural China based on a prospective cohort from high-risk rural area.
In addition to age, SBP, DBP, and family history of hypertension, which are included in the Framingham Heart Study model, our model added the parameters of pulse rate, history of diabetes, family history of stroke, physical labor intensity, WHR (instead of BMI), and bean product consumption. Serum calcium and magnesium concentrations were also used as updated risk factors in the new model to assess the risk of new-onset hypertension over the short term. In the updated nomogram model, the age score was the highest, accounting for a score of 80. After serum ion concentrations had been added to the updated model, prediction discrimination and calibration were better. In a previous study, a high pulse rate was confirmed to be correlated with hypertension incidence,24 which is consistent with our results. Recent genetic studies suggest that diabetes has a causal effect on hypertension,25 and the 2 disorders share many pathophysiological mechanisms.26 Similar to our findings, a family history of stroke had good predictive performance in a previous Asian model for predicting hypertension.18 Appropriate physical labor can improve blood pressure27 and reduce the risk of hypertension.28 However, other studies suggest that carrying heavy objects and several occupational hazards may increase the risk of hypertension.29 Agricultural labor may differ from general physical activities because it is labor intensive. In our study, heavy agricultural activities increased the risk of hypertension. WHR was used in our nomogram because it is currently considered to be an ideal predictor of hypertension rather than traditional BMI.30,31 It has been demonstrated that the predictive ability of BMI is limited in the Chinese population.32
In addition to dietary fiber and resistant starch, beans contain high levels of protein and micronutrients and have a low sodium and saturated fat content. Thus, bean products reduce the risk of cardiovascular disease.33 Furthermore, the intake of bean products more than 5 times per week in an adolescent population significantly reduced BMI, body fat percentage, and low-density lipoprotein concentrations.34 People who eat fewer beans or products with a dietary structure similar to that of beans are predisposed to having a higher waist circumference.35 Soybean milk extract36 and soybean grain protein37 can inhibit the activity of angiotensin I-converting enzyme, thereby reducing blood pressure, which is consistent with the results of the present study. Notably, rural residents in northeast China always use soybeans and salt as ingredients to make dipping sauce throughout the year. Although this behavior may increase salt intake, the bean products are beneficial for hypertension.
The association between serum calcium concentrations and hypertension is not completely consistent. Most studies have shown that higher serum calcium concentrations are related to an increased risk of hypertension,38–40 but some studies have reported a protective effect of high serum calcium on blood pressure.41 A prospective study conducted in Taiwan suggests that higher serum calcium concentrations may precede insulin resistance to promote hypertension, which is consistent with our observations.40 At present, the following mechanisms related to high calcium concentration and hypertension are considered:38 (1) the intracellular calcium concentration affects the secretion of catecholamines, angiotensin II, and other hormones; (2) calcium is significantly correlated with an adverse lipid spectrum, such as increased triglyceride concentrations; and (3) serum calcium impairs cholesterol catabolism in the liver, increases lipid synthesis, and plays a role in atherosclerosis.
To the best of our knowledge, research on the relationship between serum magnesium and blood pressure is limited, and some studies have shown that serum magnesium is not significantly associated with hypertension.42–44 However, a cross-sectional study of Mexican children found that low serum magnesium concentrations were associated with prehypertension and hypertension.45 The effect of dietary magnesium intake on hypertension remains controversial,46 but some believe that dietary magnesium intake does not affect the serum magnesium concentration in people with normal magnesium metabolism, and supplementation is encouraged only when dietary magnesium intake is insufficient.47 In the present study, low serum magnesium concentrations were associated with a lower risk of hypertension. The apparent discrepancy between the present and previous studies may be due to differences in race, age, and reference limits. Furthermore, the NRI and IDI demonstrate that the prediction ability of Model 2, updated with serum calcium and magnesium concentrations, was better than that of the original Model 1.
This study has several strengths. First, the prospective cohort of a general population was randomly divided into development and validation cohorts. The performance of these 2 datasets was highly consistent. Second, the lasso strategy was used to simplify the model and avoid overfitting. Third, the indicators involved in the nomogram were relatively novel and adopted from the latest epidemiological surveys, and are easy for those in the primary health care sector to obtain to increase the practicability of prediction. Finally, the AUC of the updated Model 2 was better than those of prediction models constructed using other Asian cohorts, and the net benefit of the nomogram was evaluated by DCA.
This study also has several limitations. First, the participants in this study were from high-risk groups with a low socioeconomic status, poor medical service, and low awareness of disease prevention, they were from rural areas with limited physical activity due to the cold climate, low dietary fiber intake, and specific dietary habits,7 such as consuming pickled sauces with a high sodium content. Although the model was validated by samples with different baseline characteristics, its application in groups with other characteristics may be limited. Multiple imputation was used for a statistically acceptable small number of missing baseline data, which may limit the interpretation of the results. Given that the analysis was based on the general population rather than on patients seeking diagnosis and treatment in a hospital, it was not clinically possible to accurately determine whether the new-onset hypertension was secondary hypertension (although it was a relatively small probability event) and adopt a gold standard, such as renal ultrasound, angiography, and respiratory and sleep detection. Finally, the short follow-up time allowed only for the identification of new-onset hypertension in the short term.
In conclusion, this study established a nomogram model to predict the short-term risk of hypertension in high-risk rural areas in China by combining serological and lifestyle factors. Considering the current global controversy over diagnosis and antihypertensive targets,48 identifying patients at risk of developing hypertension is a potentially useful tool. The model can identify individuals at risk of short-term impending hypertension and provide strategies for the prevention and control of hypertension.
The authors thank all the participants and researchers in the Northeast China Rural Cardiovascular Health Study.
This work was supported by the National Key Research and Development Program of China (Grant no. 2017YFC1307600) and the Science and Technology Program of Liaoning Province, China (Grant no. 2020JH1/10300002).
The authors declare that there are no conflicts of interest.
The study protocol was approved by the Ethics Committee of China Medical University (Shenyang, China; AF-SDP-7-1, 0-01).
The deidentified participant data are available for validation analysis and will be shared by the corresponding author on reasonable request. Only the data underlying this article are available; no additional, related documents will be shared.
Please find supplementary file(s);
http://dx.doi.org/10.1253/circj.CJ-22-0016