Abstract
Background: It is still unclear whether changes in right ventricular function are associated with prognosis in heart failure (HF) patients. This study aimed to examine the prognostic effect of changes in right ventricular fractional area change (RVFAC).
Methods and Results: This study enrolled 480 hospitalized patients with decompensated HF, and measured RVFAC with echocardiography at discharge (first examination) and post-discharge in the outpatient setting (second examination). RVFAC was divided into 3 categories: >35% in 314 patients, 25–35% in 108 patients, and <25% in 58 patients. Next, based on changes in RVFAC from the first to the second examination, the patients were further classed into 4 groups: (1) Preserved/Unchanged (preserved and unchanged RVFAC, n=235); (2) Reduced/Improved (improved RVFAC in at least 1 category, n=106); (3) Reduced/Unchanged (reduced and unchanged RVFAC, n=47); and (4) Preserved or Reduced/Worsened (deteriorated RVAFC in at least 1 category, n=92). Multivariate logistic regression analysis revealed that chronic kidney disease and anemia were the predictors of the preserved or reduced/worsened RVFAC. In the Kaplan-Meier analysis, changes in RVFAC were associated with the cardiac event rate and all-cause mortality. In the multivariable Cox proportional hazard analysis, the preserved or reduced/worsened RVFAC was an independent predictor of cardiac events and all-cause mortality.
Conclusions: Changes in RVFAC were associated with post-discharge prognosis in hospitalized heart failure patients.
Changes in left ventricular ejection fraction (LVEF) and their prognostic effect on heart failure (HF) patients have recently been reported, and it has been shown that a decrease in LVEF was associated with higher mortality.1–3 In contrast, although right ventricular ejection fraction is a strong and independent predictor of mortality in HF patients,4–6 it is still unclear whether changes in right ventricular function are associated with prognosis in HF patients. Right ventricular fractional area change (RVFAC) is commonly used to measure right ventricular function in clinical practice. RVFAC correlates more accurately with right ventricular ejection fraction measured by magnetic resonance imaging than tricuspid annular plane systolic excursion (TAPSE),7 because RVFAC includes a transversal component of right ventricular function.8 In the present study, we focused on changes in RVFAC, and aimed to clarify the clinical characteristics and prognosis of HF patients with worsened RVFAC.
Methods
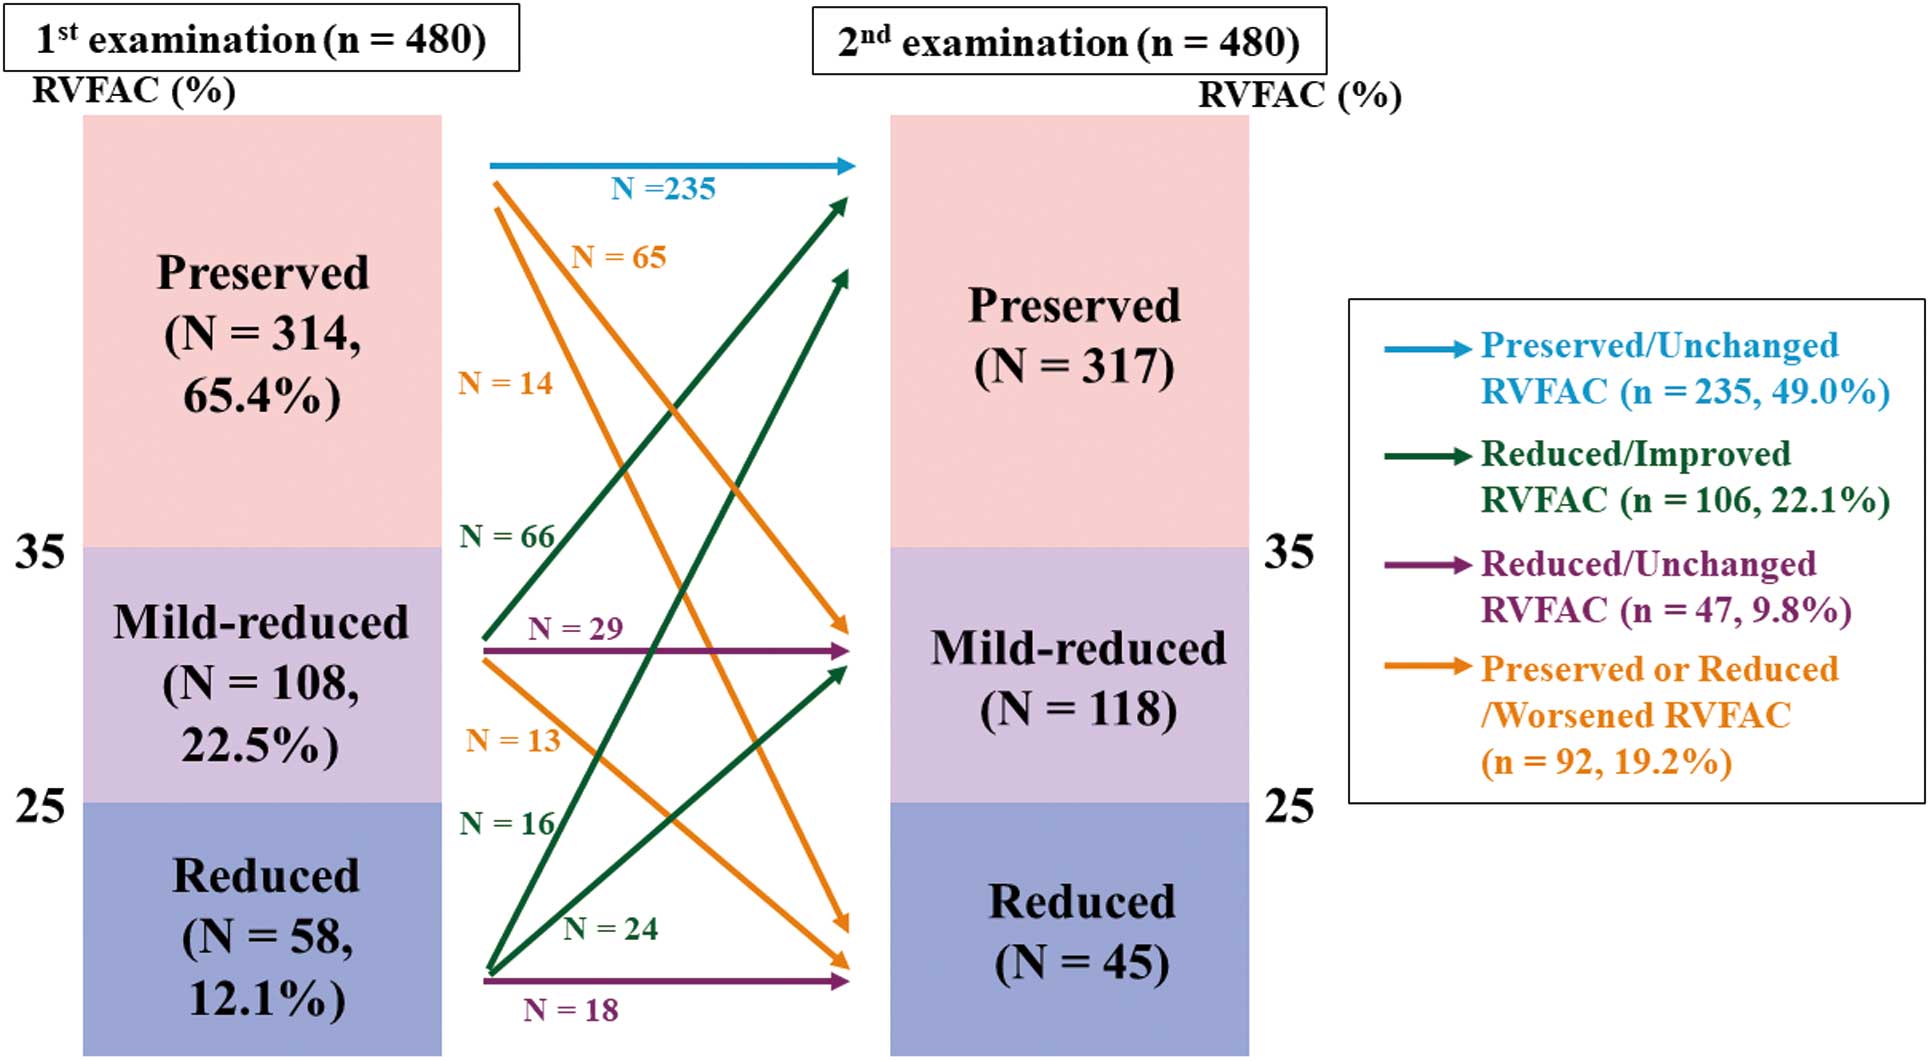
This was a prospective observational cohort study. We enrolled a total of 625 consecutive patients who were hospitalized at Fukushima Medical University Hospital for acute decompensated HF between February 2010 and October 2018, and whose RVFAC was measured at discharge (first examination) and post-discharge in the outpatient setting (second examination) (Figure 1). The diagnosis of decompensated HF was made by several cardiologists based on the HF guidelines.9,10 Patients who were lost to second examination follow up and/or had events before the second examination, those who were receiving maintenance dialysis, and those who underwent open heart surgery between 3 months prior to admission and the time of the second examination were excluded (n=145). Finally, we included 480 patients (37.3% female, mean age 62.2±15.5 years), with a mean interval from the first to the second examination of 7 months (range 3–10 months). As shown in Figure 2, RVFAC at the first examination was divided into 3 categories;11 >35% in 314 patients (preserved RVFAC, 65.4%), 25–35% in 108 patients (mildly reduced RVFAC, 22.5%), and <25% in 58 patients (reduced RVFAC, 12.1%). Next, based on changes in RVFAC from the first to the second examination, the patients were further classed into 4 groups: (1) Preserved/Unchanged (preserved and unchanged RVFAC, n=235, 49.0%); (2) Reduced/Improved (improved RVFAC in at least 1 category, n=106, 22.1%); (3) Reduced/Unchanged (reduced and unchanged RVFAC, n=47, 9.8%); and (4) Preserved or Reduced/Worsened (deteriorated RVAFC in at least 1 category, n=92, 19.2%). We compared the clinical features, laboratory data, echocardiographic parameters, and post-discharge prognosis among the 4 groups. The patients were followed up from the day of the second examination (day 0) until March 2020 for cardiac events and all-cause death. For patients who experienced ≥2 events, only the first event was included in the analysis. Cardiac events were defined as worsened HF and cardiac death. Cardiac death was classified by independent experienced cardiologists as death from worsened HF, ventricular fibrillation documented by electrocardiogram or implantable devices, or acute coronary syndrome. Worsened HF was defined as hospitalization due to decompensated HF. Status and dates of death were obtained from the patient medical records. If these data were unavailable, the status was ascertained by a telephone call to the physician at the referring hospital. We were able to follow up on all patients.

This study complied with the Declaration of Helsinki and the statement of STROBE (Strengthening the Reporting of Observational studies in Epidemiology). The study protocol was approved by the ethical committee of Fukushima Medical University (No. 826). Those administering the survey were blinded to the analyses, and written informed consent was obtained from all study subjects.12
Measurement of Echocardiography Parameters
Echocardiography was performed blindly by experienced echocardiographers using standard techniques.13 The echocardiographic parameters investigated included LVEF, left atrium volume, ratio of early transmitral flow velocity to mitral annular velocity (mitral valve E/e’), RVFAC, right ventricular end-diastolic volume index, right ventricular end-systolic volume index, pulmonary artery systolic pressure, and inferior vena cava diameter.11 The LVEF was calculated using Simpson’s method in a 4-chamber view. We classified the patients into 3 groups according to LVEF observed at the first examination: preserved EF (HFpEF; LVEF ≥50%); mildly reduced LVEF (HFmrEF; LVEF 40%–49%) and reduced EF (HFrEF; LVEF <50%). The RVFAC (defined as end-diastolic area − end-systolic area) / end-diastolic area × 100), was used as a measure of right ventricular systolic function.11 All measurements were performed using ultrasound systems (ACUSON Sequoia, Siemens Medical Solutions USA, Mountain View, CA, USA).11 For the measurement of RVFAC, the intraclass correlation coefficient of inter- and intra-observer reproducibility was 0.85 (95% confidence interval [CI], 0.79–0.92) and 0.78 (95% CI, 0.72–0.84), respectively.
Statistical Analysis
Categorical variables are expressed as numbers and percentages. A chi-squared test was used for comparisons of categorical variables, followed by Fisher’s exact test, when appropriate. Normality was confirmed using the Shapiro-Wilk test in each group. Parametric variables are presented as mean±standard deviation, and non-parametric variables are presented as median and interquartile range. Parametric variables were compared using analysis of variance, and equality was tested using the Levene test. If the data were equal, analysis of variance was followed by Tukey’s honest significant difference test. If the data were not equal, the Games-Howell post-hoc test was used. Non-parametric variables were compared using the Kruskal-Wallis test. We performed logistic regression analysis allowing for interaction between preserved or reduced/worsened RVFAC and each possible confounding factor. Kaplan-Meier analysis was used for presenting the cardiac event rate and all-cause mortality, and the log-rank test was used for initial comparisons. Kaplan-Meier estimates of the survival curves were plotted against time of the follow-up period. These curves helped in identifying non-proportionality patterns in hazard function, such as convergence (difference in risk between the groups decreases with time), divergence or crossing of the curves. In addition, a Schoenfeld test for the violation of proportional hazards, which can be used to assess the correlation between scaled residuals and time, was also conducted. Univariable and multivariable Cox proportional hazard analyses were used to evaluate changes in RVFAC as a predictor of cardiac events and all-cause mortality. Univariable parameters with P<0.10 were included in the multivariable analysis. The proportional hazards assumption for the model was checked by examining log-log transformed data. A P<0.05 was considered statistically significant for all comparisons, and all analyses were performed using a statistical software package (SPSS V.27.0; IBM, Armonk, NY, USA).
Results
The clinical characteristics of the patients are presented in Table 1. There were no significant differences in age, sex, body mass index or New York Heart Association functional class among the 4 groups. The prevalence of hypertension was highest in the preserved/unchanged group, whereas the prevalence of CKD was highest in the preserved or reduced/worsened group. In contrast, the prevalence of other comorbidities such as atrial fibrillation, diabetes, sleep-disordered breathing and chronic obstructive pulmonary disease did not differ among the groups. The findings of laboratory data and echocardiography are presented in Table 2. In the reduced/unchanged group, RVFAC at the first examination was lowest, and right ventricular end-diastolic volume index, right ventricular end-systolic volume index, tricuspid annular diameter, pulmonary artery systolic pressure and inferior vena cava diameter were higher than in the other groups. In contrast, other parameters including B-natriuretic peptide (BNP), troponin I, LVEF, mitral valve E/E’ and tricuspid valve S’ did not significantly differ among the groups. There was a negative correlation between changes in RVFAC with changes in right ventricular end-systolic volume index (r=−0.54, P<0.01), but not with changes in right ventricular end-diastolic volume index (r=−0.48, P=0.33).
Table 1. Baseline Clinical Patient Characteristics (n=480)
| |
Preserved/
Unchanged
(n=235) |
Reduced/
Improved
(n=106) |
Reduced/
Unchanged
(n=47) |
Preserved or
Reduced/Worsened
(n=92) |
P value |
| Demographics |
| Age (years) |
63.2±15.4 |
61.5±15.9 |
57.2±16.4 |
62.8±14.8 |
0.102 |
| Male gender |
144 (61.5) |
66 (62.3) |
27 (57.4) |
64 (69.6) |
0.466 |
| Body mass index (kg/m2) |
23.0±4.0 |
23.8±4.5 |
23.5±4.0 |
23.9±3.8 |
0.867 |
| NYHA functional class III/IV |
97 (41.3) |
54 (50.9) |
25 (53.2) |
39 (42.4) |
0.226 |
| Comorbidity |
| Coronary artery disease |
32 (13.6) |
22 (20.8) |
10 (21.3) |
12 (13.0) |
0.224 |
| Atrial fibrillation |
101 (43.0) |
40 (37.7) |
18 (38.3) |
39 (42.4) |
0.790 |
| Hypertension |
164 (69.8) |
59 (55.7) |
22 (46.8) |
58 (63.0) |
0.006 |
| Diabetes |
90 (38.3) |
33 (31.1) |
20 (42.6) |
39 (42.4) |
0.348 |
| Dyslipidemia |
178 (75.7) |
73 (68.9) |
34 (72.3) |
70 (76.1) |
0.553 |
| Chronic kidney disease |
116 (49.4) |
48 (45.3) |
18 (38.3) |
56 (60.9) |
0.049 |
| Anemia |
112 (47.7) |
50 (47.2) |
18 (38.3) |
56 (60.9) |
0.054 |
| Sleep-disordered breathing |
127 (54.0) |
56 (52.8) |
23 (48.9) |
58 (63.0) |
0.335 |
| COPD |
69 (29.4) |
32 (30.2) |
17 (36.2) |
32 (34.3) |
0.680 |
| Smoking |
132 (56.2) |
64 (60.4) |
26 (55.3) |
45 (48.9) |
0.444 |
| Treatment |
| RAS inhibitor |
186 (79.1) |
62 (58.5) |
30 (63.8) |
68 (73.9) |
0.001 |
| Mineral receptor antagonist |
98 (41.7) |
55 (51.9) |
25 (53.2) |
52 (56.5) |
0.056 |
| β-blocker |
188 (80.0) |
74 (69.8) |
29 (61.7) |
74 (80.4) |
0.014 |
| Diuretic |
165 (70.2) |
80 (75.5) |
36 (76.6) |
72 (78.3) |
0.420 |
| Statin |
99 (42.1) |
41 (38.7) |
14 (29.8) |
36 (39.1) |
0.463 |
| Anti-diabetic agents |
53 (22.6) |
18 (17.0) |
11 (23.4) |
22 (23.9) |
0.607 |
| Anticoagulant |
142 (60.4) |
78 (73.6) |
31 (66.0) |
61 (66.3) |
0.128 |
| ICD |
34 (14.5) |
9 (8.5) |
8 (17.0) |
19 (20.7) |
0.107 |
| CRTD |
29 (12.4) |
10 (9.4) |
4 (8.5) |
18 (19.6) |
0.128 |
Data are presented as mean±standard deviation or n (%). COPD, chronic obstructive pulmonary disease; CRTD, cardiac resynchronization therapy defibrillator; ICD, implantable cardioverter defibrillator; NYHA, New York Heart Association; RAS, renin-angiotensin system.
Table 2. Baseline Patient Characteristics (n=480)
| |
Preserved/
Unchanged
(n=235) |
Reduced/
Improved
(n=106) |
Reduced/
Unchanged
(n=47) |
Preserved or
Reduced/Worsened
(n=92) |
P value |
| Laboratory data |
| BNP (pg/mL) |
147.2 (63.5–287.3) |
182.0 (85.1–473.6) |
149.5 (75.0–314.6) |
156.0 (68.3–482.3) |
0.590 |
| Troponin I |
0.04 (0.02–0.09) |
0.03 (0.02–0.08) |
0.04 (0.02–0.08) |
0.04 (0.03–0.21) |
0.138 |
| Echocardiographic data |
| LVEF (%) |
51.2±16.2 |
48.7±16.1 |
50.3±20.0 |
49.2±15.6 |
0.578 |
| HFpEF |
135 (57.4) |
55 (51.9) |
26 (55.3) |
45 (48.9) |
0.516 |
| HFmrEF |
37 (15.7) |
22 (20.8) |
5 (10.6) |
21 (22.8) |
0.207 |
| HFrEF |
63 (26.8) |
29 (27.4) |
16 (34.0) |
26 (28.3) |
0.791 |
| Left atrial volume index (mL/m2) |
48.2±38.3 |
39.1±28.5 |
53.9±55.6 |
51.6±35.9 |
0.056 |
| Mitral valve E/e’ |
14.1±7.6 |
14.0±7.8 |
14.6±6.9 |
14.4±10.0 |
0.968 |
| RVFAC at baseline (mm) |
47.8±7.6 |
25.8±7.0** |
25.1±7.0**,†† |
43.5±8.8**,††,§§ |
<0.001 |
| RVEDVI (mL/m2) |
10.7±3.9 |
11.6±4.1 |
14.5±5.7**,†† |
12.2±5.4*,§ |
<0.001 |
| RVESVI (mL/m2) |
5.6±2.3 |
8.6±3.2** |
10.9±4.7**,†† |
7.0±3.5**,††,§§ |
<0.001 |
| Tricuspid annular diameter (mm) |
35.2±9.4 |
36.5±8.0 |
42.5±9.1**,†† |
38.1±9.5§ |
<0.001 |
| Tricuspid valve S’ (cm) |
11.7±18.6 |
9.5±3.4 |
9.3±4.4 |
10.8±13.9 |
0.701 |
| Pulmonary artery systolic pressure (mmHg) |
38.6±12.5 |
50.2±26.3** |
58.0±28.2** |
42.1±17.5†,§§ |
<0.001 |
| Inferior vena cava diameter (mm) |
14.1±4.8 |
15.6±4.5 |
17.1±5.3** |
16.0±6.0* |
<0.001 |
Data are presented as mean±standard deviation, n (%) or median (interquartile range). Versus Preserved/Unchanged, *P<0.05, **P<0.01; Versus Reduced/Improved, †P<0.05, ††P<0.01; Versus Reduced/Unchanged, §P<0.05, §§P<0.01 after the Bonferroni correction. BNP, B-type natriuretic peptide; EF, ejection fraction; HFmrEF, mildly reduced LVEF (LVEF 40–49%); HFpEF, preserved EF (LVEF ≥50%); HFrEF, reduced EF (LVEF <50%); LV, left ventricular; RVEDVI, right ventricular end-diastolic volume index; RVESVI, right ventricular end-systolic volume index; RVFAC, right ventricle fractional area change.
During the follow-up period (mean 1,365 days, range 7–3,640 days), 162 cardiac events including 144 hospitalizations due to HF and 18 cardiac deaths occurred, as well as 147 all-cause mortalities (74 cardiac deaths and 73 non-cardiac deaths). In the Kaplan-Meier analysis (Figures 3,4), RVFAC at the first examination was not associated with cardiac event rate and all-cause mortality. However, changes in RVFAC from the first to the second examination were associated with cardiac event rate (P<0.001) and all-cause mortality (P=0.010). In particular, the preserved or reduced/worsened RVFAC group had the highest cardiac event rate and highest all-cause mortality, rather than the reduced/unchanged RVFAC group. Multivariable logistic regression analysis revealed that CKD and anemia were predictors of the preserved or reduced/worsened RVFAC group (Table 3). In the multivariable Cox proportional hazard analysis (Table 4), the preserved or reduced/worsened RVFAC was an independent predictor of cardiac events (vs. preserved/unchanged RVFAC; hazard ratio 2.33, 95% CI 1.58–3.43, P<0.01; vs. reduced/improved RVFAC, hazard ratio 3.30, 95% CI 1.95–5.59, P<0.01) as well as all-cause mortality (vs. reduced/improved RVFAC, hazard ratio 2.19, 95% CI 1.28–3.76, P<0.01).


Table 3. Logistic Regression Analysis: Associations Between the Clinical Profiles and “Preserved or Reduced/Worsened RVFAC”
| |
Univariate |
Multivariate |
| OR (95% CI) |
P value |
OR (95% CI) |
P value |
| Age (years) |
1.003 (0.989–1.018) |
0.655 |
|
|
| Male sex |
1.456 (0.893–2.374) |
0.132 |
|
|
| Body mass index |
1.027 (0.974–1.083) |
0.317 |
|
|
| NYHA class III or IV |
0.886 (0.560–1.403) |
0.607 |
|
|
| Coronary artery disease |
1.070 (0.622–1.843) |
0.806 |
|
|
| Atrial fibrillation |
1.060 (0.669–1.679) |
0.805 |
|
|
| Hypertension |
0.996 (0.622–1.595) |
0.986 |
|
|
| Diabetes |
1.261 (0.794–2.001) |
0.326 |
|
|
| Dyslipidemia |
1.150 (0.677–1.952) |
0.605 |
|
|
| Chronic kidney disease |
1.761 (1.107–2.800) |
0.017 |
1.613 (1.005–2.588) |
0.048 |
| Anemia |
1.798 (1.130–2.858) |
0.013 |
1.686 (1.043–2.726) |
0.033 |
| Sleep-disordered breathing |
1.507 (0.944–2.406) |
0.086 |
1.469 (0.890–2.424) |
0.132 |
| COPD |
1.220 (0.755–1.973) |
0.417 |
|
|
| Smoking |
0.879 (0.485–1.593) |
0.670 |
|
|
| RAS inhibitor |
1.121 (0.670–1.876) |
0.664 |
|
|
| Mineral receptor antagonist |
1.534 (0.970–2.425) |
0.067 |
1.271 (0.787–2.053) |
0.327 |
| β-blocker |
1.370 (0.780–2.409) |
0.274 |
|
|
| Diuretic |
1.371 (0.796–2.360) |
0.255 |
|
|
| Statin |
0.977 (0.613–1.556) |
0.921 |
|
|
| Anti-diabetic agents |
1.173 (0.685–2.008) |
0.561 |
|
|
| Anticoagulant |
1.074 (0.665–1.735) |
0.771 |
|
|
| ICD |
1.715 (0.956–3.076) |
0.071 |
1.008 (0.445–2.284) |
0.985 |
| CRTD |
1.946 (1.063–3.563) |
0.031 |
1.422 (0.611–3.313) |
0.414 |
| BNP (pg/mL) |
1.038 (0.670–1.606) |
0.868 |
|
|
| LVEF (%) |
0.995 (0.982–1.009) |
0.515 |
|
|
Durations of first and second examinations
(months) |
0.981 (0.937–1.027) |
0.419 |
|
|
CI, confidence interval; OR, odds ratio. Other abbreviations as in Tables 1,2.
Table 4. Cox Proportional Hazard Analyses for Cardiac Events and All-Cause Mortality
| |
HR |
95% CI |
P value |
| Cardiac event (162 events/480 patients) |
| Preserved or Reduced/Worsened (vs. Preserved/Unchanged) |
2.415 |
1.678–3.484 |
<0.001 |
| Preserved or Reduced/Worsened (vs. Preserved/Unchanged) adjusted* |
2.326 |
1.577–3.425 |
<0.001 |
| Preserved or Reduced/Worsened (vs. Reduced/Improved) |
3.226 |
1.965–5.291 |
<0.001 |
| Preserved or Reduced/Worsened (vs. Reduced/Improved) adjusted* |
3.300 |
1.946–5.587 |
<0.001 |
| Preserved or Reduced/Worsened (vs. Reduced/Unchanged) |
1.580 |
0.931–2.680 |
0.090 |
| Preserved or Reduced/Worsened (vs. Reduced/Unchanged) adjusted* |
1.136 |
0.642–2.141 |
0.661 |
| All-cause mortality (147 events/480 patients) |
| Preserved or Reduced/Worsened (vs. Preserved/Unchanged) |
1.608 |
1.095–2.358 |
0.015 |
| Preserved or Reduced/Worsened (vs. Preserved/Unchanged) adjusted* |
1.379 |
0.913–2.079 |
0.126 |
| Preserved or Reduced/Worsened (vs. Reduced/Improved) |
2.165 |
1.290–3.636 |
0.003 |
| Preserved or Reduced/Worsened (vs. Reduced/Improved) adjusted* |
2.193 |
1.280–3.759 |
0.004 |
| Preserved or Reduced/Worsened (vs. Reduced/Unchanged) |
2.000 |
1.028–3.891 |
0.041 |
| Preserved or Reduced/Worsened (vs. Reduced/Unchanged) adjusted* |
1.695 |
0.806–3.559 |
0.164 |
Adjusted*: Age, male sex, body mass index, hypertension, diabetes mellitus, atrial fibrillation, anemia, chronic kidney disease, peripheral artery disease, log BNP, LVEF, RAS inhibitor, mineral receptor antagonist, β-blocker and diuretic. CI, confidence interval; HR, hazard ratio. Other abbreviations as in Tables 1,2.
Discussion
The present study showed that the worsening RVFAC after discharge is associated with adverse prognosis in hospitalized HF patients. In the present study, although RVFAC at the first examination was associated with neither cardiac event rate nor all-cause mortality, changes in RVFAC from the first to the second examination are associated with both cardiac event rate and all-cause mortality after discharge. In particular, the preserved or reduced/worsened RVFAC group presented the highest cardiac event rate and all-cause mortality. In addition, CKD and anemia were found to be predictors of preserved or reduced/worsened RVFAC. Our results demonstrated that the worsening of RV function, rather than RV dysfunction at baseline, may have prognostic implications. Furthermore, the present study revealed factors associated with changes in RVFAC, and their effect on prognosis. There are only a few reports on the clinical significance of RV function changes in HF patients.14,15 Improvement of RV dysfunction determined by TAPSE is associated with better survival in HF patients with reduced ejection fraction.14 Development of RV dysfunction measured by RVFAC is associated with higher mortality in patients with HF with preserved ejection fraction.15 Our data provide direct evidence to support the notion that the change of RV function during follow up may directly affect the prognosis of patients with HF.
The right ventricle is affected by pressure and volume overload, ischemia, pericardial constraint and myocardial disease.16 In the present study, the pulmonary artery systolic pressure determined by echocardiography was higher in the preserved or reduced/worsened RVFAC group. Moderate to severe pulmonary hypertension can lead to RV ischemia and further exacerbate ventricular dysfunction.17 In general, the right ventricle is more adapted to volume overload than pressure overload, but recent studies have shown that prolonged volume overload may develop RV dysfunction.18,19 Moreover, the development of RV dysfunction is not independently related to the degree of LV systolic dysfunction, but it is strongly associated with diastolic dysfunction.20 In the present study, CKD was found to be a predictor of preserved or reduced/worsened RVFAC. It has also been reported that diastolic dysfunction worsens as CKD progresses.21,22 CKD has been reported to be associated with LV remodeling and adverse prognosis,23,24 and with RV dysfunction25,26 in HF patients. Therefore, we speculated that CKD-induced diastolic dysfunction and volume overload may be involved in the development of RV dysfunction. In addition, anemia has been reported to be associated with cardiac remodeling and adverse prognosis in HF patients.24,27 HF patients are prone to develop anemia with impaired iron utilization and bone marrow function due to renal dysfunction, as well as activation of neurohormones and inflammatory cytokines.28 Therefore, we speculated that RV dysfunction might develop due to the increased workload of the myocardium caused by CKD and anemia.
Sleep-disordered breathing and chronic obstructive pulmonary disease have been reported to be associated with RV overload, RV remodeling and adverse prognosis in HF patients.27,29 Unexpectedly, these diseases were not significantly associated with worsening RV function in the present study. We could not explain the reason of such results; however, appropriate treatment for these diseases might be associated with a lack of development of RV dysfunction.13,30 Moreover, it has been reported that the development of RV dysfunction is linked to new-onset atrial fibrillation and coronary artery disease.15 In contrast, no association was found for comorbid atrial fibrillation and coronary artery disease in the present study.
Strengths and Limitations
The strength of the present study is the larger number of patients and the longer follow-up period compared to previous studies.14,15 Furthermore, many factors such as comorbidity, medication, laboratory data, and echocardiographic data were considered in this study.
The present study has several limitations. First, as a prospective cohort study of a single center and having a low number of study participants for the group of preserved or reduced/worsened RVFAC compared to the other groups, the present study results may not be representative of the general population. Second, we could not perform the second examination of RVFAC on all patients who had undergone the first examination because some were lost to follow up and/or there was occurrence of events before the second examination, and selection bias could not be fully denied. Additionally, the time periods between the first and second examinations were different for each patient because of hope of the patient and/or attending physician, and there were some patients who experienced cardiac events the before second examination. Third, we did not measure other RV functional parameters (i.e., TAPSE, TV s’, RV strain), did not utilize ultrasound enhancing agents, and did not perform cardiac magnetic resonance imaging. In addition, RVFAC has a limited inter- and intra-observer reproducibility and arrythmias can interfere with the measurement of RVFAC. Finally, the present study included only variables relating to hospitalization for decompensated HF, and we did not take into consideration changes in medications or treatments, other than RVFAC. Therefore, the present study results should be viewed as preliminary, and further studies with larger populations and more frequent measurements of RVFAC, TAPSE, TV s’ and RV strain are needed.
Conclusions
Changes in RVFAC were associated with post-discharge prognosis in hospitalized heart failure patients. Development of right ventricular dysfunction can be predicted by the presence of CKD and anemia.
Acknowledgments
The authors acknowledge the efforts of Ms. Kumiko Watanabe and Ms. Yumi Yoshihisa for their outstanding technical assistance.
Sources of Funding
This work was supported, in part, by a JSPS KAKENHI grant (20K07828) to A.Y.
Disclosures
Y.T. is a member of Circulation Journal’s Editorial Team. The other authors have no conflicts of interest to declare.
IRB Information
This research plan was approved by the institutional review board of Fukushima Medical University (approval number:826).
Data Availability
The deidentified participant data will not be shared.
References
- 1.
Lupón J, Gavidia-Bovadilla G, Ferrer E, de Antonio M, Perera-Lluna A, López-Ayerbe J, et al. Dynamic trajectories of left ventricular ejection fraction in heart failure. J Am Coll Cardiol 2018; 72: 591–601, doi:10.1016/j.jacc.2018.05.042.
- 2.
Yoshihisa A, Sato Y, Kanno Y, Takiguchi M, Yokokawa T, Abe S, et al. Prognostic impacts of changes in left ventricular ejection fraction in heart failure patients with preserved left ventricular ejection fraction. Open Heart 2020; 7: e001112, doi:10.1136/openhrt-2019-001112.
- 3.
Lupón J, Gavidia-Bovadilla G, Ferrer E, de Antonio M, Perera-Lluna A, López-Ayerbe J, et al. Heart failure with preserved ejection fraction infrequently evolves toward a reduced phenotype in long-term survivors. Circ Heart Fail 2019; 12: e005652, doi:10.1161/circheartfailure.118.005652.
- 4.
de Groote P, Millaire A, Foucher-Hossein C, Nugue O, Marchandise X, Ducloux G, et al. Right ventricular ejection fraction is an independent predictor of survival in patients with moderate heart failure. J Am Coll Cardiol 1998; 32: 948–954, doi:10.1016/s0735-1097(98)00337-4.
- 5.
Ghio S, Gavazzi A, Campana C, Inserra C, Klersy C, Sebastiani R, et al. Independent and additive prognostic value of right ventricular systolic function and pulmonary artery pressure in patients with chronic heart failure. J Am Coll Cardiol 2001; 37: 183–188, doi:10.1016/s0735-1097(00)01102-5.
- 6.
Meyer P, Filippatos GS, Ahmed MI, Iskandrian AE, Bittner V, Perry GJ, et al. Effects of right ventricular ejection fraction on outcomes in chronic systolic heart failure. Circulation 2010; 121: 252–258, doi:10.1161/circulationaha.109.887570.
- 7.
Hoette S, Creuzé N, Günther S, Montani D, Savale L, Jaïs X, et al. RV fractional area change and TAPSE as predictors of severe right ventricular dysfunction in pulmonary hypertension: A CMR study. Lung 2018; 196: 157–164, doi:10.1007/s00408-018-0089-7.
- 8.
Anavekar NS, Gerson D, Skali H, Kwong RY, Yucel EK, Solomon SD. Two-dimensional assessment of right ventricular function: An echocardiographic-MRI correlative study. Echocardiography 2007; 24: 452–456, doi:10.1111/j.1540-8175.2007.00424.x.
- 9.
McDonagh TA, Metra M, Adamo M, Gardner RS, Baumbach A, Böhm M, et al. Corrigendum to: 2021 ESC Guidelines for the diagnosis and treatment of acute and chronic heart failure: Developed by the Task Force for the diagnosis and treatment of acute and chronic heart failure of the European Society of Cardiology (ESC) With the special contribution of the Heart Failure Association (HFA) of the ESC. Eur Heart J 2021; 42: 4901, doi:10.1093/eurheartj/ehab670.
- 10.
Hollenberg SM, Warner Stevenson L, Ahmad T, Amin VJ, Bozkurt B, Butler J, et al. 2019 ACC expert consensus decision pathway on risk assessment, management, and clinical trajectory of patients hospitalized with heart failure: A report of the American College of Cardiology Solution Set Oversight Committee. J Am Coll Cardiol 2019; 74: 1966–2011, doi:10.1016/j.jacc.2019.08.001.
- 11.
Rudski LG, Lai WW, Afilalo J, Hua L, Handschumacher MD, Chandrasekaran K, et al. Guidelines for the echocardiographic assessment of the right heart in adults: A report from the American Society of Echocardiography endorsed by the European Association of Echocardiography, a registered branch of the European Society of Cardiology, and the Canadian Society of Echocardiography. J Am Soc Echocardiogr 2010; 23: 685–713; quiz 786–788, doi:10.1016/j.echo.2010.05.010.
- 12.
von Elm E, Altman DG, Egger M, Pocock SJ, Gøtzsche PC, Vandenbroucke JP. Strengthening the Reporting of Observational Studies in Epidemiology (STROBE) statement: Guidelines for reporting observational studies. BMJ 2007; 335: 806–808, doi:10.1136/bmj.39335.541782.AD.
- 13.
Yoshihisa A, Takiguchi M, Shimizu T, Nakamura Y, Yamauchi H, Iwaya S, et al. Cardiovascular function and prognosis of patients with heart failure coexistent with chronic obstructive pulmonary disease. J Cardiol 2014; 64: 256–264, doi:10.1016/j.jjcc.2014.02.003.
- 14.
Dini FL, Carluccio E, Simioniuc A, Biagioli P, Reboldi G, Galeotti GG, et al. Right ventricular recovery during follow-up is associated with improved survival in patients with chronic heart failure with reduced ejection fraction. Eur J Heart Fail 2016; 18: 1462–1471, doi:10.1002/ejhf.639.
- 15.
Obokata M, Reddy YNV, Melenovsky V, Pislaru S, Borlaug BA. Deterioration in right ventricular structure and function over time in patients with heart failure and preserved ejection fraction. Eur Heart J 2019; 40: 689–697, doi:10.1093/eurheartj/ehy809.
- 16.
Haddad F, Doyle R, Murphy DJ, Hunt SA. Right ventricular function in cardiovascular disease, part II: Pathophysiology, clinical importance, and management of right ventricular failure. Circulation 2008; 117: 1717–1731, doi:10.1161/circulationaha.107.653584.
- 17.
Ogihara Y, Yamada N, Dohi K, Matsuda A, Tsuji A, Ota S, et al. Utility of right ventricular Tei-index for assessing disease severity and determining response to treatment in patients with pulmonary arterial hypertension. J Cardiol 2014; 63: 149–153, doi:10.1016/j.jjcc.2013.07.002.
- 18.
Davlouros PA, Niwa K, Webb G, Gatzoulis MA. The right ventricle in congenital heart disease. Heart 2006; 9(Suppl 1): i27–i38, doi:10.1136/hrt.2005.077438.
- 19.
Messika-Zeitoun D, Thomson H, Bellamy M, Scott C, Tribouilloy C, Dearani J, et al. Medical and surgical outcome of tricuspid regurgitation caused by flail leaflets. J Thorac Cardiovasc Surg 2004; 128: 296–302, doi:10.1016/j.jtcvs.2004.01.035.
- 20.
Enriquez-Sarano M, Rossi A, Seward JB, Bailey KR, Tajik AJ. Determinants of pulmonary hypertension in left ventricular dysfunction. J Am Coll Cardiol 1997; 29: 153–159, doi:10.1016/s0735-1097(96)00436-6.
- 21.
Lai AC, Bienstock SW, Sharma R, Skorecki K, Beerkens F, Samtani R, et al. A personalized approach to chronic kidney disease and cardiovascular disease: JACC review topic of the week. J Am Coll Cardiol 2021; 77: 1470–1479, doi:10.1016/j.jacc.2021.01.028.
- 22.
de Bie MK, Ajmone Marsan N, Gaasbeek A, Bax JJ, Groeneveld M, Gabreels BA, et al. Left ventricular diastolic dysfunction in dialysis patients assessed by novel speckle tracking strain rate analysis: Prevalence and determinants. Int J Nephrol 2012; 2012: 963504, doi:10.1155/2012/963504.
- 23.
Redfield MM. Heart failure with preserved ejection fraction. N Engl J Med 2016; 375: 1868–1877, doi:10.1056/NEJMcp1511175.
- 24.
Samson R, Jaiswal A, Ennezat PV, Cassidy M, Le Jemtel TH. Clinical phenotypes in heart failure with preserved ejection fraction. J Am Heart Assoc 2016; 5: e002477, doi:10.1161/JAHA.115.002477.
- 25.
Butcher SC, Fortuni F, Dietz MF, Prihadi EA, van der Bijl P, Ajmone Marsan N, et al. Renal function in patients with significant tricuspid regurgitation: Pathophysiological mechanisms and prognostic implications. J Intern Med 2021; 290: 715–727, doi:10.1111/joim.13312.
- 26.
Mukherjee M, Sharma K, Madrazo JA, Tedford RJ, Russell SD, Hays AG. Right-sided cardiac dysfunction in heart failure with preserved ejection fraction and worsening renal function. Am J Cardiol 2017; 120: 274–278, doi:10.1016/j.amjcard.2017.04.019.
- 27.
Senni M, Paulus WJ, Gavazzi A, Fraser AG, Diez J, Solomon SD, et al. New strategies for heart failure with preserved ejection fraction: The importance of targeted therapies for heart failure phenotypes. Eur Heart J 2014; 35: 2797–2815, doi:10.1093/eurheartj/ehu204.
- 28.
Anand IS. Anemia and chronic heart failure implications and treatment options. J Am Coll Cardiol 2008; 52: 501–511, doi:10.1016/j.jacc.2008.04.044.
- 29.
Miyata M, Yoshihisa A, Yamauchi H, Owada T, Sato T, Suzuki S, et al. Impact of sleep-disordered breathing on myocardial damage and metabolism in patients with chronic heart failure. Heart Vessels 2015; 30: 318–324, doi:10.1007/s00380-014-0479-6.
- 30.
Yoshihisa A, Suzuki S, Yamauchi H, Sato T, Oikawa M, Kobayashi A, et al. Beneficial effects of positive airway pressure therapy for sleep-disordered breathing in heart failure patients with preserved left ventricular ejection fraction. Clin Cardiol 2015; 38: 413–421, doi:10.1002/clc.22412.