Abstract
Background: Brugada syndrome is a potential cause of sudden cardiac death (SCD) and is characterized by a distinct ECG, but not all patients with A Brugada ECG develop SCD. In this study we sought to examine if an artificial intelligence (AI) model can predict a previous or future ventricular fibrillation (VF) episode from a Brugada ECG.
Methods and Results: We developed an AI-enabled algorithm using a convolutional neural network. From 157 patients with suspected Brugada syndrome, 2,053 ECGs were obtained, and the dataset was divided into 5 datasets for cross-validation. In the ECG-based evaluation, the precision, recall, and F1
score were 0.79±0.09, 0.73±0.09, and 0.75±0.09, respectively. The average area under the receiver-operating characteristic curve (AUROC) was 0.81±0.09. On per-patient evaluation, the AUROC was 0.80±0.07. This model predicted the presence of VF with a precision of 0.93±0.02, recall of 0.77±0.14, and F1
score of 0.81±0.11. The negative predictive value was 0.94±0.11 while its positive predictive value was 0.44±0.29.
Conclusions: This proof-of-concept study showed that an AI-enabled algorithm can predict the presence of VF with a substantial performance. It implies that the AI model may detect a subtle ECG change that is undetectable by humans.
Brugada syndrome is a hereditary disease that causes sudden death, mainly in working-age men. Both electrical and pathological abnormalities, especially in the right ventricular outflow tract, are believed to be arrhythmogenic substrates for specific ECG abnormalities, ventricular fibrillation (VF), or sudden cardiac death (SCD). The incidence of Brugada ECG in the general population is not uncommon, and is reported to be 0–0.94% in the East Asia region.1,2 Although not all patients with Brugada ECG will develop SCD, the annual incidence is ≈0.3–0.9% in asymptomatic patients.1–6 Although implantable cardioverter defibrillator (ICD) is the only proven measure for the prevention of SCD, its effect on patients’ quality of life is significant, because of the risk of adverse events and inappropriate shock delivery. Therefore, the indication for ICD must be fully considered, especially in low-risk patients.7 The key question is which patients are at high risk of SCD and would benefit most from ICD treatment. However, such a risk stratification system is not fully established.8 Although the coved-type ECG pattern is well known as high risk, it is not a necessary and sufficient condition to predict prognosis. Given the nature of the electrical background of Brugada syndrome, it is possible that some other ECG abnormalities may be present during sinus rhythm that cannot be recognized by the human eye. Recently, machine-learning technologies have emerged and are being utilized in the medical field.9,10 Artificial intelligence (AI)-based ECG analyses have provided promising results in the detection of cardiac abnormalities.11–13 Therefore, we hypothesized that it might be possible to stratify the SCD risk in Brugada patients by using AI. In this proof-of-concept study, we investigated whether machine learning could predict the occurrence of fatal arrhythmias using the 12-lead ECG.
Methods
Data Description
Of the 170 consecutive patients who visited hospital between 2005 and 2021 with suspected Brugada syndrome, 157 were included, excluding those with a ventricular pacing rhythm, those whose diagnosis was apparently not Brugada syndrome but idiopathic VF, and those with missing data. For these 157 patients, a 12-lead ECG was recorded at each outpatient visit and stored as electronic media. The hospital’s medical recording system is capable of exporting these stored ECGs in CSV format, and we collected them to form a dataset.
Fatal arrhythmia was defined as VF recorded during appropriate shock delivery of an ICD or automated external defibrillator, or recorded by an ECG monitor in an emergency setting. Patients with a history of fatal arrhythmias or those who developed fatal arrhythmias during the follow-up period were considered positive for fatal arrhythmias. ECGs obtained from the positive group were defined as positive ECGs and those obtained from patients without a history of fatal arrhythmias were defined as negative ECGs. For patient background, we collected data on age, sex, family history of SCD, Brugada ECG type, QRS fragmentation and J-wave in any lead, and antiarrhythmic medication. The definition of the ECG type was based on previous reports.2,3 The diagnosis of Brugada syndrome was based on ECGs and no genotype analysis was performed.
A 12-lead ECG was recorded for 10 s at a bit rate of 500 Hz; that is, each ECG file was a matrix of 12×5,000 with spatial first dimension and temporal second dimension. In addition to the 4th intercostal space, some precordial leads were recorded in the 2nd and/or 3rd intercostal spaces, and these were included in the same dataset without distinction. In addition, all ECGs irrespective of the use of the muscle artifact filter were included in this dataset. ECGs obtained during the sodium-channel blocker loading tests were not included.
The datasets were randomly split into 5 datasets so that the same patient would not be included in both the training and validation datasets for 5-fold cross-validation. In each iteration, the ECGs were randomly subdivided into either the training or validation dataset with a 4 : 1 ratio in the convolutional neural network (CNN) model (Figure 1).
This research protocol was designed by the authors in accordance with the Declaration of Helsinki and approved by the Institutional Review Board of the Tokyo Medical and Dental University (approval number: M2021-046). The requirement for informed consent was waived because the data were anonymized. The information disclosure document for this study was published on the hospital’s website.
AI Model
We implemented a deep neural network using the Keras framework with a TensorFlow (Google, Mountain View, CA, USA) backend and Python (Python Software Foundation, Beaverton, OR, USA). The framework of the CNN model is illustrated in Figure 2. In this study, the ECG raw data consisting of a 12×5,000 matrix were fed to the model. The network was composed of 2 convolution layers with a kernel size of 3×3, a batch-normalization layer for normalization of the data distribution, and a non-linear rectified linear unit (ReLU) activation function to provide nonlinearity for the model. These 2-dimensional convolutions are expected to be effective for analyzing inter-lead information such as V1-V2-V3. The output was then fed to 2 dense layers using an intervening batch-normalization layer with ReLU activation. The final output layer was activated using the softmax function, which generated the probability of each class. The training dataset was fed into the network, and the network weights were updated using the RMSprop optimizer with binary cross-entropy as the loss function. After each epoch, the network was tested by using an internal validation dataset. The network hyperparameters, batch, and step size were also tuned during this process and the network with the lowest loss value was selected once the loss value in the validation set stopped decreasing for the following 12 epochs.

In the 5-fold cross-validation, 1 of the 5 folds that was not used for the training and validation process was used to assess the ability of the AI-enabled model to predict the occurrence of fatal arrhythmia. The performance of the CNN model was assessed according to the receiver-operating characteristic (ROC) curve, area under the curve (AUC), accuracy, precision, recall, and the F1
score. Because of the small number of positive cases and bias in the distribution of data in this dataset, a weighted average was used for precision, recall, and F1
score. The F1
score is the harmonic mean of the precision and recall. We used confusion matrices to evaluate the predictive performance for fatal arrhythmias. In addition to the per-ECG evaluation, the AI model was tested on a per-patient basis. For the per-patient analysis, all ECGs obtained from each patient were analyzed using the AI model, and the percentage of ECGs that the model predicted as positive was calculated. A ROC curve was drawn to evaluate the threshold of the percentage of positive ECGs to predict the positive patients. A unique threshold was determined in each iteration prior to calculating the metrics. As a comparator of the performance of this AI model, the widely used risk stratification scoring system, the Sieira score, was used in a retrospective manner.14
Explainable Model
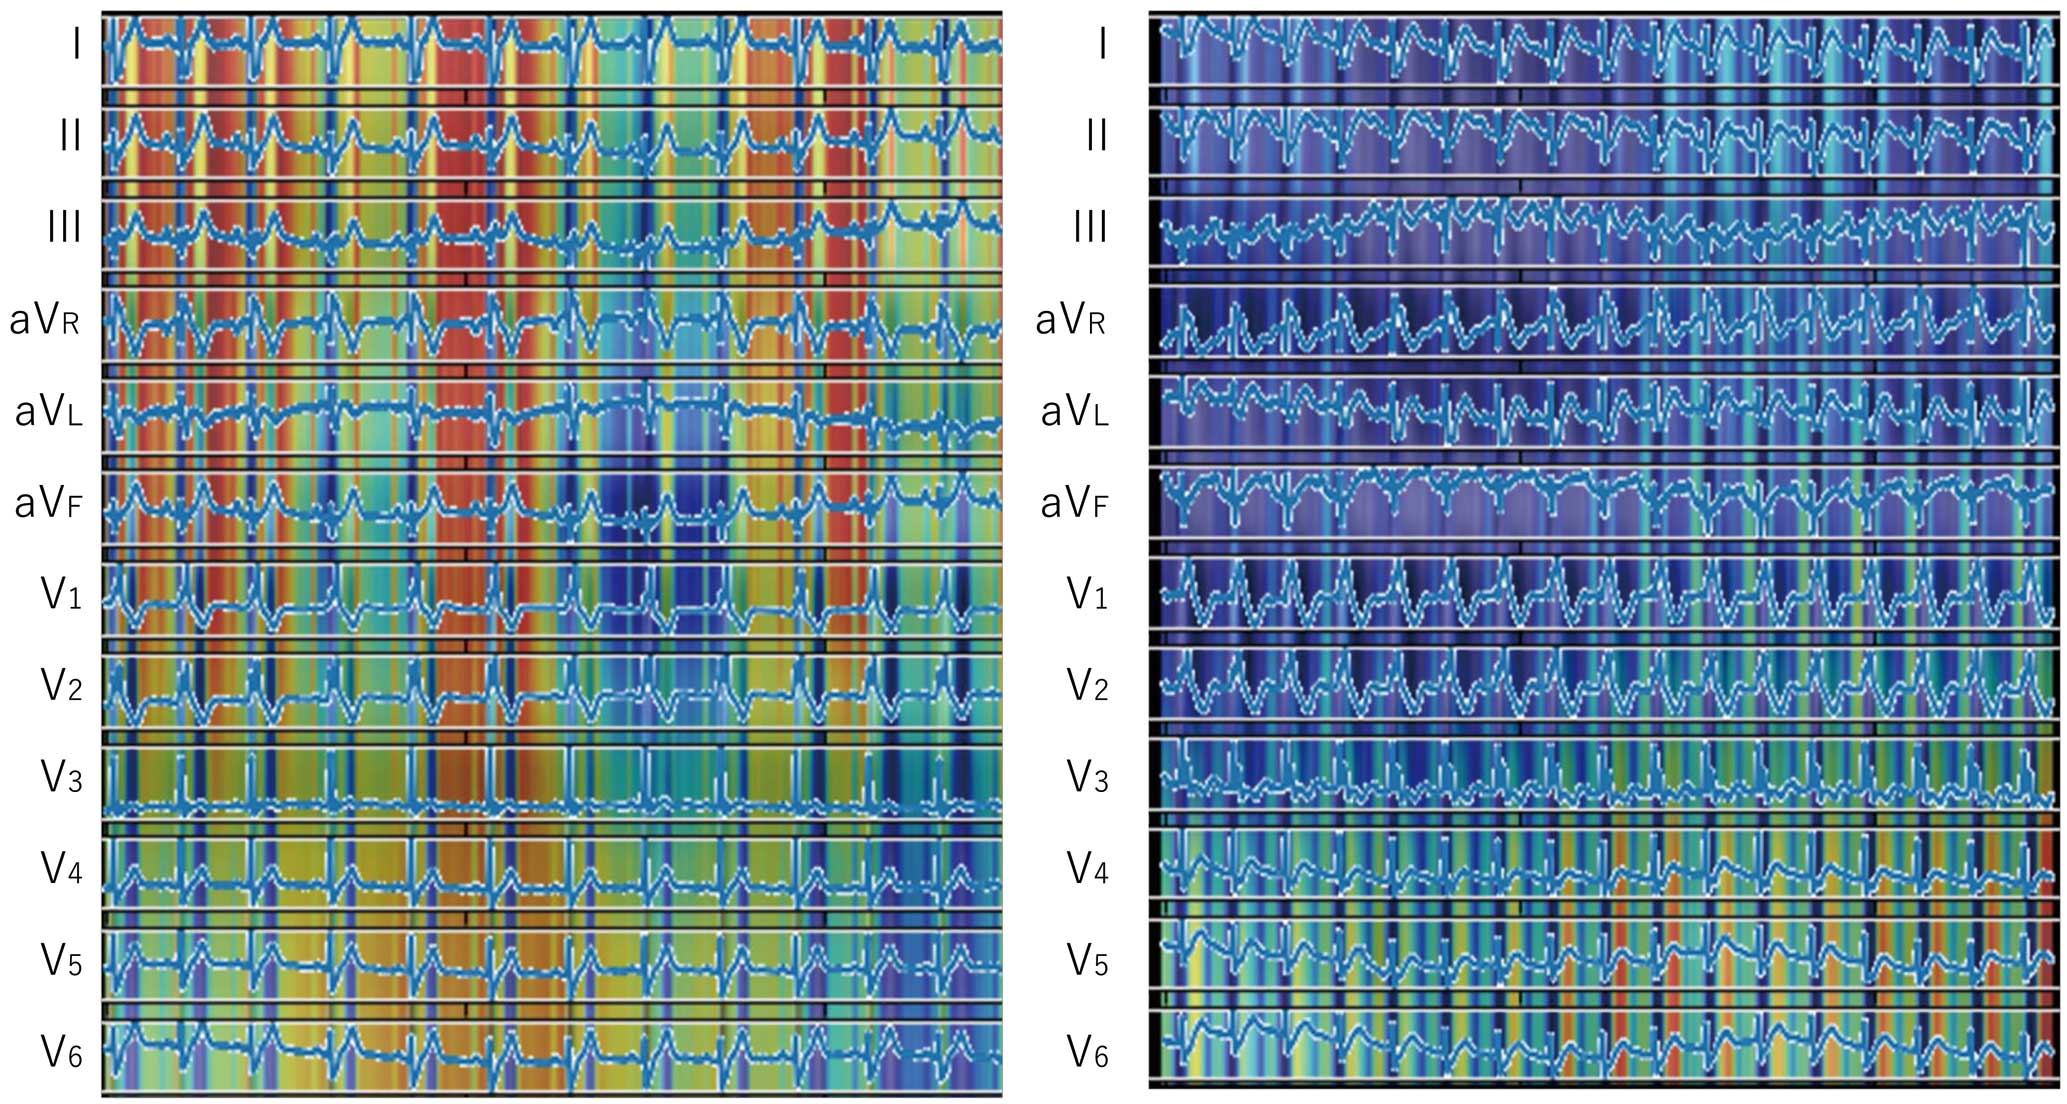
To evaluate the weights of the data contributed to the predictions, saliency maps using the Grad-CAM were drawn. The gradient of the last activation layer was shown as a heat map and overlaid with a 12-lead ECG created separately for comprehensibility.
Results
Study Population
Of the 157 patients included in the study, 16 were labeled as positive and of them 15 had a history of fatal arrhythmias prior to their first visit, and 12 had at least 1 fatal arrhythmia episode during the follow-up period; 11 experienced fatal arrhythmia both prior and during the follow-up. The mean age at enrollment was 44.8±14.8 years, and the mean follow-up period from the first visit to the onset of arrhythmic event or the final follow-up was 1,271±1,861 days. There were 12 patients taking antiarrhythmic drugs at any period, and 3 patients underwent catheter ablation for Brugada syndrome; they were included in the dataset without any distinction. The patients’ characteristics for each dataset are shown in Table 1. A total of 2,053 ECGs were obtained from the 157 patients, and of them 549 ECGs from 16 positive patients were labeled as positive ECGs.
Table 1. Patients’ Characteristics
| |
All |
FOLD1 |
FOLD2 |
FOLD3 |
FOLD4 |
FOLD5 |
| n |
157 |
31 |
31 |
31 |
32 |
32 |
| Age (years) |
44.8±14.8 |
41.5±16.3 |
47.1±13.9 |
45.6±15.3 |
43.5±12.1 |
46.4±15.3 |
| Male |
142 (90.4%) |
27 (87.1%) |
28 (90.3%) |
28 (90.3%) |
28 (87.5%) |
31 (96.9%) |
| Family history of SCD |
38 (24.2%) |
7 (22.6%) |
7 (22.6%) |
7 (22.6%) |
8 (25.0%) |
9 (28.1%) |
| Syncope |
47 (29.9%) |
7 (22.6%) |
11 (35.5%) |
8 (25.8%) |
10 (31.3%) |
11 (34.4%) |
| Aborted SCD |
15 (9.6%) |
3 (9.7%) |
4 (12.9%) |
3 (9.7%) |
3 (9.4%) |
2 (6.3%) |
| Brugada ECG type at first visit |
| 1 |
86 (54.8%) |
17 (54.8%) |
16 (51.6%) |
14 (45.2%) |
18 (56.3%) |
21 (65.6%) |
| 2/3 |
71 (45.2%) |
14 (45.2%) |
15 (48.4%) |
17 (54.8%) |
14 (43.8%) |
11 (34.4%) |
| QRS fragmentation |
35 (22.3%) |
5 (16.1%) |
3 (9.7%) |
8 (25.8%) |
15 (46.9%) |
4 (12.5%) |
| J-wave |
133 (84.7%) |
23 (74.2%) |
28 (90.3%) |
26 (83.9%) |
27 (84.4%) |
29 (90.6%) |
| Antiarrhythmics |
12 (7.6%) |
4 (12.9%) |
1 (3.2%) |
2 (6.5%) |
2 (6.3%) |
3 (9.4%) |
| Fatal arrhythmia during follow-up |
12 (7.6%) |
3 (9.7%) |
2 (6.5%) |
2 (6.5%) |
3 (9.4%) |
2 (6.3%) |
| Follow-up (days) |
1,271±1,861 |
1,671±2,324 |
931±1,367 |
1,356±1,940 |
1,158±1,738 |
1,244±1,729 |
ECG, electrocardiogram; SCD, sudden cardiac death.
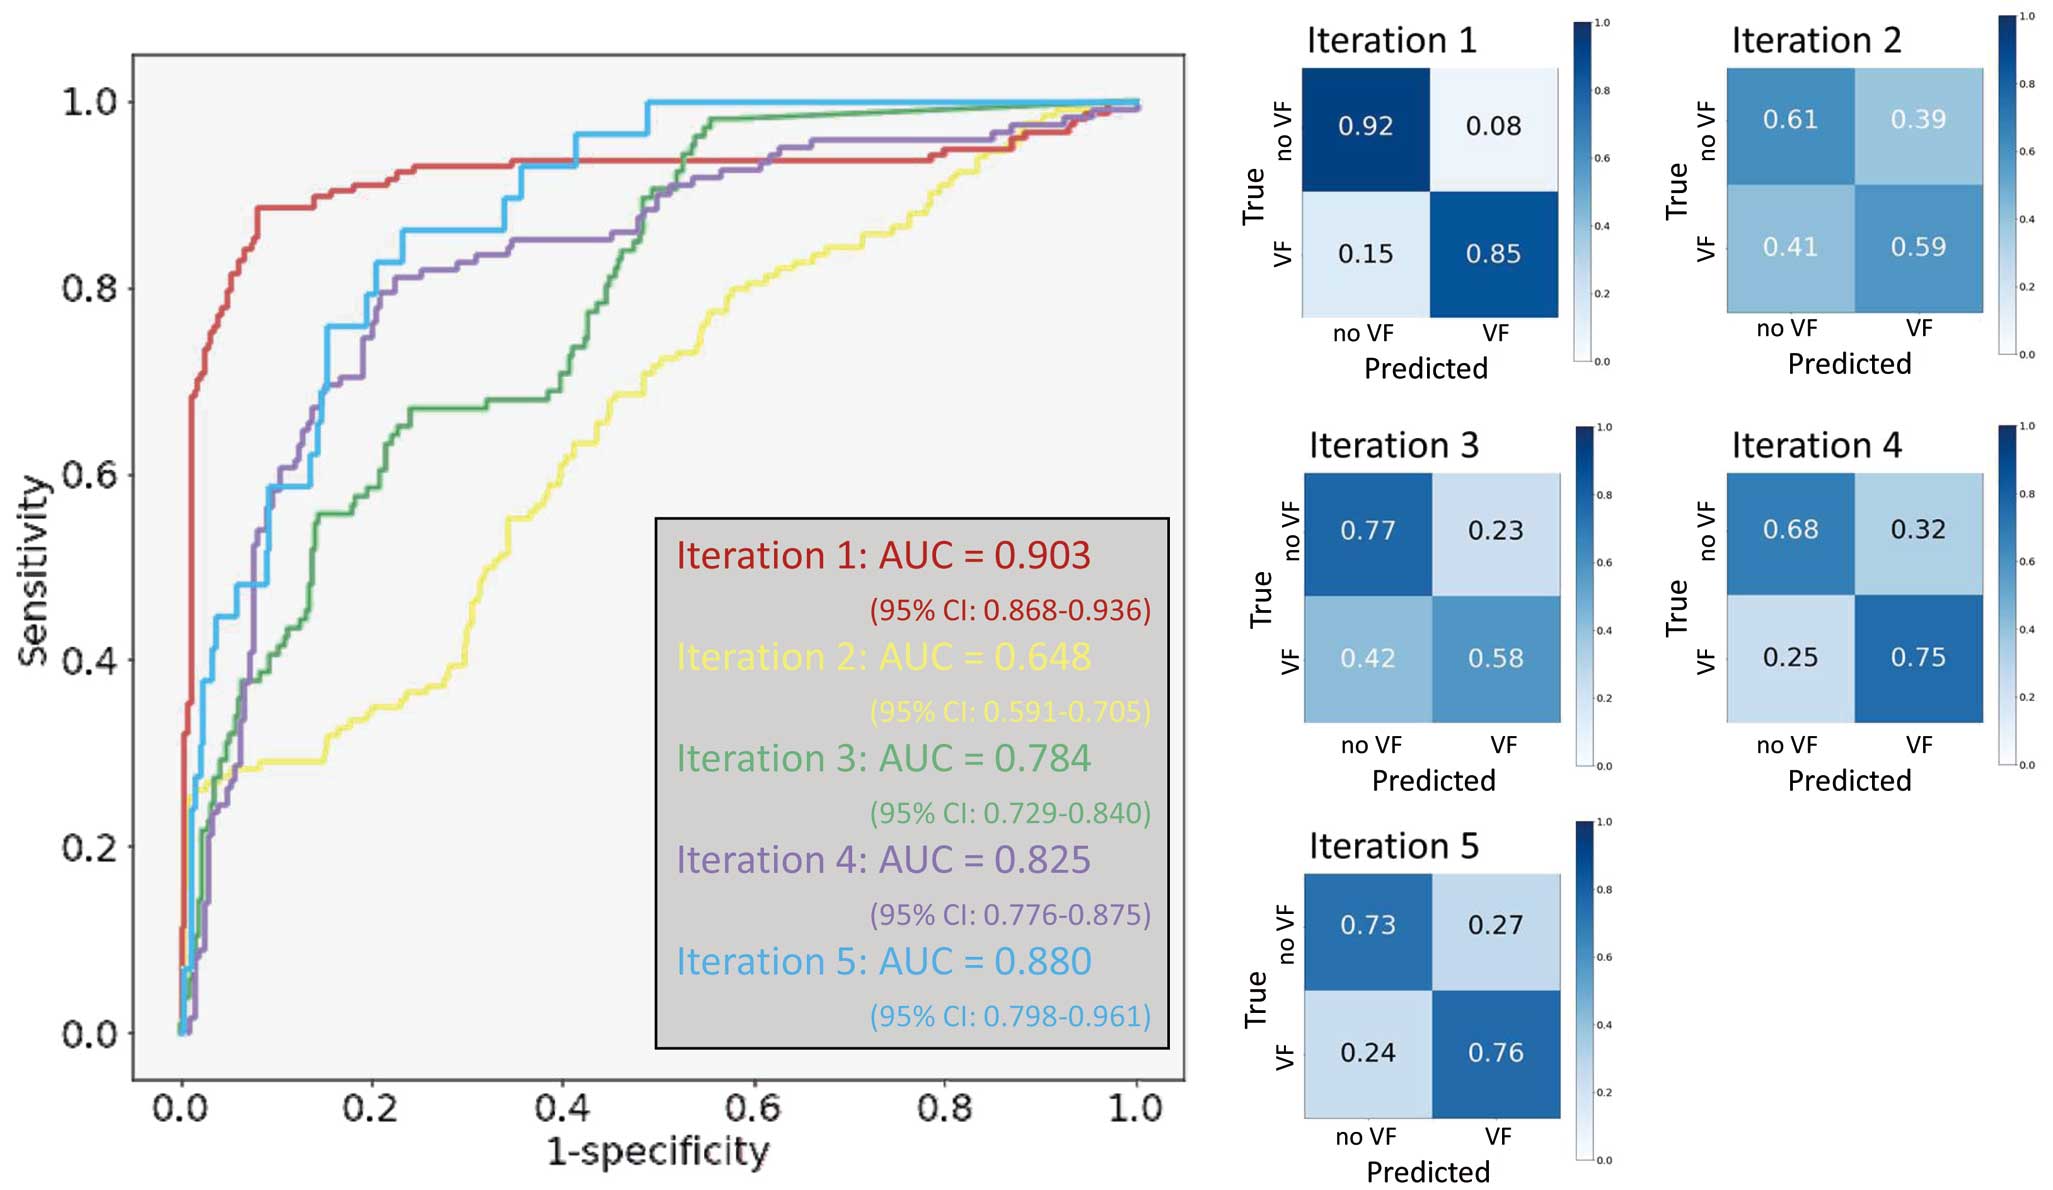
The diagnostic performance of the model is presented in Table 2, and the confusion matrices and ROC curves are shown in Figure 3. On the per-ECG analysis, the AI model was able to predict previous or future occurrence of fatal arrhythmias with an accuracy of 0.73±0.09, weighted-average precision of 0.79±0.09, recall of 0.73±0.09, and F1
score of 0.75±0.09. The positive predictive value (PPV) was 0.49±0.22 and the negative predictive value (NPV) was 0.87±0.06. The ROC curve for this AI model had an AUC of 0.81±0.09 (range, 0.65 (95% confidence interval (95% CI): 0.59–0.71) to 0.90 (95% CI: 0.87–0.94)). The performance varied among iterations because of the small number of positive samples, but overall, it showed a high NPV and relatively low PPV, which fits the essential purpose of the model to not overlook evitable deaths.
Table 2. Diagnostic Metrics
| |
Accuracy |
Weighted average |
PPV |
NPV |
| Precision |
Recall |
F1 score |
| ECG basis |
| Iteration 1 |
0.89 |
0.90 |
0.90 |
0.90 |
0.86 |
0.92 |
| Iteration 2 |
0.60 |
0.68 |
0.61 |
0.63 |
0.37 |
0.79 |
| Iteration 3 |
0.68 |
0.75 |
0.72 |
0.73 |
0.47 |
0.85 |
| Iteration 4 |
0.72 |
0.73 |
0.71 |
0.71 |
0.58 |
0.83 |
| Iteration 5 |
0.74 |
0.91 |
0.73 |
0.79 |
0.19 |
0.97 |
| Average |
0.73±0.09 |
0.79±0.09 |
0.73±0.09 |
0.75±0.09 |
0.49±0.22 |
0.87±0.06 |
| Patient basis |
| Iteration 1 |
0.97 |
0.97 |
0.97 |
0.97 |
1.00 |
0.97 |
| Iteration 2 |
0.56 |
0.92 |
0.56 |
0.65 |
0.18 |
1.00 |
| Iteration 3 |
0.87 |
0.94 |
0.87 |
0.89 |
0.43 |
1.00 |
| Iteration 4 |
0.71 |
0.91 |
0.71 |
0.76 |
0.31 |
0.71 |
| Iteration 5 |
0.74 |
0.93 |
0.74 |
0.79 |
0.27 |
1.00 |
| Average |
0.77±0.14 |
0.93±0.02 |
0.77±0.14 |
0.81±0.11 |
0.44±0.29 |
0.94±0.11 |
ECG, electrocardiogram; NPV, negative predictive value; PPV, positive predictive value.
The results of the per-patient analysis are summarized in Table 2 and Figure 4. Patients with fatal arrhythmias at any point in their life were predicted to be positive with an accuracy of 0.77±0.14, weighted-average precision of 0.93±0.02, recall of 0.77±0.14, and F1
score of 0.81±0.11. The PPV was 0.44±0.29 and the NPV was 0.94±0.11. The ROC curves had an AUC of 0.80±0.07 (range, 0.68 (90%CI: 0.38–0.97) to 0.86 (90%CI: 0.63–1.00). The number of ECGs obtained per patient and the percentage of ECGs that were predicted as positive are shown in the Supplementary Table. It that the percentage of correct predictions appeared to increase as the number of obtained ECGs increased. With risk stratification using the Sieira scoring system, a score of ≥2 is generally considered to show risk for SCD, and when this score was adopted, the accuracy was 0.554, precision was 0.146, recall was 1.000, F1
score was 0.255, PPV 0.146 and NPV 1.000. When the cutoff was changed to ≥5 points, the accuracy was 0.930, precision was 0.522, recall was 1.000, F1
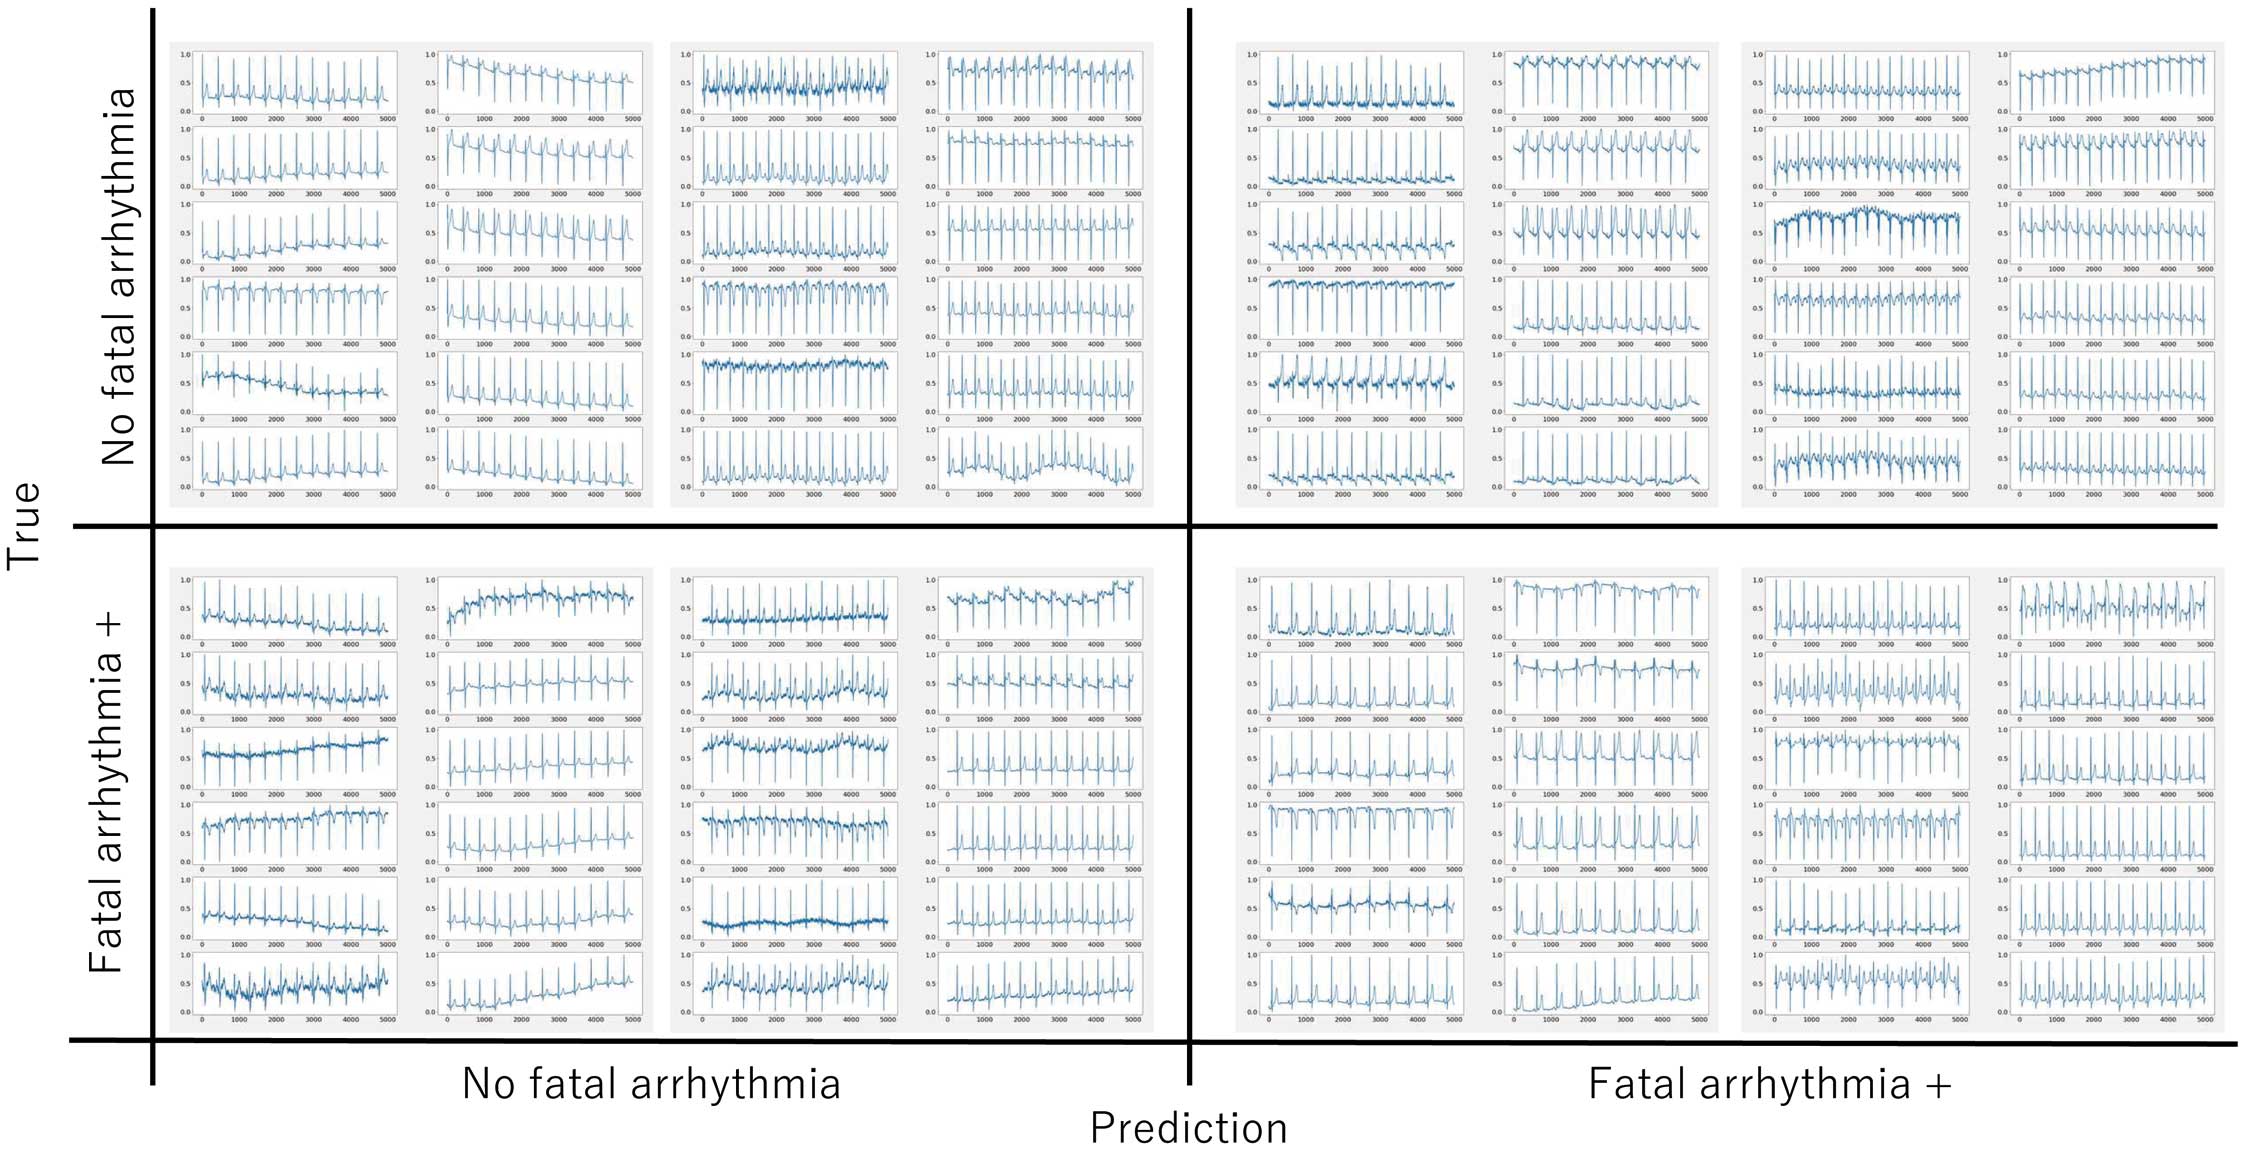
score was 0.686, PPV 0.522 and NPV 1.000, which were comparable with the AI model. Representative ECGs that the AI model correctly predicted as positive or negative and those that the AI model was unable to predict correctly are displayed in Figure 5. The model predicted an ECG as negative despite showing a type 1 Brugada ECG and as positive despite showing a non-type 1 Brugada ECG. It is clear that the model predicted the outcome based not only on the ECG type. Examples of saliency maps of true-positive ECGs are given in Figure 6. Although the leads that influenced the prediction differed, there was a consistent focus on diastolic information. Note that although these maps seem to focus on individual leads, the model in this study uses 3-by-3 convolutions across the leads, and thus the relationship between the leads was taken into account.

Discussion
Appropriate risk assessment is of paramount importance for the care of patients with Brugada syndrome. Risk stratification strategies have been primarily based on the patient’s background. Moreover, predicting the occurrence of fatal arrhythmias solely from ECG is difficult, even for skilled electrophysiologists. Other patient background information, such as family history of SCD,15 and previous syncopal episodes, is associated with morbidity of fatal arrhythmias, but an accurate predictive system using these risk factors is still not established.16,17 Well-known scoring systems for Brugada syndrome include the Shanghai score and the Sieira score, which have AUROCs around 0.71–0.73.8 The present machine learning model used only ECG data and had an AUROC of ≈0.80, which may be comparable or better than conventional prediction systems. The Brugada ECG is classified into types 1–3 according to the QRS waveform, with type 1 being known to be a high risk for fatal arrhythmia. With the type 1 Brugada ECG, some patients develop fatal arrhythmias for life while others do not. It is considered that there are some electrical substrate variabilities, but it is not possible to detect them with the human eye. In a recent study, Hnatkova et al showed that QRS microfragmentation, which is imperceptible to the human eye, is strongly related to death.18 In addition, previous close observations of ECGs have shown that subtle abnormalities increase the risk of ventricular arrhythmias.19,20 The AI model developed in the present study may automatically detect these complexes and subtle ECG abnormalities. In an attempt to acquire the explainability of the model by means of a saliency map, the leads of interest were not limited to precordial leads and the model always focused on the information during the diastolic phase, which is in contrast to cardiologists, who usually tend to focus on the QRS-T segments of the anterior precordial leads. The classifier we developed in the present study is designed to determine the risk of fatal arrhythmias in patients with Brugada syndrome. This means that all ECGs in the dataset had obvious abnormalities in the QRS-T segments on the precordial leads, so additional information from other leads and other cardiac cycles might be important for risk stratification. Previous reports have suggested that T-wave amplitude and T peak-end are useful for estimating the risk, and it is thought that the present model also focused on those abnormalities.19–21 These established parameters evaluate electrical activity in the heart in a human-comprehensible manner, but they reduce the amount of information from continuous data to simple digits. One of the strengths of AI is its ability to analyze electrical activity without such information loss. Other interesting aspects of the present model are that it was able to analyze not only changes in the time axis but also differences among the leads by means of convolution across the leads. The region of interest showed periodic changes other than the heartbeat cycle, thought to be due to respiratory variability. It has been pointed out that respiration changes the positional relationship between the heart and the leads, and the tonus of the autonomic nervous system.22 Although the saliency map did not allow us to understand what portion of the diastolic information was of interest and how to interpret it, if the explainability improves, it could help to clarify even the pathophysiology of Brugada syndrome, including whether it is a repolarization or a depolarization disorder.
The objective of this grouping task was to predict the future development of fatal arrhythmias, which means that false negatives are directly associated with patients’ survival. It is important to not misinterpret positive cases as negative. In such circumstances, among the various metrics, the highest priority is given to the high NPV. In the present model, the NPV was only 0.87 on per-ECG analysis, which means that if the output from this AI model is the only determinant of the indication for ICD, approximately 1 in 10 patients with a negative diagnosis would have an avoidable death, which must not be overlooked. However, even for the same patient, minute ECG changes within the type 1 Brugada ECG appear over time.23 Therefore, it is important to make a comprehensive decision based on multiple ECGs per patient. In the per-patient analysis, all ECGs obtained from each patient were evaluated by the classifier and the percentage of ECGs that were predicted as positive was calculated. Brugada syndrome is known to have day-to-day variation on ECG, and in clinical practice it is rare to make a prognostic evaluation from a single ECG, but rather a comprehensive evaluation from multiple ECGs. Therefore, we tested the model‘s ability on a per-patient basis using multiple ECGs.
Although it is difficult for clinicians to identify those patients with type 2 or 3 Brugada ECG who will develop fatal arrhythmias in the future in the absence of other clinical information, the AI model was able to accurately detect such patients. Because the training dataset also included patients who were positive for type 2 or 3 Brugada ECGs, we assumed that some features could be learned from those ECGs.
The performance of this model is not yet able to be applied in clinical practice. However, the prognostic evaluation ability was equal to or better than that of existing scoring systems based on clinical background.8 This proves that AI can learn features that cannot be detected by the human eye, and better results can be expected with more cases and refinement of the learning method in the future.
Study Limitations
Although information obtained from the in-hospital electronic medical records was used to determine the presence or absence of fatal arrhythmias, it is possible that fatal arrhythmias occurred during the last follow-up and beyond the study period. Therefore, potential future positive cases may be included in the predicted-as-negative group. It is possible that the AI detected this, which could be the reason for the relatively high false-positives. It may be technically possible to output the risk of an arrhythmic event during any following period by including time information for training, which would have great clinical utility. However, the present study did not include time information due to the small sample size.
Generally, large amounts of data are required for training CNNs. However, in this study, only a limited number of samples were available due to the nature of the disease. To deal with the risk of overfitting, we conducted a cross-validation and in the 5-fold cross-validation, all iterations showed significant classification ability. Although this model is not trained enough to be clinically useful, it clearly proves the validity of the concept that machine learning of the Brugada ECG can be used for risk assessment.
In addition, this study was a single-center study, and the ECG data were derived from a single specific recording system. Thus, its applicability in other settings remains to be determined. In any case, even with these limitations, our hypothesis that AI can predict the presence of fatal arrhythmias from ECGs has certainly been proven.
Conclusions
An AI model that predicts the previous or future onset of fatal arrhythmias from the 12-lead ECGs of patients with Brugada ECGs showed good predictive ability. It is possible that it can detect abnormal changes that clinicians cannot detect. It is expected that future data accumulation and model improvement will lead to the development of models with even better performance.
Acknowledgments
We thank Drs. Masahiko Goya, Susumu Tao, Takuro Nishimura, Tasuku Yamamoto and Takashi Ikenouchi for data collection.
Disclosures
The authors declare that there are no conflicts of interest associated with this study. W.S. is a member of Circulation Journal’s Editorial Team.
IRB Information
This stydy was approved by the Institutional Review Board of the Tokyo Medical and Dental University (approval number: M2021-046).
Data Availability
The deidentified participant data associated with this study will not be shared.
Supplementary Files
Please find supplementary file(s);
https://doi.org/10.1253/circj.CJ-22-0496
References
- 1.
Nakano Y, Shimizu W. Brugada syndrome as a major couase of sudden cardiac death in Asians. JACC: Asia 2022; 2: 412–421.
- 2.
Marsman EMJ, Postema PG, Remme CA. Brugada syndrome: Update and future perspectives. Heart 2022; 108: 668–675, doi:10.1136/heartjnl-2020-318258.
- 3.
Brugada J, Campuzano O, Arbelo E, Sarquella-Brugada G, Brugada R. Present status of Brugada syndrome: JACC State-of-the-Art Review. J Am Coll Cardiol 2018; 72: 1046–1059, doi:10.1016/j.jacc.2018.06.037.
- 4.
Kamakura S, Ohe T, Nakazawa K, Aizawa Y, Shimizu A, Horie M, et al. Long-term prognosis of probands with Brugada-pattern ST-elevation in leads V1–V3. Circ Arrhythm Electrophysiol 2009; 2: 495–503, doi:10.1161/CIRCEP.108.816892.
- 5.
Takagi M, Aonuma K, Sekiguchi Y, Yokoyama Y, Aihara N, Hiraoka M; Japan Idiopathic Ventricular Fibrillation Study (J-IVFS) Investigators. The prognostic value of early repolarization (J wave) and ST-segment morphology after J wave in Brugada syndrome: Multicenter study in Japan. Heart Rhythm 2013; 10: 533–539, doi:10.1016/j.hrthm.2012.12.023.
- 6.
Yamagata K, Horie M, Aiba T, Ogawa S, Aizawa Y, Ohe T, et al. Genotype-phenotype correlation of SCN5A mutation for the clinical and electrocardiographic characteristics of probands with Brugada syndrome: A Japanese multicenter registry. Circulation 2017; 135: 2255–2270, doi:10.1161/CIRCULATIONAHA.117.027983.
- 7.
Nogami A, Kurita T, Abe H, Ando K, Ishikawa T, Imai K, et al. JCS/JHRS 2019 guideline on non-pharmacotherapy of cardiac arrhythmias. J Arrhythm 2021; 37: 709–870, doi:10.1002/joa3.12491.
- 8.
Probst V, Goronflot T, Anys S, Tixier R, Briand J, Berthome P, et al. Robustness and relevance of predictive score in sudden cardiac death for patients with Brugada syndrome. Eur Heart J 2021; 42: 1687–1695, doi:10.1093/eurheartj/ehaa763.
- 9.
Nakamura T, Sasano T. Artificial intelligence and cardiology: Current status and perspective. J Cardiol 2022; 79: 326–333, doi:10.1016/j.jjcc.2021.11.017.
- 10.
Varma N, Cygankiewicz I, Turakhia M, Heidbuchel H, Hu Y, Chen LY, et al. 2021 ISHNE/HRS/EHRA/APHRS collaborative statement on mHealth in Arrhythmia Management: Digital medical tools for heart rhythm professionals: From the International Society for Holter and Noninvasive Electrocardiology/Heart Rhythm Society/European Heart Rhythm Association/Asia Pacific Heart Rhythm Society. J Arrhythm 2021; 37: 271–319, doi:10.1002/joa3.12461.
- 11.
Nakamura T, Nagata Y, Nitta G, Okata S, Nagase M, Mitsui K, et al. Prediction of premature ventricular complex origins using artificial intelligence-enabled algorithms. Cardiovasc Digital Health J 2021; 1: 76–83, doi:10.1016/ j.cvdhj.2020.11.006.
- 12.
Bond R, Finlay D, Al-Zaiti SS, Macfarlane P. Machine learning with electrocardiograms: A call for guidelines and best practices for ‘stress testing’ algorithms. J Electrocardiol 2021; 69S: 1–6, doi:10.1016/j.jelectrocard.2021.07.003.
- 13.
Goto S, Kimura M, Katsumata Y, Goto S, Kamatani T, Ichihara G, et al. Artificial intelligence to predict needs for urgent revascularization from 12-leads electrocardiography in emergency patients. PLoS One 2019; 14: e0210103, doi:10.1371/journal.pone.0210103.
- 14.
Sieira J, Conte G, Ciconte G, Chierchia GB, Casado-Arroyo R, Baltogiannis G, et al. A score model to predict risk of events in patients with Brugada Syndrome. Eur Heart J 2017; 38: 1756–1763, doi:10.1093/eurheartj/ehx119.
- 15.
Rattanawong P, Kewcharoen J, Kanitsoraphan C, Barry T, Shanbhag A, Ko NL, et al. Does the age of sudden cardiac death in family members matter in Brugada syndrome? J Am Heart Assoc 2021; 10: e019788, doi:10.1161/JAHA.120.019788.
- 16.
Leong KMW, Ng FS, Jones S, Chow JJ, Qureshi N, Koa-Wing M, et al. Prevalence of spontaneous type I ECG pattern, syncope, and other risk markers in sudden cardiac arrest survivors with Brugada syndrome. Pacing Clin Electrophysiol 2019; 42: 257–264, doi:10.1111/pace.13587.
- 17.
Vitali F, Brieda A, Balla C, Pavasini R, Tonet E, Serenelli M, et al. Standard ECG in Brugada syndrome as a marker of prognosis: From risk stratification to pathophysiological insights. J Am Heart Assoc 2021; 10: e020767, doi:10.1161/JAHA.121.020767.
- 18.
Hnatkova K, Andršová I, Novotný T, Britton A, Shipley M, Vandenberk B, et al. QRS micro-fragmentation as a mortality predictor. Eur Heart J 2022; 21: ehac085, doi:10.1093/eurheartj/ehac085.
- 19.
Delinière A, Baranchuk A, Giai J, Bessiere F, Maucort-Boulch D, Defaye P, et al. Prediction of ventricular arrhythmias in patients with a spontaneous Brugada type 1 pattern: The key is in the electrocardiogram. Europace 2019; 21: 1400–1409, doi:10.1093/europace/euz156.
- 20.
Tse G, Lee S, Li A, Chang D, Li G, Zhou J, et al. Automated electrocardiogram analysis identifies novel predictors of ventricular arrhythmias in Brugada syndrome. Front Cardiovasc Med 2021; 7: 618254, doi:10.3389/fcvm.2020.618254.
- 21.
Kawazoe H, Nakano Y, Ochi H, Takagi M, Hayashi Y, Uchimura Y, et al. Risk stratification of ventricular fibrillation in Brugada syndrome using noninvasive scoring methods. Heart Rhythm 2016; 13: 1947–1954, doi:10.1016/j.hrthm.2016.07.009.
- 22.
Yamawake N, Nishizaki M, Shimizu M, Fujii H, Sakurada H, Hiraoka M. Unmasking Brugada-type electrocardiogram on deep inspiration. Circ J 2014; 78: 360–365, doi:10.1253/circj.cj-13-0576.
- 23.
Morita H, Miyamoto M, Watanabe A, Tsukuda S, Morimoto Y, Kawada S, et al. Progression of electrocardiographic abnormalities associated with initial ventricular fibrillation in asymptomatic patients with Brugada syndrome. Heart Rhythm 2018; 15: 1468–1474, doi:10.1016/j.hrthm.2018.06.035.