Abstract
Background: Side branch (SB) occlusion during bifurcation stenting is a serious complication. This study aimed to predict SB compromise (SBC) using optical coherence tomography (OCT).
Methods and Results: Among the 168 patients who enrolled in the 3D-OCT Bifurcation Registry, 111 bifurcation lesions were analyzed to develop an OCT risk score for predicting SBC. SBC was defined as worsening of angiographic SB ostial stenosis (≥90%) immediately after stenting. On the basis of OCT before stenting, geometric parameters (SB diameter [SBd], length from proximal branching point to carina tip [BP-CT length], and distance of the polygon of confluence [dPOC]) and 3-dimensional bifurcation types (parallel or perpendicular) were evaluated. SBC occurred in 36 (32%) lesions. The parallel-type bifurcation was significantly more frequent in lesions with SBC. The receiver operating characteristic curve indicated SBd ≤1.77 mm (area under the curve [AUC]=0.73, sensitivity 64%, specificity 75%), BP-CT length ≤1.8 mm (AUC=0.83, sensitivity 86%, specificity 68%), and dPOC ≤3.96 mm (AUC=0.68, sensitivity 63%, specificity 69%) as the best cut-off values for predicting SBC. To create the OCT risk score, we assigned 1 point to each of these factors. As the score increased, the frequency of SBC increased significantly (Score 0, 0%; Score 1, 8.7%; Score 2, 28%; Score 3, 58%; Score 4, 85%; P<0.0001).
Conclusions: Prediction of SBC using OCT is feasible with high probability.
Coronary bifurcation lesions are the underlying reason for percutaneous coronary intervention (PCI) procedures in 10–20% of cases.1 Side branch (SB) occlusion is a serious procedural complication in bifurcation PCI.1,2 The incidence of SB occlusion during a provisional stenting strategy, which is generally recommended for the treatment of bifurcation lesions,3 is 7–19%.2,4,5 Preprocedural risk stratification for SB compromise (SBC)/occlusion is useful for planning the stenting strategy. Predictors and mechanisms of SBC have been investigated using angiography,2,6 intravascular ultrasound (IVUS),4 and optical coherence tomography (OCT).7,8 Morphologic changes to the bifurcation segment by the implanted stent (carina and/or plaque shift) are considered the main factors for SBC after stent implantation.9
OCT is used as a guide for bifurcation PCI.10,11 OCT offers a 10-fold higher resolution than IVUS,8 providing precise measurements, and 3-dimensional (3D) reconstruction of OCT images (3D-OCT) helps clarify the spatial aspects of bifurcation and the interaction between the stent and arterial wall.12–14 Farooq et al classified the 3D appearance of SB orifice into parallel type and perpendicular type bifurcation according to the 3D-OCT findings.12 The parallel type is more likely to be associated with carina shift than the perpendicular type.12 This 3D bifurcation type can be assessed on the OCT console immediately after acquisition without any external software. Recently, the characteristics and reproducibility of this classification have been validated by comparison with 3D quantitative coronary angiography (QCA).15 Moreover, serial 3D-OCT analysis showed an eccentric morphologic change of the jailed SB orifice after main vessel (MV) stenting.16 We hypothesized that the precise size of the polygon of confluence including the SB orifice and 3D bifurcation type would be associated with and accurately predict SBC after MV stenting. Thus, we conducted a hypothesis-generating study using data from the 3D-OCT Bifurcation Registry.
Methods
Study Design
This was a substudy of the 3D-OCT Bifurcation Registry, which aimed to develop a risk stratification of SBC and to investigate morphologic changes of the SB orifice. The 3D-OCT Bifurcation Registry is a prospective multicenter observational study evaluating the efficacy of 3D-OCT for bifurcation PCI. The design of the registry has been described elsewhere.13 From August 2014 through December 2015, 168 lesions in 168 patients in the Registry underwent bifurcation PCI with an SB reference diameter ≥2.0 mm (visual assessment). Of these, to develop a risk stratification for SBC, the present substudy extracted cases that: (1) underwent OCT pullback of the MV before MV stenting; and (2) angiography immediately after the provisional MV stenting across the SB before any SB dilatation and proximal optimization technique (POT). Cases in which angiography and OCT assessment were insufficient and SB ostial stenosis was ≥90% at baseline were excluded. Moreover, to investigate the morphologic changes of the SB orifice after cross-over stenting, cases with OCT pullbacks both before and immediately after MV stenting of sufficient quality for analysis were extracted. The Registry was approved by individual institutional review boards of the participating institutes, and written informed consent was obtained from all patients.
This study was approved by the institutional review board at each site prior to enrollment and complied with the principles of the Declaration of Helsinki.
Definitions of MV, SB, and SBC
In the present study, MV was defined as the to-be-stented vessel and SB was defined as the other vessel jailed by the stent. SBC was defined as worsening of angiographic SB ostial stenosis (≥90%) immediately after MV stenting based on visual assessment by 2 observers. A disagreement in judgment required evaluation by a third observer. Bifurcations were divided into 2 groups, namely those with or without SBC (SBC and non-SBC groups, respectively), according to angiographic findings immediately after stent implantation. The OCT and angiographic images were analyzed by multiple investigators (H.A., T.F., T.O.) in a core laboratory (Yamaguchi University Graduate School of Medicine).
Angiographic and QCA Analyses
Coronary angiograms were obtained at the index procedure. Based on the Medina classification, bifurcation lesions were classified into 7 categories. A true bifurcation lesion was defined as Medina 1.1.1, 1.0.1, or 0.1.1. Off-line analyses of baseline angiograms before PCI were performed using a guiding catheter for calibration and an edge detection system (QAngio®
XA version 7.3; Medis Specials, Leiden, Netherlands). QCA was performed to measure the reference diameter, percentage diameter stenosis of each branch, and bifurcation angle on baseline angiography. Angiographic calcification was also evaluated visually.17
2D and 3D-OCT Image Analysis
The protocol for OCT image acquisition has been described previously.13 Briefly, the pullback speed during OCT acquisition prior to stent implantation was at the operator’s discretion. A contrast agent was recommended for removal of blood from the lumen in the 3D-OCT Bifurcation Registry. 3D-OCT image reconstruction, as well as 2D quantitative and qualitative analysis of OCT pullback before stenting, were performed using the dedicated AptiViewTM
off-line review workstation (Abbott Vascular, Abbott Park, IL, USA). If preprocedural OCT was not obtained due to lesion severity, OCT pullbacks after predilatation with a small balloon and/or rotablator prior to MV stenting were used for analysis. 3D-OCT bifurcation types were assessed by 3D-OCT according to previous reports.12,13,15 Briefly, the parallel type was defined as a bifurcation in which the proximal course of the SB is concealed behind the carina when viewed perpendicular to the vessel wall; the perpendicular type was defined as a bifurcation in which the SB opening is visible as an elliptical shape and not concealed by the carina (Figure 1A,B). Inter- and intraobserver agreement (kappa statistic) regarding the assessment of 3D-OCT bifurcation types was 0.88 and 0.94, respectively.15
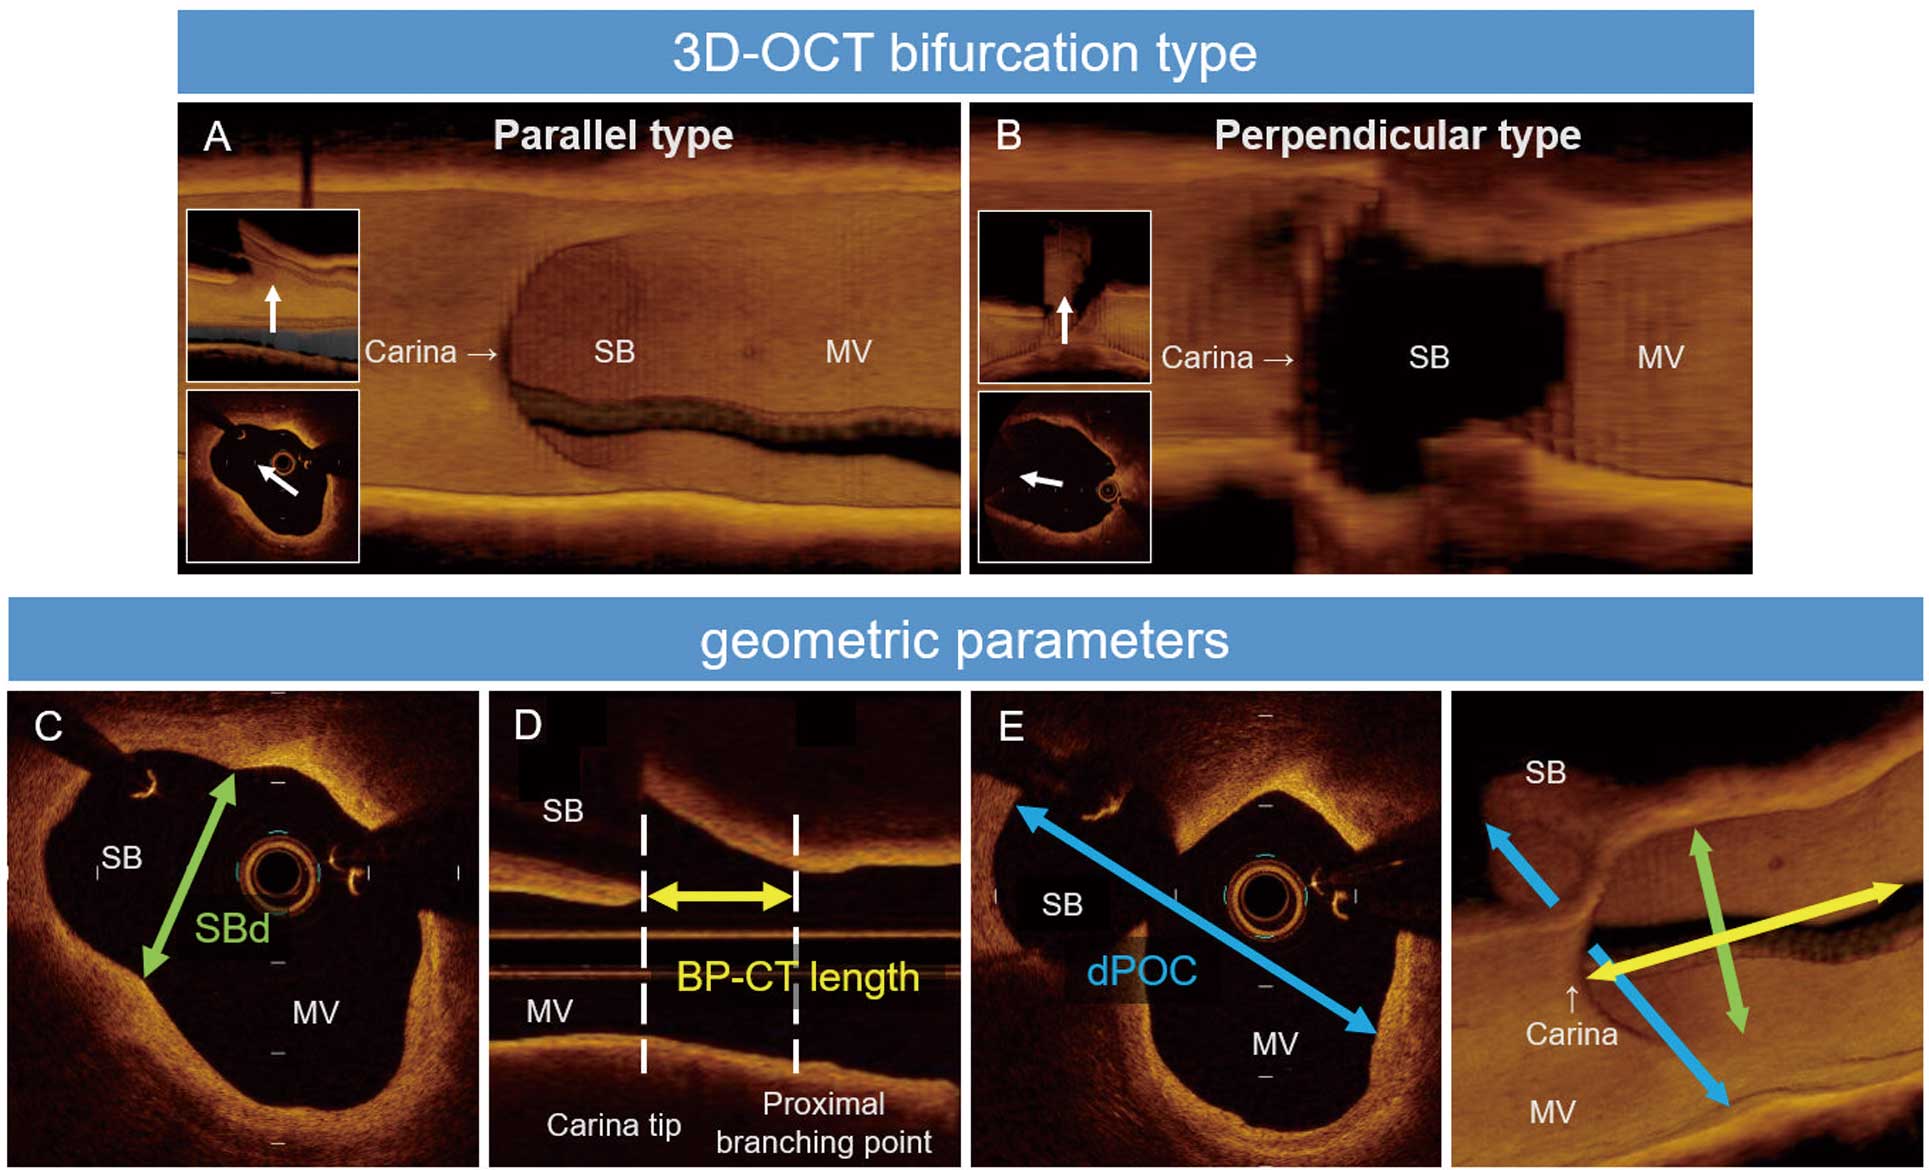
The size of the bifurcation confluence was measured from 3 directions (termed “geometric parameter”), and consisted of the SB diameter (SBd), the length between the proximal branching point and the carina tip (BP-CT length), and the distance of the polygon of confluence (dPOC). These geometric parameters were measured on cross-sectional and longitudinal images. SBd was defined as the maximum distance from the lumen border to the lumen border of the SB ostium in a cross-sectional image of MV pullback (Figure 1C). The proximal branching point was defined as the proximal take-off of the SB,7 and BP-CT length was measured in the longitudinal image (Figure 1D). The dPOC was defined as the maximum distance from the course of the opposite side of the SB to the proximal course of the SB at the first frame proximal to the carina tip in a cross-sectional image (Figure 1E).18 In the perpendicular type, dPOC was unmeasurable because the proximal course of the SB is out of range. Therefore, dPOC was evaluated only in the parallel type. Proximal and distal reference lumen areas were defined as the area of the proximal and distal stent landing zone, respectively. The proximal and distal minimum lumen areas were measured. The distal MV lumen diameter at the carina (DMVd) was also measured. In the parallel type, dPOC minus the DMVd was calculated. Serial changes in the geometric parameters were analyzed in cases with OCT assessments of sufficient quality immediately after stenting.
Plaque characteristics and distribution at the proximal branching point and at the carina tip were assessed. The definitions of tissue characteristics used were as reported previously.19 Plaque characteristics were defined as major components of the target site (occupying >180° in circumference). The morphologic features of plaque distribution at the carina tip and proximal branching points were also assessed as described previously:7 Type 1, eccentric plaque orienting towards the opposite side of the SB; Type 2, eccentric plaque orienting towards the SB side; Type 3, eccentric plaque orienting towards the other side; and Type 4, concentric plaque. The eccentricity of plaque distribution was defined as a ratio of minimum intima thickness/maximum intima thickness <0.5. The maximum calcium angle at the bifurcation segment was analyzed. In addition, the presence of calcified plaque at opposite to the SB and lipid plaque around the SB ostium in the MV were also assessed. Lipid plaque around the SB ostium was defined as the presence of lipid plaque on the SB side of the proximal branching point in MV pullback.
Clinical Follow-up Data
Patients underwent clinical follow-up at 9 months after the index procedure. The occurrence of death, myocardial infarction, and target vessel revascularization were recorded.
Statistical Analysis
Normally distributed continuous variables are presented as the mean±SD and were compared using an unpaired Student’s t-test. Non-normally distributed continuous variables are presented as median with interquartile range (IQR), and were compared using the Wilcoxon rank-sum test. Categorical variables are presented as counts with frequencies (percentages) and were compared using the Chi-squared test or Fisher’s exact test.
Previous literature showed that MV stent implantation causes a morphologic change of the SB ostium from a circular to elliptical shape, resulting in a narrowing of the SB ostium.16 That is, the longitudinal length of the SB ostium decreases after MV stent implantation across the SB, and the small SB ostial area is an independent risk factor for SBC.7,16 Furthermore, the parallel-type bifurcation has been reported to be associated with carina shift due to MV stenting.12 Therefore, we extracted 4 variables (SBd, BP-CT length, dPOC, and bifurcation type) that reflected the size and morphology of the SB ostium, and created an OCT risk score. A receiver operating characteristic (ROC) curve was used to determine the best cut-off values of these 4 variables to predict SBC after MV stenting. The best cut-off values were defined as those with a maximum value of Youden’s index.
Univariate and multivariate logistic regression analyses were performed to determine the independent variables for predicting SBC after MV stenting. The multivariate model for SBC included OCT variables with P<0.05 in univariate logistic regression analyses (OCT risk score ≥3, proximal and distal reference lumen area, minimum lumen diameter in the proximal MV) and OCT variables reported previously (calcified plaque at opposite to the SB, lipid plaque around the SB ostium).20,21 The forward-backward stepwise method was used to select the variables. The threshold for significance was P<0.05. All analyses were conducted using JMP Statistics software (ver. 13; SAS, Cary, NC, USA).
Results
Patient Characteristics
Of the 168 lesions in 168 patients, 57 lesions were excluded and 111 were studied (Figure 2). SBC occurred in 36 (32%) bifurcation lesions. Baseline patient characteristics stratified by SBC are presented in Table 1. There were no significant differences between the 2 groups.

Table 1.
Patient Characteristics
| |
SBC
(n=36) |
Non-SBC
(n=75) |
P value |
| Age (years) |
71±1.6 |
71±1.1 |
0.80 |
| Male sex |
25 (69.4) |
51 (68.0) |
0.88 |
| Hypertension |
31 (86.1) |
67 (89.3) |
0.75 |
| Dyslipidemia |
25 (69.4) |
48 (64.0) |
0.57 |
| Diabetes |
17 (47.2) |
29 (38.7) |
0.39 |
| Current/former smoker |
16 (44.4) |
30 (40.0) |
0.66 |
| Family history of CAD |
3 (8.3) |
5 (6.7) |
0.71 |
| Prior MI |
5 (16.1) |
14 (20.0) |
0.79 |
| Prior PCI/CABG |
15 (48.4) |
28 (40.0) |
0.43 |
| Stable angina |
24 (66.7) |
57 (76.0) |
0.30 |
| Silent myocardial ischemia |
8 (22.2) |
9 (12.0) |
0.16 |
| Old MI |
4 (11.1) |
9 (12.0) |
1.00 |
| LVEF (%) |
63±1.7 |
62±1.1 |
0.47 |
Unless indicated otherwise, values are given as the mean±SD, n (%). CABG, coronary artery bypass graft; CAD, coronary artery disease; LVEF, left ventricular ejection fraction; MI, myocardial infarction; PCI, percutaneous coronary intervention; SBC, side branch compromise.
Angiographic and Procedural Characteristics
Angiographic and procedural characteristics are presented in Table 2 and Supplementary Table 1. The target bifurcation lesions with SBC were mostly located at the left anterior descending coronary, whereas those without SBC were more frequently located at the left main (LM) coronary artery. The prevalence of true bifurcation lesions was significantly higher in the SBC than non-SBC group (56% vs. 27%; P=0.0030). QCA analysis revealed significant differences in the proximal MV reference diameter, SB reference diameter, and proximal MV %DS between the SBC and non-SBC groups.
Table 2.
Angiographic and OCT Findings
| |
SBC
(n=36) |
Non-SBC
(n=75) |
P value |
| Preprocedural angiographic findings |
| Location of bifurcation |
|
|
<0.0001 |
| LM |
1 (2.8) |
32 (42.7) |
|
| LAD |
27 (75.0) |
24 (32.0) |
|
| LCX |
3 (8.3) |
14 (18.7) |
|
| RCA |
5 (13.9) |
5 (6.6) |
|
| Medina classification |
|
|
0.0061 |
| 1.1.1 |
12 (33.4) |
6 (8.0) |
|
| 1.1.0 |
7 (19.4) |
15 (20.0) |
|
| 1.0.1 |
1 (2.8) |
4 (5.3) |
|
| 1.0.0 |
0 (0) |
4 (5.3) |
|
| 0.1.1 |
7 (19.4) |
9 (12.0) |
|
| 0.1.0 |
9 (25.0) |
37 (49.4) |
|
| True bifurcation |
20 (55.6) |
20 (26.7) |
0.0030 |
| Any calcification |
10 (27.8) |
24 (32.0) |
0.83 |
| Moderate calcification |
4 (11.1) |
15 (20.0) |
0.29 |
| Severe calcification |
6 (16.7) |
9 (12.0) |
0.50 |
| QCA analysis |
| PMV reference diameter (mm) |
2.68 [2.34–3.06] |
2.98 [2.64–3.64] |
0.0030 |
| DMV reference diameter (mm) |
2.30 [2.05–2.52] |
2.50 [2.06–2.81] |
0.06 |
| SB reference diameter (mm) |
1.94 [1.57–2.15] |
2.29 [1.74–2.67] |
0.0065 |
| PMV diameter stenosis (%) |
33.9 [15.5–49.8] |
12.6 [1.60–41.5] |
0.0125 |
| DMV diameter stenosis (%) |
51.9 [36.7–65.9] |
53.5 [26.4–66.1] |
0.58 |
| SB diameter stenosis (%) |
20.8 [9.33–40.9] |
20.7 [11.3–36.2] |
1.00 |
| PMV-DMV angle (°) |
151 [138–162] |
159 [147–172] |
0.0389 |
| PMV-SB angle (°) |
158 [141–168] |
146 [131–161] |
0.0306 |
| DMV-SB angle (°) |
52.5 [39.8–61.3] |
53.0 [38.5–70.5] |
0.70 |
| OCT acquisition procedure |
| Timing of OCT pullback |
|
|
0.23 |
| Before any intervention |
31 (86.1) |
53 (70.7) |
|
| After predilatation with small balloon |
5 (13.9) |
16 (21.3) |
|
| After lesion preparation, including SB dilatation |
0 (0) |
1 (1.3) |
|
| After rotablation for MV |
0 (0) |
5 (6.7) |
|
| Guidewire in SB |
16 (44.4) |
40 (53.3) |
0.42 |
| Pullback speed: 36 mm/s |
19 (52.8) |
47 (62.7) |
0.41 |
| Flush material: Contrast |
34 (94.4) |
71 (94.7) |
1.00 |
| OCT findings before stent implantation |
| 3D-OCT bifurcation type |
| Parallel type |
32 (88.9) |
49 (65.3) |
0.0113 |
| Plaque distribution |
| Proximal branching point |
|
|
0.60 |
| Type 1 |
17 (47.2) |
27 (36.0) |
|
| Type 2 |
1 (2.8) |
5 (6.6) |
|
| Type 3 |
8 (22.2) |
23 (30.7) |
|
| Type 4 |
10 (27.8) |
20 (26.7) |
|
| Carina tip |
| Type 1 |
26 (72.2) |
45 (60.0) |
0.32 |
| Type 2 |
1 (2.8) |
1 (1.3) |
|
| Type 3 |
7 (19.4) |
17 (22.7) |
|
| Type 4 |
2 (5.6) |
12 (16.0) |
|
| Plaque components |
| Proximal branching point |
|
|
0.91 |
| Fibrous plaque |
7 (19.4) |
17 (22.7) |
|
| Lipid plaque |
21 (58.4) |
43 (57.3) |
|
| Calcified plaque |
8 (22.2) |
15 (20.0) |
|
| Carina tip |
|
|
0.84 |
| Fibrous plaque |
7 (19.4) |
18 (24.0) |
|
| Lipid plaque |
24 (66.7) |
45 (60.0) |
|
| Calcified plaque |
5 (13.9) |
12 (16.0) |
|
| Calcified plaque at opposite of SB |
8 (22.2) |
15 (20.0) |
0.81 |
| Lipid plaque around SB ostium |
8 (22.2) |
10 (13.3) |
0.28 |
| Maximum calcium angle (°) |
|
|
0.44 |
| 0–89 |
26 (72.2) |
51 (68.0) |
|
| 90–179 |
3 (8.3) |
11 (14.7) |
|
| 180–269 |
5 (13.9) |
5 (6.7) |
|
| 270–360 |
2 (5.6) |
8 (10.7) |
|
| 3D geometric parameters |
| SB diameter (mm) |
1.68 [1.40–1.97] |
2.07 [1.76–2.79] |
0.0001 |
| BP-CT length (mm) |
1.4 [1.13–1.68] |
2.1 [1.6–2.5] |
<0.0001 |
| dPOC (mm) |
3.75 [3.37–4.40] |
4.21 [3.74–4.91] |
0.0090 |
| Proximal reference lumen area (mm2) |
6.54 [4.75–7.71] |
8.19 [6.16–11.6] |
0.0011 |
| Distal reference lumen area (mm2) |
3.80 [3.05–5.42] |
4.66 [3.60–7.35] |
0.0462 |
| MLD in the DMV (mm) |
1.20 [1.02–1.42] |
1.28 [0.99–1.48] |
0.43 |
| MLD in the PMV (mm) |
1.68 [1.38–2.02] |
2.11 [1.56–2.72] |
0.0051 |
| OCT risk score ≥3 |
22 (71.0) |
7 (13.2) |
<0.0001 |
| Angiographic finding after stenting |
| SB TIMI flow grade (≤2) |
3 (8.3) |
1 (1.4) |
0.10 |
Values are given as n (%), or median (interquartile range). 3D, 3-dimensional; BP-CT length, length between the proximal branching point and the carina tip; DMV, distal main vessel; dPOC, distance of polygon of confluence; LAD, left anterior descending artery; LCX, left circumflex artery; LM, left main bifurcation artery; MLD, minimum lumen diameter; OCT, optical coherence tomography; PMV, proximal main vessel; QCA, quantitative coronary angiography; RCA, right coronary artery; SB, side branch; TIMI, Thrombolysis in Myocardial Infarction. Other abbreviations as in Table 1.
Baseline OCT Analysis
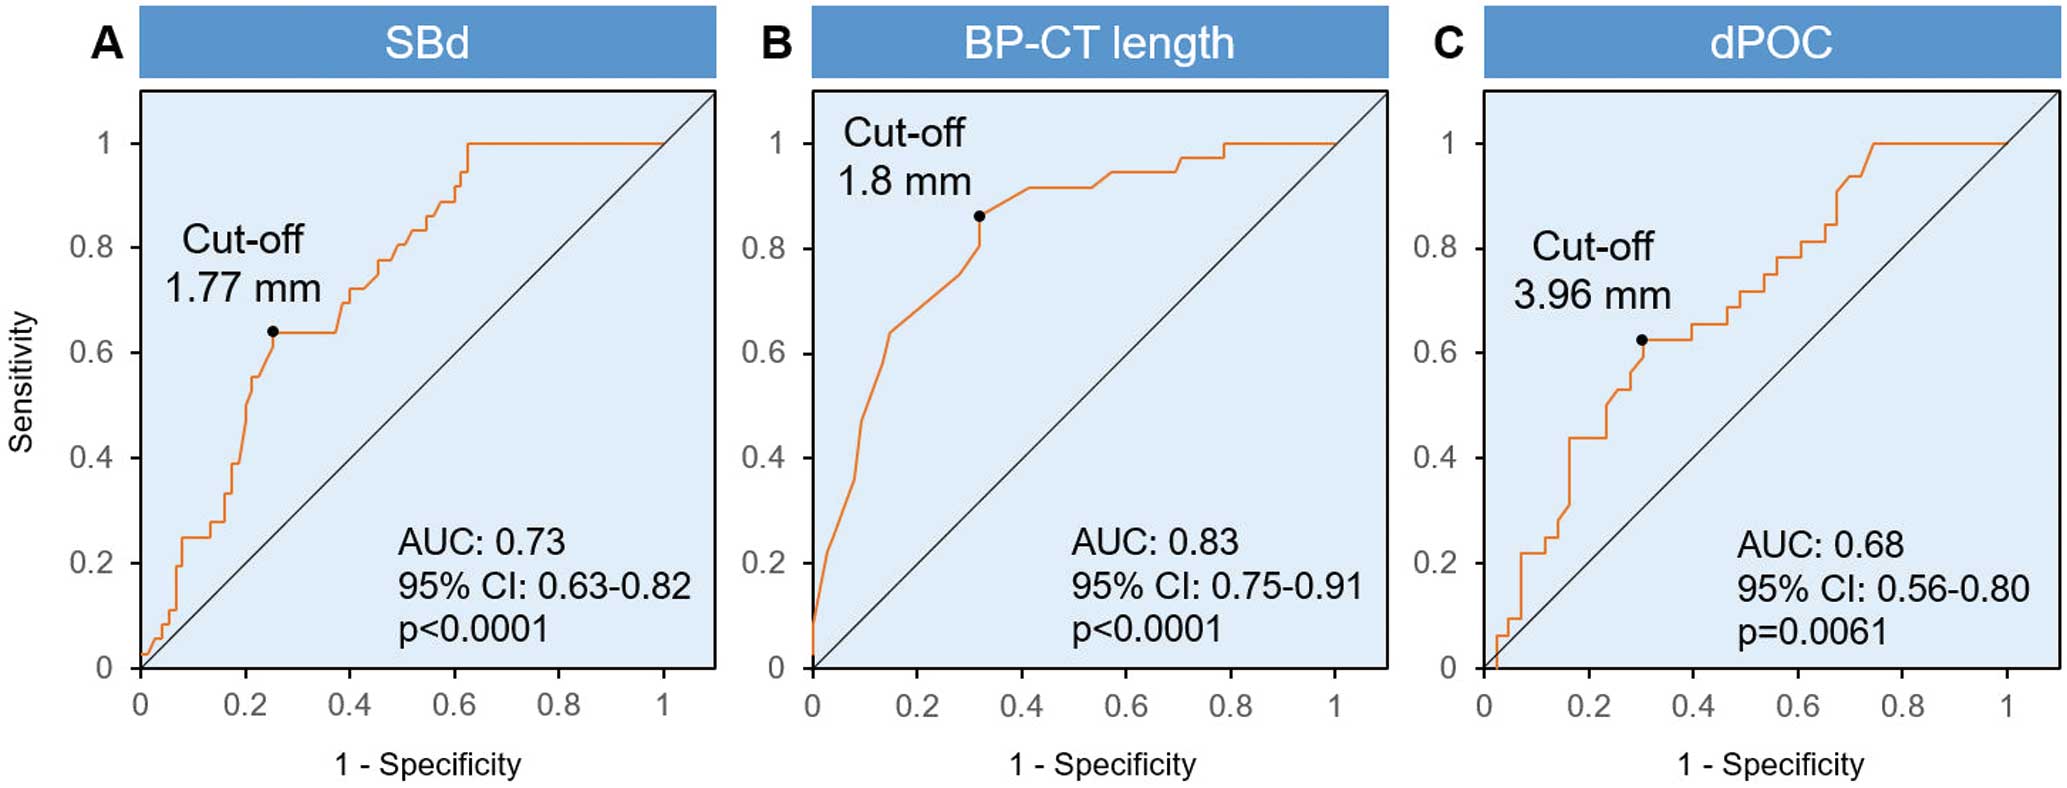
The results of the OCT analysis before stenting are presented in Table 2. The prevalence of parallel-type bifurcation was significantly higher in the SBC than non-SBC group (88.9% vs. 65.3%; P=0.0113). No differences were detected in the plaque distribution and components at either the proximal branching point or the carina tip site. The geometric parameters were significantly shorter in the SBC than non-SBC group: SBd, median (IQR) 1.68 (1.40–1.97) vs. 2.07 (1.76–2.79) mm (P=0.0001); BP-CT length, median (IQR) 1.4 (1.13–1.68) vs. 2.1 (1.6–2.5) mm (P<0.0001); and dPOC, median (IQR) 3.75 (3.37–4.40) vs. 4.21 (3.74–4.91) mm (P=0.0090). According to ROC curves (Figure 3), the best cut-off values for predicting SBC after MV stenting were 1.77 mm for SBd (area under the curve [AUC] 0.73; 95% confidence interval [CI] 0.63–0.82; P<0.0001; sensitivity 63.9%; specificity 74.8%), 1.8 mm for BP-CT length (AUC 0.83; 95% CI 0.75–0.91; P<0.0001; sensitivity 86.1%; specificity 68.0%), and 3.96 mm for dPOC (AUC 0.68; 95% CI 0.56–0.80; P=0.0061; sensitivity 62.5%; specificity 69.0%).
To develop the OCT risk score for predicting SBC, we assigned 1 point each to SBd ≤1.77 mm, BP-CT length ≤1.8 mm, dPOC ≤3.96 mm, and parallel-type bifurcation. The OCT risk score was calculated by summing the scores for these parameters. For perpendicular-type bifurcation, the dPOC score is 0 points because dPOC is unmeasurable. As shown in Figure 4, the frequency of SBC across quartiles of the risk score was as follows: Score 0, 0%; Score 1, 8.7%; Score 2, 28%; Score 3, 58%; Score 4, 85% (P<0.0001). Multivariate logistic regression analysis showed that an OCT risk score ≥3 was an independent predictor for SBC (odds ratio 14.8; 95% CI 5.2–42.6; P<0.0001; Table 3).
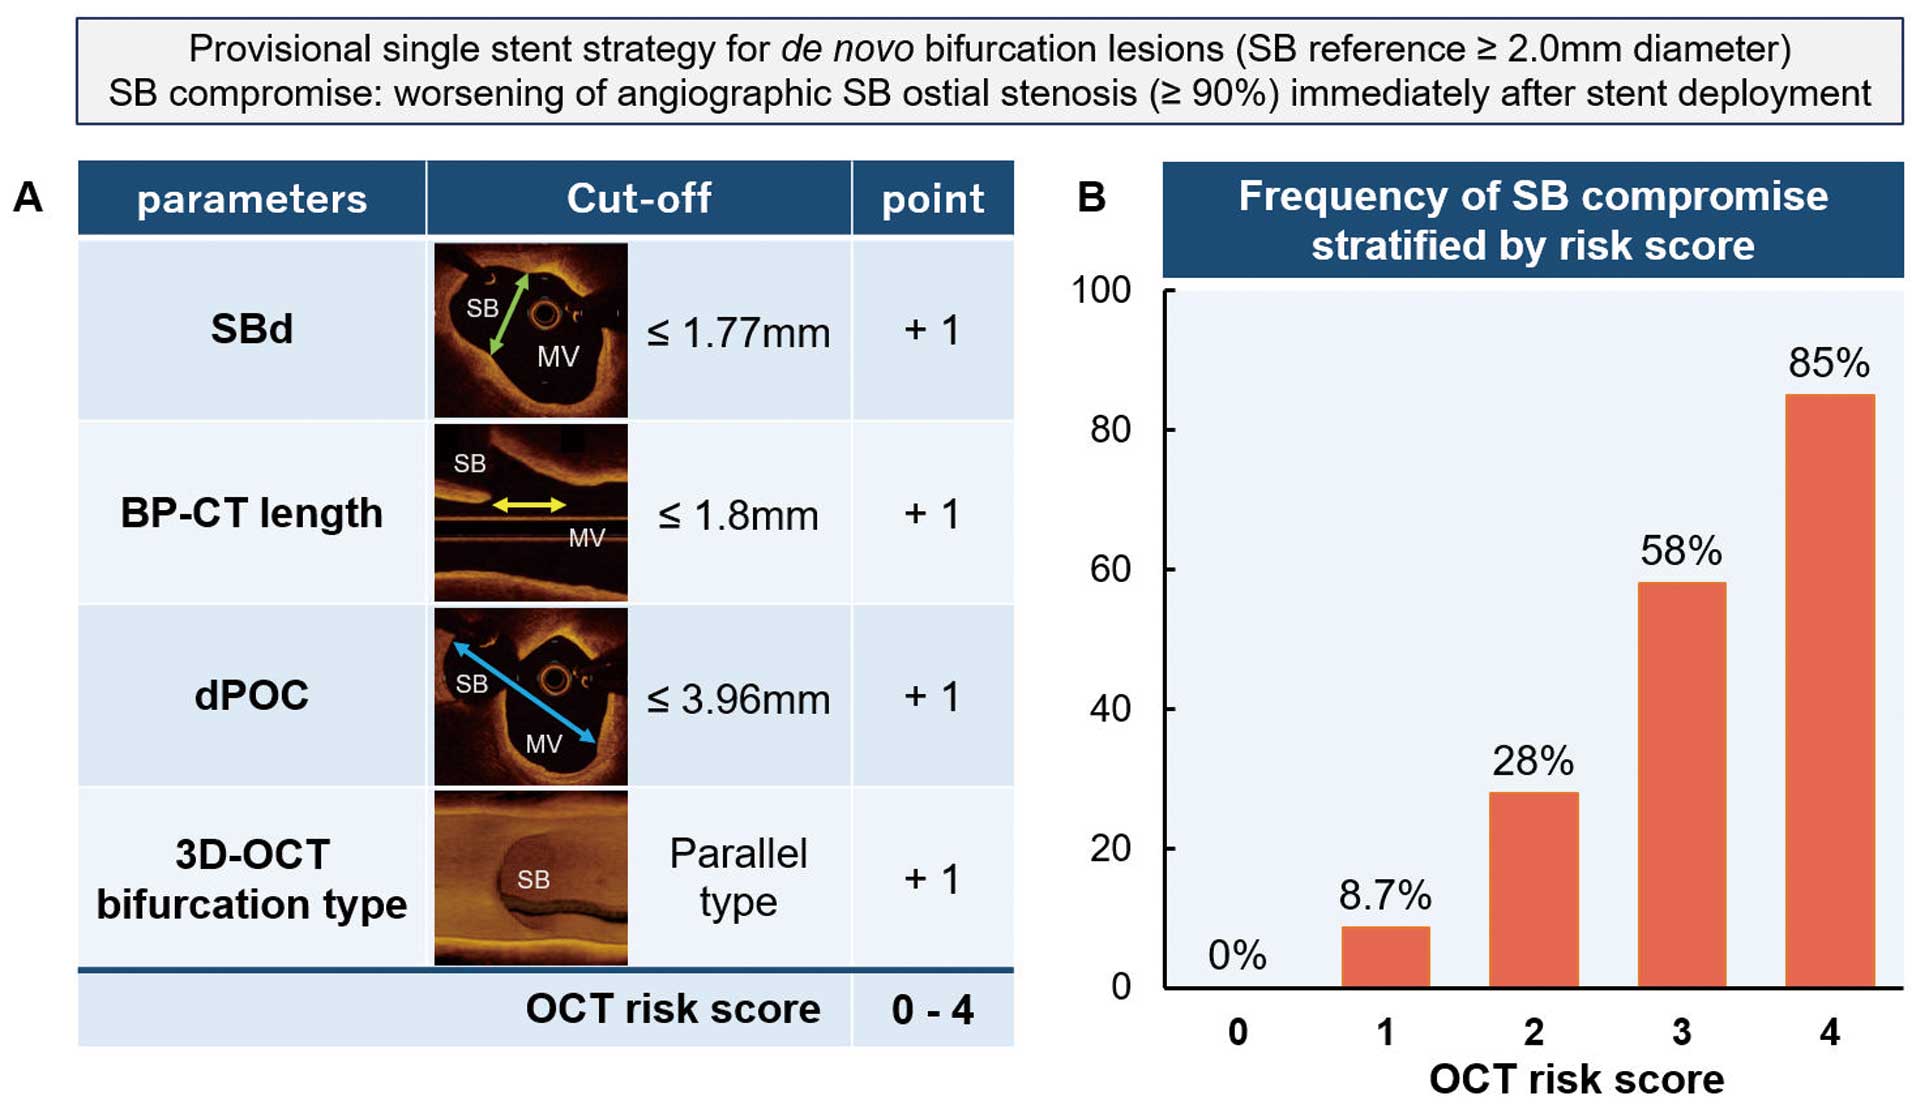
Table 3.
Univariate and Multivariate Analysis of Independent Variables for Predicting SBC Immediately After Main Vessel Stenting
| |
Univariate |
Multivariate |
| OR |
95% CI |
P value |
OR |
95% CI |
P value |
| MLD in the PMV |
0.39 |
0.20–0.75 |
0.0024 |
|
|
|
| Proximal reference lumen area |
0.78 |
0.66–0.92 |
0.0004 |
0.88 |
0.73–1.04 |
0.1181 |
| Distal reference lumen area |
0.82 |
0.68–0.99 |
0.0271 |
|
|
|
| Calcified plaque at the opposite to the SB |
1.14 |
0.43–3.01 |
0.79 |
|
|
|
| Lipid plaque around the SB ostium |
1.86 |
0.66–5.20 |
0.24 |
2.35 |
0.68–8.15 |
0.1809 |
| OCT risk score ≥3 |
11.93 |
4.65–30.55 |
<0.0001 |
9.46 |
3.43–26.04 |
<0.0001 |
CI, confidence interval; OR, odds ratio. Other abbreviations as in Table 2.
Finally, either SB ballooning, kissing balloon inflation, or double-stenting was performed for 92 (83.8%) lesions. Consequently, SB ostial stenosis (≥90%) at the final angiography was observed in only 4 lesions.
Ninety-four patients (SBC, n=30; non-SBC, n=64) underwent clinical follow-up at 9 months after the index procedure. The prevalence of target vessel revascularization in the SBC group was numerically greater than that in the non-SBC group, but the difference was not statistically significant (13.3% vs 6.3%, respectively; P=0.251). Other adverse events were not observed.
Representative Case
Figure 5 shows a representative case of SBC. The bifurcation lesion was in the left anterior descending coronary with a Medina classification of 0.1.0. A preprocedural OCT image showed a shorter SBd, BP-CT length, and dPOC and a parallel-type bifurcation lesion. The OCT risk score was 4. Immediately after MV stenting, SBC occurred.
Serial Changes in the Geometric Parameters
Of the 111 bifurcation lesions in the present study, 83 OCT pullbacks immediately after MV stenting with sufficient quality for assessment were extracted and analyzed (Figure 2; Supplementary Table 2). The results are presented in Supplementary Figure and Supplementary Table 3. SBd did not change significantly in either bifurcation type (parallel type, from median [IQR] 1.79 [1.58–2.09] to 1.87 [1.56–2.20] mm [P=0.1866]; perpendicular type, from 2.49 [2.02–3.0] to 2.93 [2.12–3.34] mm [P=0.0908]). BP-CT length was significantly shortened in both bifurcation types (parallel type, from median [IQR] 1.6 [1.4–2.0] to 1.3 [0.9–1.7] mm [P<0.0001]; perpendicular type, from 2.5 [1.6–3.4] to 1.6 [1.3–2.0] mm [P<0.0001]). In parallel type, although there was no significant change in dPOC immediately after MV stenting compared with before MV stenting (median [IQR] 4.09 [3.47–4.73] vs. 4.26 [3.66–4.81] mm, respectively; P=0.1409), the reduction in calculated dPOC–DMVd was significantly greater immediately after MV stenting compared to before MV stenting (median [IQR] 2.22 [1.88–2.72] vs. 1.54 [1.12–1.86] mm; P<0.0001).
Discussion
This study investigated the predictors of SBC immediately after MV stenting using OCT before stenting. The main findings of this study are as follows: (1) shorter geometric parameters (SBd, BP-CT length, and dPOC) were associated with a higher incidence of SBC; (2) the mechanism of SBC may differ according to the 3D-OCT bifurcation type, and the parallel type was correlated with the development of SB ostial stenosis; and (3) a novel risk stratification score system (the OCT risk score), consisting of 4 variables (SBd, BP-CT length, dPOC, and bifurcation type), was developed that could predict the risk of SBC immediately after MV stenting.
Currently, plaque shift and carina shift are the 2 major mechanisms of SB occlusion.9 The degree of plaque shift and carina shift, and their proportion, depend on previously reported factors, such as calcified plaque,20 plaque burden,22 layered plaque around the SB ostium,8 and the SB angle.5 However, these factors may depend on the study population. For example, although it has been reported that the presence of calcium plaque is associated with SBC,20 there was no difference in the frequency or size of calcification between the SBC and non-SBC groups in the present study. The present study included LM bifurcation, whereas no LM bifurcation was found in the previous study.8 Consequently, the SB reference diameter and the proximal reference lumen area in the present study were larger than those in their study.20 Subsequent morphologic changes in the bifurcation segment by the implanted stent led to SB ostial narrowing, resulting in SBC/SB occlusion. Therefore, we evaluated serial changes in the 3D luminal size of the bifurcation core. The findings of the present study suggest that a smaller 3D bifurcation core, represented by a higher risk score, was prone to SBC.
Changes in 3D Bifurcation Geometry
A recent 3D-OCT study showed that the SB ostium changed from a circular shape before the intervention to an elliptical shape after stent implantation crossing over the SB.16 The length of the SB ostium in the longitudinal direction became shorter after stent implantation. In the present study, the results were similar. Axial SBd was not changed by stent implantation, whereas longitudinal SB diameter (BP-CT length) was significantly shorter after implantation. It is notable that the difference in BP-CT length between before and after MV stenting was significantly greater in the case of perpendicular-type bifurcation lesions compared with parallel-type bifurcation lesions. In the case of parallel-type bifurcation lesions, we evaluated dPOC as the distance of the third direction orthogonal to the SBd and BP-CT length. Interestingly, even though the dPOC did not change significantly, dPOC-DMVd decreased after stent implantation because the DMVd was increased by stent implantation. These serial changes suggest that parallel-type bifurcations may be prone to carina shift after MV stenting.
In the present study, SBd did not change significantly after stent implantation because the stent expanded the lumen axial direction. Despite this, a small SBd is associated with SBC. Previous IVUS studies suggested that a plaque shift explains the worsening of SB ostium stenosis. Sakamoto et al reported that the SB diameter ratio (SB total diameter/SB lumen diameter) was an independent predictor of SB occlusion.4 A high SB diameter ratio indicates a large amount of plaque at the SB ostium. Moreover, layered plaque around the SB ostium is prone to SBC.8 The present study included true bifurcation lesions. In cases with a smaller SBd, the incidence of SBC was frequent even if the serial changes in the SBd were small immediately after stent deployment. In such cases, the SB orifice may shorten in the longitudinal direction, resulting in ostial narrowing.
Bifurcation Angle and 3D OCT Bifurcation Type
The effect of the bifurcation angle on SBC is controversial.22 Several studies have demonstrated that a large bifurcation angle predicts the occurrence of SB occlusion,5,8 whereas other studies showed that a shallow bifurcation angle was prone to a carina shift.20 In the present study, the 3D-OCT bifurcation type (parallel or perpendicular) was used for qualitative assessment of the spatial aspects of the bifurcation. A previous study reported that 3D-OCT bifurcation type showed the greatest correlation with the bifurcation angle between the distal MV and SB measured by 3D-QCA, in which the optimal cut-off of the bifurcation angle to predict a perpendicular type was 51° (AUC 0.77, sensitivity 80%, specificity 67%).15 The parallel-type bifurcation was significantly more frequent in the SBC than non-SBC group. The V-RESOLVE (Visual Estimation for Risk prEdiction of Side Branch OccLusion in Coronary Bifurcation interVEntion) scoring system based on visual angiographic findings showed that a large bifurcation angle was associated with SB occlusion.23 There may be differences in lesion characteristics between the V-RESOLVE study and the present study. In our registry, 29.7% of lesions were for LM bifurcation, which has a relatively large SB, compared with only 2.5% in the V-RESOLVE study. The prevalence of Medina 1.0.0 bifurcation lesions was 31.2% in the V-RESOLVE study, compared with only 3.6% in our registry. In addition, the use of wire protection (27.7% vs 92.8%) and the definition of SBC/SB occlusion also differed between V-RESOLVE and the present study. These differences may have influenced the results. Thus, not only the bifurcation angle, but also plaque distribution, morphology, lesion location, and the site of the stenosis may be associated with SBC in a complicated relationship.
Risk Score and Clinical Implication
Watanabe et al reported that 82.4% of cases with both BP-CT length ≤1.7 mm and carina tip angle ≤50° showed SBC after MV stent implantation.7 However, the carina tip angle cannot be measured on the OCT/OFDI console directly, so external software is needed. The carina tip angle may be influenced by the aspect ratio of the longitudinal image, which is affected by pullback speed. Moreover, the previous study included the bifurcation lesion without significant SB ostial stenosis (<50% diameter stenosis), such as Medina classification of 1.0.0, 0.1.0, 1.1.0, and Only 2 (2%) cases of LM bifurcation.7 Compared with previous studies, the present study established an OCT risk score as a risk stratification tool for SBC in a coronary bifurcation intervention, including true bifurcation lesions and LM bifurcation, with high probability.6,7 Furthermore, all parameters of the OCT risk score are immediately measurable using only the OCT console and require no other software. Thus, the findings of the present study may be applicable to both true and LM bifurcations. With an increase in the use of long stents,24 the number of stent-jailed major SBs has also increased. In such cases, stratification of the risk of SBC may be useful for deciding which SB to protect first. If the SB meets all the simplified OCT risk score parameters (SBd ≥2 mm, BP-CT length ≥2 mm, dPOC ≥4 mm), not protecting the SB may be a potential strategy for simplifying the procedure. Almost all previous studies predicted functional SB stenosis with a decreasing Thrombolysis in Myocardial Infarction (TIMI) flow grade.2,4,6,8,23 However, when such severe SB stenosis occurs, wire recrossing into the SB is often difficult or even impossible.25 Fractional flow reserve (FFR) of the SB is another factor contributing to decision making regarding additional SB interventions. SB FFR using a pressure guidewire cannot always be measured; measurement of SB FFR is reported to fail in 20% of cases.26 In addition, in the provisional stenting strategy, which is generally recommended in bifurcation PCI, additional SB treatment is considered in the presence of an SB flow disturbance and/or >90% occlusion.3 Therefore, we adopted angiographic SB stenosis >90% for SBC in the present study. When the OCT risk score is high in a crucial SB, a more aggressive SB protection strategy can be used, such as a jailed balloon technique, jailed corsair technique, and even a planned double-stent strategy. Based on these findings, the risk score may help determine the PCI strategy in clinical practice.
Study Limitations
The present study has several limitations. First, technical factors, such as the stent deployment pressure, were unknown. If the operator considered that the risk of SBC was high, the stent could have been deployed with a low pressure to avoid SBC. Second, although a provisional single-stent strategy followed by POT is currently recommended in bifurcation PCI,3 the rate of POT was only 40% at the time of the present study. Therefore, the OCT analysis in this study was performed before POT. POT potentially enlarges the SB orifice.27 Serial changes in geometric parameters after POT should be investigated in a future study. Third, detailed plaque volume and changes due to stent placement were not investigated because of OCT analysis. Fourth, coronary trifurcation lesions were not included in the present study. Fifth, SB stenosis (primary endpoint) was qualitatively estimated by visual inspection. This may impact reliability in the present study. Visual estimation is widely used during procedures. To ensure objectivity, the evaluations were performed by 2 or 3 observers in the present study. Finally, this study had a relatively small sample size, consisted of retrospective analysis, and was not a randomized study, thus we could not adjust for differences in baseline lesion characteristics (location of bifurcation, Medina classification, true bifurcation, stent type used, stent diameter). Moreover, the reproducibility of the risk score could not be validated in other populations. Therefore, this study was conducted in a hypothesis-generating manner. SBC due to SB ostial dissection or spasms may not be predicted by the present risk score. SBC due to dissection and spasms is reported to occur in 15.4% of cases.28 Further studies with a larger number of cases are needed to validate the risk score to predict SBC.
Conclusions
The incidence of SBC immediately after bifurcation stenting was related to shorter geometric parameters and a parallel-type bifurcation. The OCT risk score, consisting of quantitative and 3D qualitative parameters, could predict SBC with high probability.
Acknowledgments
The authors thank all the participating facilities.
Sources of Funding
This study was supported by an unrestricted research grant from the 3D-OCT Bifurcation Registry.
Disclosures
M. Yano is a member of Circulation Journal’s Editorial Team. The remaining authors have no conflicts of interest to declare.
IRB Information
This study was approved by the Institutional Review Board of Yamaguchi University (Reference no. H26-26-3).
Data Availability
The de-identified participant data will be shared on a request basis. All analyzable datasets related to the study will be shared, as will the study protocol and statistical analysis plan. Data will be available during the review process and 1 year after publication. Data will be available to reviewers and anyone else who is interested in this article after acceptance from the corresponding author. The data will be shared as Excel files via email.
Supplementary Files
Please find supplementary file(s);
https://doi.org/10.1253/circj.CJ-22-0723
References
- 1.
Lee JM, Park KW, Koo BK, Kim HS. Stenting of coronary bifurcation lesions: A literature and technical review. Curr Cardiol Rep 2015; 17: 45.
- 2.
Hahn JY, Chun WJ, Kim JH, Song YB, Oh JH, Koo BK, et al. Predictors and outcomes of side branch occlusion after main vessel stenting in coronary bifurcation lesions: Results from the COBIS II Registry (COronary BIfurcation Stenting). J Am Coll Cardiol 2013; 62: 1654–1659.
- 3.
Burzotta F, Lassen JF, Lefèvre T, Banning AP, Chatzizisis YS, Johnson TW, et al. Percutaneous coronary intervention for bifurcation coronary lesions: The 15th consensus document from the European Bifurcation Club. EuroIntervention 2021; 16: 1307–1317.
- 4.
Sakamoto N, Hoshino Y, Mizukami H, Sugimoto K, Yamaki T, Kunii H, et al. Intravascular ultrasound predictors of acute side branch occlusion in coronary artery bifurcation lesions just after single stent crossover. Catheter Cardiovasc Interv 2016; 87: 243–250.
- 5.
Zhang D, Xu B, Yin D, Li Y, He Y, You S, et al. How bifurcation angle impacts the fate of side branch after main vessel stenting: A retrospective analysis of 1,200 consecutive bifurcation lesions in a single center. Catheter Cardiovasc Interv 2015; 85(Suppl 1): 706–715.
- 6.
Dou K, Zhang D, Xu B, Yang Y, Yin D, Qiao S, et al. An angiographic tool for risk prediction of side branch occlusion in coronary bifurcation intervention: The RESOLVE score system (Risk prEdiction of Side branch OccLusion in coronary bifurcation interVEntion). JACC Cardiovasc Interv 2015; 8: 39–46.
- 7.
Watanabe M, Uemura S, Sugawara Y, Ueda T, Soeda T, Takeda Y, et al. Side branch complication after a single-stent crossover technique: Prediction with frequency domain optical coherence tomography. Coron Artery Dis 2014; 25: 321–329.
- 8.
Cao Y, Mintz GS, Matsumura M, Zhang W, Lin Y, Wang X, et al. The relation between optical coherence tomography-detected layered pattern and acute side branch occlusion after provisional stenting of coronary bifurcation lesions. Cardiovasc Revasc Med 2019; 20: 1007–1013.
- 9.
Gwon HC, Song YB, Pan M. The story of plaque shift and carina shift. EuroIntervention 2015; 11(Suppl V): V75–V77.
- 10.
Onuma Y, Katagiri Y, Burzotta F, Holm NR, Amabile N, Okamura T, et al. Joint consensus on the use of OCT in coronary bifurcation lesions by the European and Japanese bifurcation clubs. EuroIntervention 2019; 14: e1568–e1577.
- 11.
Takagi K, Nagoshi R, Kim BK, Kim W, Kinoshita Y, Shite J, et al. Efficacy of coronary imaging on bifurcation intervention. Cardiovasc Interv Ther 2021; 36: 54–66.
- 12.
Farooq V, Serruys PW, Heo JH, Gogas BD, Okamura T, Gomez-Lara J, et al. New insights into the coronary artery bifurcation hypothesis-generating concepts utilizing 3-dimensional optical frequency domain imaging. JACC Cardiovasc Interv 2011; 4: 921–931.
- 13.
Okamura T, Nagoshi R, Fujimura T, Murasato Y, Yamawaki M, Ono S, et al. Impact of guidewire recrossing point into stent jailed side branch for optimal kissing balloon dilatation: Core lab 3D optical coherence tomography analysis. EuroIntervention 2018; 13: e1785–e1793.
- 14.
Okamura T, Onuma Y, Yamada J, Iqbal J, Tateishi H, Nao T, et al. 3D optical coherence tomography: New insights into the process of optimal rewiring of side branches during bifurcational stenting. EuroIntervention 2014; 10: 907–915.
- 15.
Nishimura T, Okamura T, Fujimura T, Miyazaki Y, Takenaka H, Akase H, et al. Feasibility, reproducibility and characteristics of coronary bifurcation type assessment by three-dimensional optical coherence tomography. PLoS One 2022; 17: e0263246.
- 16.
Cho S, Kim JS, Ha J, Shin DH, Kim BK, Ko YG, et al. Three-dimensional optical coherence tomographic analysis of eccentric morphology of the jailed side-branch ostium in coronary bifurcation lesions. Can J Cardiol 2016; 32: 234–239.
- 17.
Fujino A, Mintz GS, Matsumura M, Lee T, Kim SY, Hoshino M, et al. A new optical coherence tomography-based calcium scoring system to predict stent underexpansion. EuroIntervention 2018; 13: e2182–e2189.
- 18.
Ramcharitar S, Onuma Y, Aben JP, Consten C, Weijers B, Morel MA, et al. A novel dedicated quantitative coronary analysis methodology for bifurcation lesions. EuroIntervention 2008; 3: 553–557.
- 19.
Jang I-K, Tearney GJ, Macneill B, Takano M, Moselewski F, Iftima N, et al. In vivo characterization of coronary atherosclerotic plaque by use of optical coherence tomography. Circulation 2005; 111: 1551–1555.
- 20.
Fujino Y, Attizzani GF, Tahara S, Takagi K, Naganuma T, Wang W, et al. Impact of main-branch calcified plaque on side-branch stenosis in bifurcation stenting: An optical coherence tomography study. Int J Cardiol 2014; 176: 1056–1060.
- 21.
Kini AS, Yoshimura T, Vengrenyuk Y, Amirian J, Hasan C, Baber U, et al. Plaque morphology predictors of side branch occlusion after main vessel stenting in coronary bifurcation lesions: Optical coherence tomography imaging study. JACC Cardiovasc Interv 2016; 9: 862–865.
- 22.
Xu J, Hahn JY, Song YB, Choi SH, Choi JH, Lu C, et al. Carina shift versus plaque shift for aggravation of side branch ostial stenosis in bifurcation lesions: Volumetric intravascular ultrasound analysis of both branches. Circ Cardiovasc Interv 2012; 5: 657–662.
- 23.
He Y, Zhang D, Yin D, Zhu C, Feng L, Song C, et al. An angiographic tool based on Visual estimation for Risk prEdiction of Side branch OccLusion in coronary bifurcation interVEntion: The V-RESOLVE score system. Catheter Cardiovasc Interv 2018; 91: 591–598.
- 24.
Hong SJ, Zhang JJ, Mintz GS, Ahn CM, Kim JS, Kim BK, et al. Improved 3-year cardiac survival after IVUS-guided long DES implantation: A patient-level analysis from 2 randomized trials. JACC Cardiovasc Interv 2022; 15: 208–216.
- 25.
Secco GG, Rittger H, Hoffmann S, Richardt G, Abdel-Wahab M, Reinecke H, et al. The Glider registry. Catheter Cardiovasc Interv 2017; 89: E1–E6.
- 26.
Ye F, Chen SL, Zhang JJ, Zhu ZS, Kan J, Tian NL, et al. Hemodynamic changes of fractional flow reserve after double kissing crush and provisional stenting technique for true bifurcation lesions. Chin Med J (Engl) 2012; 125: 2658–2662.
- 27.
Finet G, Derimay F, Motreff P, Guerin P, Pilet P, Ohayon J, et al. Comparative analysis of sequential proximal optimizing technique versus kissing balloon inflation technique in provisional bifurcation stenting: Fractal coronary bifurcation bench test. JACC Cardiovasc Interv 2015; 8: 1308–1317.
- 28.
Belkacemi A, Stella PR, Chunlai S, Uiterwijk M, Ali D, Agostoni P. Angiographic fate of side branch dissections in bifurcation lesions treated with a provisional single stenting strategy: A post-hoc analysis of the international multicenter randomized DEBIUT study. Catheter Cardiovasc Interv 2014; 83: 539–544.

