Non-Invasive Myocardial Work Indices in Infants Born to Mothers With Diabetes in Pregnancy
論文ID: CJ-22-0804
この記事には本公開記事があります。

詳細
論文ID: CJ-22-0804
Background: This study used echocardiography to investigate non-invasive myocardial work (MCW) indices in infants born to mothers with diabetes mellitus (DM) in pregnancy (gestational DM: GDM), including those diagnosed under novel classification criteria and those with pre-existing DM.
Methods and Results: This single-centered, retrospective study included 25 infants born to mothers with GDM (termed “infant with GDM”), which was diagnosed by oral glucose tolerance test results during pregnancy or the presence of diabetes before the current pregnancy. We evaluated the relationship between the infant’s MCW, such as global constructive work (GCW), global work index (GWI), global work efficiency (GWE), and global wasted work (GWW), and the mother’s GDM maximal HbA1c during pregnancy. HbA1c level in GDM significantly negatively correlated with GWI* (r=−0.565) and GCW* (r=−0.641). In infants with GDM, GWI and GCW were significantly higher with <6.5% HbA1c than in those with >6.5% HbA1c GDM; however, the specific-layer global longitudinal strain analyses did not show any significant differences between the groups. The pressure-strain loop in infants with >6.5% HbA1c in GDM tended to be smaller than in those infants with <6.5% HbA1c GDM.
Conclusions: The hyperglycemic environment of GDM leads to impaired MCW in the infants. MCW is useful for screening for cardiac illnesses among infants with GDM. Appropriate maternal blood glucose management while maintaining HbA1c <6.5% might be beneficial for the cardiac performance of infants with GDM.
During the past 2 decades, the prevalence of diabetes mellitus (DM) in pregnancy (gestational DM: GDM), encompassing those diagnosed under new classification criteria and those with pre-existing DM, has increased in parallel with the increase in obesity and type 2 DM, representing an emerging worldwide epidemic.1 The International Association of Diabetes and Pregnancy Study Groups has recommended new criteria for the diagnosis and classification of hyperglycemia during pregnancy,2 recognizing the increasing prevalence of undiagnosed GDM.3 GDM increases the risk of numerous complications in infants, including both structural and functional cardiovascular diseases. Infants with structurally normal hearts born to mothers with GDM may develop transient myocardial hypertrophy and associated systolic and diastolic dysfunction.4–6 Using the new GDM definition, we previously investigated the cardiac performance of infants with GDM.7 Advances in cardiac imaging of infants have enabled more comprehensive assessments of their myocardial function, which previously could not be achieved using conventional imaging. Myocardial deformation analysis is an emerging quantitative echocardiographic technique for characterizing global and regional ventricular function in infants.7–9 Over the past few years, several 2-dimensional (2D)-speckle tracking echocardiography (STE) studies have demonstrated that myocardial function is impaired in both the fetuses10–12 and infants6,13–15 of mothers with GDM.
Recently, a non-invasive method for myocardial work (MCW) assessment using the regional LV pressure-strain loop area was developed and corresponded well with invasive measurements and directly measured MCW, as well as myocardial metabolism evaluated by positron emission tomography.10 The pressure-strain loop area requires measurement of valvular timing events by echocardiography, left ventricular (LV) longitudinal strain, and peripheral blood pressure (BP). This new sensitive indicator is highly effective in detecting cardiac dysfunction in various childhood and newborn cardiac diseases, including Kawasaki disease,11 and preterm birth.12 The reference ranges for MCW indices have been reported to vary with age.13–15 Recently, we established the reference ranges for MCW parameters in healthy newborns.16
Because there have been few studies reporting non-invasive MCW measurement in infants born to mothers with GDM (termed “infant with GDM”) using the new definition of GDM, that was the focus of the present study.
The study population of mothers with GDM was selected from those attending the Department of Pediatrics, Chutoen Medical Center, between January 2018 and July 2022. Infants were excluded if they were born at gestational age <37 weeks, had congenital heart disease, were outside the size range for their gestational age (defined as a birth weight below or above the 10th percentile for their gestational age17), required artificial ventilation, had Apgar score <7 at 5 min, or demonstrated chromosomal abnormalities. Pregnant women with GDM were defined as those with a glucose metabolism abnormality that existed prior to or began during the current pregnancy and was diagnosed using a simplified, one-step 2-h oral 75-g glucose tolerance test (OGTT).2 Glucose metabolism abnormalities were identified by a fasting blood sugar level ≥92 mg/dL or blood glucose level ≥180 mg/L at 1 h or ≥153 mg/dL at 2 h after consuming the glucose solution. A total of 15 pregnant women underwent the 75-g OGTT, and were diagnosed with GDM at a median gestational age of 19 weeks. Infants with GDM were monitored to determine their blood glucose levels after birth. If <40 mg/dL, an intravenous glucose infusion was administered to maintain optimal glucose levels. The study protocol conformed to the principles of the Declaration of Helsinki and was approved by the Ethics Committee of Chutoen Medical Center (approval date: January 25, 2022; approval no. 177). Using the opt-out approach, informed consent was obtained from the guardians of all subjects in accordance with the Japanese Ethical Guidelines for Medical and Health Research Involving Human Subjects. The explanation for this study was posted on our web homepage, and the data of subjects whose guardians opted out were excluded from the analysis.
Data CollectionBaseline demographic and clinical data were collected from the medical records of all participants. In GDM, HbA1c is measured as an indicator of the degree of blood glucose level during pregnancy. In this study, the highest HbA1c level during pregnancy was used.
For the infants with GDM, echocardiography was performed using a Vivid S5 or Vivid S60N cardiac ultrasound system (GE Healthcare Japan, Tokyo, Japan) with a 6S or 12S sector array transducer while the infant was at rest. All infants underwent routine echocardiography at an average age of 1 day after birth to confirm the closing of a patent ductus arteriosus. The stored digital scans were analyzed using a commercially available software package (automated functional imaging; EchoPAC version 204, GE Healthcare) by an expert blinded to the subjects’ details.
Global MCW AnalysisAt the beginning, the MCW and global longitudinal strain (GLS) values were obtained from apical 2-, 3-, and 4-chamber images. We visually verified these time points in the apical 3-chamber view and manually adjusted them, as necessary, because changes in the heart rate (HR) during the examination can affect the loop area. After entering the peripheral systolic (SBP) and diastolic BP (DBP) values, the software calculated the constructive and wasted work. By aggregating the segmental values for the constructive and wasted work, the software calculated the global constructive work (GCW; mmHg%) and global wasted work (GWW; mmHg%) as the mean of the respective segmental values. Additionally, the software provided the global work index (GWI; mmHg%) and global work efficiency [GWE (%) = GCW / (GCW + GWW)].18
Other MeasurementsMeasurements from basic 2D echocardiograms were obtained using standard procedures.19 The 2D-STE was retrospectively performed using blinded patient data. The software performed speckle tracking over the entire myocardium included in the region of interest, allowing for the assessment of the relationship between layer-specific strain parameters and fundamental anthropometric variables. Automatic tracing of the endocardial border during end-systole was performed in 3 apical views and at 3 levels of the short-axis views to measure longitudinal and circumferential strains. When automatic tracking was inaccurate, appropriate corrections were performed using manual tracking. Subsequently, the software determined the strain values in the transmural and endocardial locations and epicardial strain, and the ratio of endocardial longitudinal (circumferential) strain at end-systole GL(C)S to epicardial GL(C)S.
The end-diastolic volume (EDV) and end-systolic volume (ESV) were estimated using Simpson’s biplane method by auto-tracing the endocardial border in apical 4- and 2-chamber views of the LV at end-diastole and end-systole, respectively. The LV ejection fraction (LVEF) was obtained using Simpson’s biplane method as EDV-ESV.
The intraventricular pressure difference (IVPD) and intraventricular pressure gradient (IVPG) were estimated using color M-mode images to integrate the 1-dimensional Euler equation, as previously described.20 Flow velocity color M-mode images were acquired by aligning the Doppler cursor parallel to the diastolic inflow and were analyzed using MATLAB (MathWorks, Natick, MA, USA) and an image processing algorithm. This method has been previously validated against direct micromanometer measurements,21,22 IVPD and IVPG measurements using color M-mode images are reported to be accurate and reproducible.20 IVPD shows excellent correlation with the tau index, which is the gold standard, albeit invasive, technique for evaluating diastolic function.23 Furthermore, IVPD and IVPG can be determined using color M-mode images for non-invasive estimation of active suction during the cardiac diastolic phase.7
Baseline BP and Cord Blood ExaminationsBP measurements of newborns were performed at the time of echocardiographic evaluation, obtained in the left or right leg while in a relaxed supine position. Data from umbilical cord blood sampling immediately after birth are useful from the medical and medicolegal perspectives, as they provide insight into intrapartum fetal physiology. Therefore, cord blood was collected from the double-clamped cord and analyzed within 15 min of collection.24 Laboratory blood gas analysis was performed using RAPIDPoint 500 (Siemens Healthineers, Tokyo, Japan).
OutcomesThe primary outcome was the effect of glycemic control for GDM on cardiac performance, including myocardial function in infants with GDM. The secondary outcome was a comparison of the cardiac performance of infants with GDM with the degree of blood glucose control in the women with GDM. The HbA1c level was used as an indicator of the blood glucose levels during pregnancy. Appropriate glycemic control during pregnancy was defined as an HbA1c level of 6.5%.24
Statistical AnalysisThe results are expressed as median and interquartile range (IQR). Spearman’s rank correlation was used to evaluate the relationship between HbA1c in GDM and infants with GDM echocardiographic and other findings. Two-sided comparisons between groups were performed using the Mann-Whitney U-test, chi-square test, or Fisher’s exact test, as appropriate. All statistical analyses were performed using IBM SPSS Statistics software version 28 (IBM Corp., Armonk, NY, USA). The significance level was set at P<0.05.
Figure 1 shows the flowchart of the study. Initially, 49 cases of GDM were enrolled and of them we excluded 12 infants: 11 with a normal heart structure but pathological disease (4 low birth weight, 3 neonatal asphyxia, 2 preterm, 1 transient tachypnea of the newborn, and 1 maternal thyroid disease), and 1 with ventricular septal defect. Ten cases of GDM were excluded due to insufficient data, and 2 infants with GDM in whom either the image quality was insufficient such that the 4-, 2-, or 3-chamber views required for fundamental evaluation were not obtained or the HR changed during the examination were excluded. One GDM mother delivered 2 infants with GDM. The final study population comprised 25 infants with GDM and their respective mothers; 10 mothers were identified as having pre-existing type 1 (n=2) or type 2 (n=8) DM and of the remaining 15 mothers identified with GDM following the 75-g OGTT, 7 were one hit, 5 were two hits, and 3 were three hits. In this study, we employ the following definitions: a ‘1 hit’ is defined when one of the three outliers of the 75-g OGTT criteria is met; a ‘2 hit’ is defined when two of the three outliers are met; and a ‘3 hit’ is defined when all three outliers are met. Seven of the mothers with type 1 or 2 DM were receiving insulin before their pregnancy and the others received nutritional counseling from a registered dietitian and were placed on appropriate low-carbohydrate diets. Baseline characteristics and echocardiographic parameters are summarized in Table 1, and Supplementary Table 1.
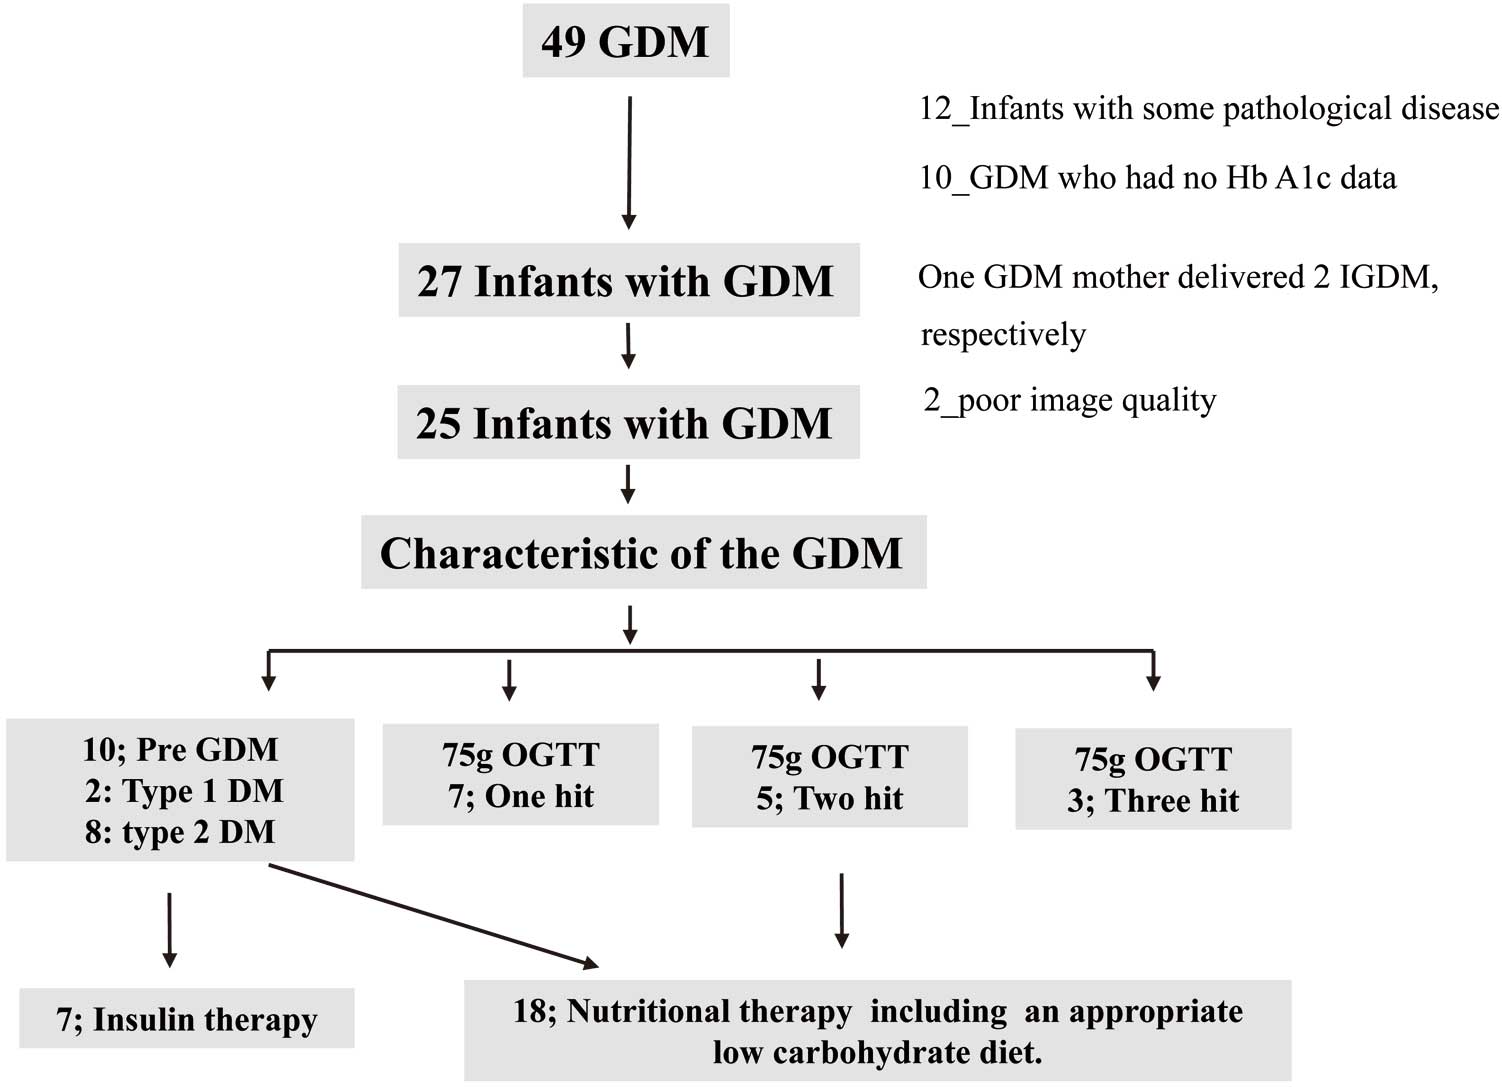
Study design. DM, diabetes mellitus; Infants with GDM, infant born to a mother with diabetes in pregnancy (GDM); GDM, gestational diabetes; OGTT, oral glucose tolerance test.
| Median | IQR | |
|---|---|---|
| Pregnancy characteristics | ||
| Age (years) | 34.0 | 31.0~37.0 |
| HbA1c (%) | 6.0 | 5.4~7.0 |
| Newborn characteristics | ||
| Gestational age (weeks) | 38 | 38~40 |
| Apgar scores (5 min) | 9 | 9~9 |
| Length (cm) | 50.5 | 49.5~51.0 |
| Weight (g) | 3,090 | 2,840~3,470 |
| BSA (m2) | 0.21 | 0.20~0.23 |
| Echocardiography (postnatal day) | 1 | 1~2 |
| Cardiac findings | ||
| HR (beats/min) | 129 | 117~143 |
| SBP (mmHg) | 70 | 61~75 |
| DBP (mmHg) | 40 | 35~44 |
| 2D echocardiography | ||
| Myocardial work | ||
| GWI (mmHg%) | 684.0 | 570.0~864.0 |
| GCW (mmHg%) | 997.0 | 822.0~1,204.0 |
| GWW (mmHg%) | 47.0 | 30.0~76.0 |
| GWE (%) | 94.0 | 92.0~96.0 |
| 2D Speckle strain | ||
| GLS | ||
| Endocardial GLS (%) | −19.7 | −22.1~−17.9 |
| Transmural GLS (%) | −16.8 | −19.2~−14.6 |
| Epicardial GLS( %) | −14.4 | −16.4~−11.6 |
| GCS | ||
| Base endocardial GCS (%) | −21.5 | −26.7~−17.7 |
| Base transmural GCS (%) | −11.4 | −13.2~−9.9 |
| Base epicardial GCS (%) | −6.3 | −8.6~−4.1 |
| Middle endocardial GCS (%) | −23.4 | −27.7~−20.7 |
| Middle transmural GCS (%) | −11.8 | −14.5~−10.3 |
| Middle epicardial GCS (%) | −5.5 | −7.2~−4.4 |
| Apex endocardial GCS (%) | −29.0 | −34.0~−25.8 |
| Apex transmural GCS (%) | −14.7 | −18.0~−11.4 |
| Apex epicardial GCS (%) | −6.4 | −8.8~−4.6 |
| Color-M-mode | ||
| IVPD (mmHg) | 0.92 | 0.75~1.09 |
| IVPG (mmHg) | 0.31 | 0.26~0.38 |
IQR, interquartile range; BSA, body surface area; HR, heart rate; SBP, systolic blood pressure; DBP, diastolic blood pressure; GWI, global work index; GCW, global constructive work; GWW, global wasted work; GWE, global work efficiency; GLS, global longitudinal strain; GCS, global circumferential strain; IVPD, intraventricular pressure difference; IVPG, intraventricular pressure gradient.
The correlation between HbA1c in GDM and the pressure-strain curve in infants with GDM is shown in Table 2, Figure 2, and Supplementary Table 2. There was a significantly negative co-relationship with the GWI, GCW, IVPD, and IVPG in infants with GDM, but a significantly positive co-relationship with the endocardial and transmural GLS. These results indicated that a high HbA1c level in GDM decreases the endocardial and transmural GLS of infants with GDM. In addition, HbA1c in GDM showed a positive correlation with intraventricular septal (IVS) thickness in both diastole and systole using M-mode, and a negative correlation with LVEF by Simpson’s biplane method.
| Myocardial work index | 2D-STE | ||
|---|---|---|---|
| HbA1c | HbA1c | ||
| r | r | ||
| GWI | −0.565** | Endocardial GLS | 0.429* |
| GCW | −0.641** | Transmural GLS | 0.418* |
| GWW | −0.194 | Epicardial GLS | 0.378 |
| GWE | −0.086 | Base endocardial GCS | 0.015 |
| Color M-mode | Base transmural GCS | −0.118 | |
| IVPD | −0.512* | Base epicardial GCS | −0.150 |
| IVPG | −0.480* | Middle endocardial GCS | −0.150 |
| Middle transmural GCS | −0.214 | ||
| Middle epicardial GCS | −0.160 | ||
| Apex endocardial GCS | −0.214 | ||
| Apex transmural GCS | −0.128 | ||
| Apex Epicardial GCS | −0.273 | ||
**P<0.01, *P<0.05. GDM, gestational diabetes mellitus. Other abbreviations as in Table 1.
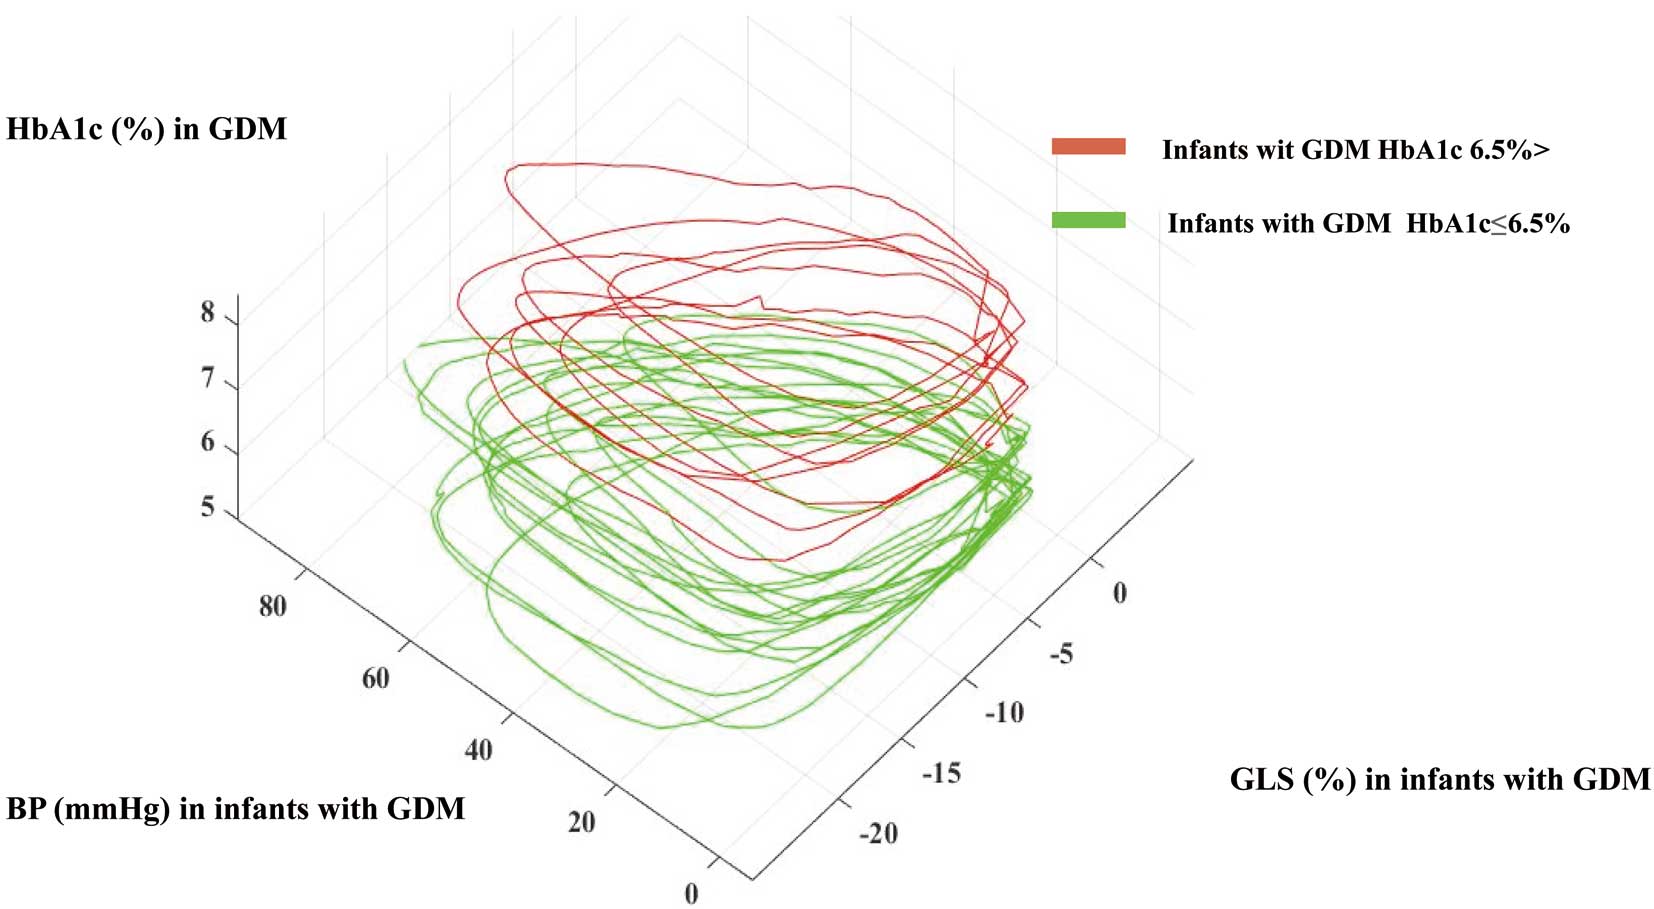
Relationship between HbA1c in GDM and pressure-strain curve in infants with GDM. GLS in infants with GDM was <20% when they were born to mothers with >6.5% HbA1 during pregnancy. The pressure-strain loop in infants with GDM with >6.5% HbA1c in GDM tended to be smaller than in infants with GDM and <6.5% HbA1c. Infants with GDM, infant born to a mother with diabetes in pregnancy (GDM); GDM, gestational diabetes; GLS, global longitudinal strain.
This study compared the baseline characteristics of <6.5% or >6.5% HbgA1c in GDM (Table 3A,B; Supplementary Table 3). There were 8 infants with GDM and HbA1c >6.5%: pre-existing type 1 DM (n=2) and type 2 DM (n=6). Seven women with GDM required insulin therapy during pregnancy. There were no significant differences between the 2 groups concerning gestational age, length, weight, or body surface area. The MCW data showed that GWI and GCW, including z-score using a normal range in the neonatal period,16 was significantly higher in infants with GDM and <6.5% HbA1c than infants with GDM and >6.5% HbA1c (Table 3B). The color M-mode data showed that IVPD and IVPG were higher in infants with GDM and <6.5% HbA1c than in infants with GDM and >6.5% HbA1c. Specific-layer GLS analyses did not show any significant differences between the groups. However, significant differences between groups were observed for IVSd and IVSs (Supplementary Table 3). The relationship between HbA1c in GDM and the pressure-strain curve in infants with GDM is shown in Figure 2. The GLS in infants with GDM was <20% when they were born to mothers with >6.5% HbA1c during pregnancy. The pressure-strain loop in infants with >6.5% HbA1c GDM tended to be smaller than that in infants with GDM and <6.5% HbA1c. During the study period, 1 GDM mother with pre-existing type 1 DM with ongoing insulin administration delivered 2 infants. The HbA1c level was 8.1% in the first infant and 6.9% in the second. The GWI and GCW of the first infant were 670 mmHg% and 992 mmHg%, and those of the second infant was 742 mmHg and 981 mmHg%, respectively.
| (A) | HbA1c ≤6.5% | HbA1c >6.5% | P value |
|---|---|---|---|
| Mothers with GDM | |||
| n | 16 | 9 | |
| DM type | |||
| Type 1 (%) | 0 | 2 (22.2) | <0.001 |
| Type 2 (%) | 1 (6.2) | 6 (66.6) | |
| GDM (%) | 15 (93.8) | 1 (11.1) | |
| Insulin (%) | 0 | 7 (77.8) | <0.001 |
| CS (%) | 2 (12.5) | 3 (42.9) | 0.142 |
| Infant sex male (%) | 7 (43.8) | 5 (55.6) | 0.688 |
| Maternal age (years) | 34.0 [31.0~37.5] | 34.0 [33.0~36.0] | 0.755 |
| Maternal HbA1c (%) | 5.5 [5.3~6.0] | 7.7 [7.0~8.1] | <0.001 |
| Weight before pregnancy (kg) | 60.5 [54.8~72.5] | 60.0 [58.6~63.0] | 0.843 |
| Weight before delivery (kg) | 67.3 [61.7~75.7] | 68.9 [68.5~70.7] | 0.734 |
| Weight gain (kg) | 3.5 [2.0~6.6] | 10.0 [6.1~10.5] | 0.074 |
| preBMI | 24.2 [21.9~28.7] | 23.7 [22.8~26.2] | 0.865 |
| Infants with GDM | |||
| GA | 39.4 [36.7~41.4] | 38.4 [36.4~40.3] | 0.061 |
| Length (cm) | 50.5 [49.4~51.1] | 50.5 [49.5~51.0] | 1.000 |
| Weight (kg) | 3.04 [2.49~3.79] | 3.38 [2.45~3.98] | 0.234 |
| BSA | 0.21 [0.19~0.21] | 0.22 [0.21~0.23] | 0.086 |
| Exam days | 1 [1~2] | 2 [2~2] | 0.0532 |
| Ap5 | 9 [9~9] | 9 [9~9] | 0.169 |
| (B) | Infants with GDM | P value | |
| HbA1c ≤6.5% | HbA1c >6.5% | ||
| n | 16 | 9 | |
| Exam days | 1 [1~2] | 2 [2~2] | 0.053 |
| HR (beats/min) | 130 [119~132] | 120 [117~127] | 0.306 |
| SBP (mmHg) | 70 [65~74] | 70 [56~75] | 0.495 |
| DBP (mmHg) | 40 [36~44] | 37 [32~44] | 0.733 |
| MCW | |||
| GWI (mmHg%) | 826.5 [603.8~958.5] | 653.0 [527.0~742.0] | 0.031 |
| GWI (z-score) | 0.86 [−0.64~1.76] | −0.31 [−1.16~0.29] | |
| GCW (mmHg%) | 1,181.5 [903.8~1,293.5] | 890.0 [735.0~992.0] | 0.027 |
| GCW (z-score) | 0.87 [−0.52~1.43] | −0.59 [−1.36~−0.08] | |
| GWW (mmHg%) | 51.5 [37.3~79.5] | 48.0 [24.0~76.0] | 0.692 |
| GWW (z-score) | −0.23 [−0.74~0.76] | −0.36 [−1.21~0.64] | |
| GWE (%) | 94 [92~96] | 94 [92~96] | 0.649 |
| GWE (z-score) | 0.00 [0.00~0.01] | 0.00 [0.00~0.01] | |
| Color-M-mode | |||
| IVPD (mmHg) | 1.01 [0.86~1.17] | 0.73 [0.63~0.96] | 0.017 |
| IVPG (mmHg) | 0.34 [0.29~0.42] | 0.25 [0.20~0.31] | 0.038 |
| 2DST | |||
| Endocardial GLS (%) | −21.1 [−24.4~−18.6] | −18.9 [−21.1~−17.5] | 0.101 |
| Transmural GLS (%) | −17.6 [−20.9~−15.0] | −16.0 [−18.7~−14.4] | 0.157 |
| Epicardial GLS( %) | −14.9 [−17.5~−12.3] | −12.9 [−15.9~−11.4] | 0.213 |
| Base endocardial GCS (%) | −22.2 [−27.8~−17.1] | −21.5 [−24.0~−18.9] | 0.927 |
| Base transmural GCS (%) | −11.1 [−12.9~−9.0] | −12.6 [−13.3~−10.3] | 0.481 |
| Base epicardial GCS (%) | −5.9 [−8.4~−3.9] | −6.9 [−9.1~−5.8] | 0.244 |
| Middle endocardial GCS (%) | −23.8 [−27.5~−20.7] | −23.0 [−29.1~−20.8] | 0.789 |
| Middle transmural GCS (%) | −11.3 [−14.5~−10.2] | −13.2 [−15.8~−10.9] | 0.504 |
| Middle epicardial GCS (%) | −5.1 [−6.3~−3.8] | −7.0 [−8.5~−5.9] | 0.109 |
| Apex endocardial GCS (%) | −29.7 [−34.0~−25.9] | −28.1 [−33.5~−23.4] | 0.501 |
| Apex transmural GCS (%) | −14.7 [−18.0~−11.6] | −13.4 [−17.8~−11.0] | 0.759 |
| Apex epicardial GCS (%) | −6.2 [−8.8~−4.6] | −7.6 [−9.6~−5.0] | 0.713 |
CS, cesarean section; preBMI, pre pregnany BMI. Other abbreviations as in Tables 1 and 2.
The factors that play a role in the pathogenesis of diabetic cardiomyopathy are persistent hyperglycemia with glycation of interstitial proteins, causing cardiac myopathy, autonomic dysfunction, metabolic and calcium ion channel abnormalities, increased oxidative stress, mitochondrial dysfunction, and altered substrate metabolism.25 The myocardial energy abnormalities in DM involve defects in substrate uptake and use, mitochondrial dysfunction, and impaired energy transfer from the mitochondria to myofibrils. In this study we estimated the relationship between HbA1c during pregnancy in GDM and the cardiac performance of infants with GDM. In addition, we estimated the appropriate HbA1c level in GDM to clarify when the pediatric cardiac performance would be favorable.
MCW of Infants With GDMThe MCW data showed that GWI and GCW, including the z-score, were significantly higher in infants with GDM and <6.5% HbA1c than in infants with GDM and >6.5% HbA1c. In additions, the pressure-strain loop in infants with GDM and >6.5% HbA1c GDM tended to be smaller than in infants with GDM and <6.5% HbA1c. HbA1c levels in patients with GDM negatively correlated with GWI and GCW. Mather et al reported that myocardial utilization of fatty acid oxidation in patients with DM was increased, and insulin administration reduced fatty acid oxidation.26 Furthermore, a reduction in fatty acid oxidation with insulin-induced maladaptation during cardiac work was also observed. Increased fatty acid oxidation and decreased glucose utilization are associated with impaired diastolic and systolic cardiac function.27 In another study, insulin-induced fuel shifts were associated with a reduction in both MCW and oxygen consumption.28 Previous studies have shown that glucose metabolism reflects MCW,29 and that the pressure-strain loop area correlates with MCW.10 We speculate that the cause of reduced myocardial function in infants with GDM is associated with myocardial fuel shifts from glucose to fatty acids; however, other experimentally imposed fuel shifts have contradictory results. Previously, we reported that a hyperglycemic environment during pregnancy leads to impaired cardiac performance in infants with GDM, even with the new definition of GDM.7 However, the systolic diastolic performance of infants with GDM immediately transitioning from fetal circulation is higher than normal, which is assumed to be due to the metabolic adaptation of the diabetic myocardium balancing glucose and fatty acid utilization.30 Myocardial adaptation may prevent the heart from failing in diabetic cardiomyopathy, suggesting that restoring the balance between glucose and fatty acid utilization is beneficial for cardiac function.30 Metabolic remodeling of the myocardium may prevent heart failure development.31 The transition to heart failure is generally accepted to be accompanied by a shift in cardiac substrate preference, with greater reliance on glucose utilization and concomitant suppression of fatty acid oxidation.27,32,33 Whether the in vivo myocardial metabolism shifts from glucose, fatty acids, or other substances, such as ketone bodies, is an adaptive or maladaptive process remains unclear.32 In the infant, cardiac performance during the transition period from fetal circulation, and the contribution of fatty acid oxidation to overall energy production increases, and the mechanisms responsible for this switch in energy substrate preference in the myocardium are complex.33 Therefore, further studies are needed to determine the relationship between MCW, fuel selection, and myocardial efficiency in infants with GDM.
Comparison With MCW of Adult DMSimilar research on MCW has been conducted in adults with DM. Wang et al reported that the GWW value in their MCW analysis was significantly higher in patients with DM than in normal controls and that the GWI, GCW, and GWE values were significantly lower in patients with DM than in normal controls.34 Huang et al demonstrated that GWI and GCW significantly differed between controls and DM patients. Additionally, HbA1c levels in patients negatively correlated with GWI and GCW.35 Liao et al reported that GWI was significantly reduced in the DM group than in the control group; however, GCW showed no significant difference, and GWW was significantly greater in the DM group, which led to a decrease in the GWE in patients with DM.36 Therefore, it is important to set a reference range for MCW values in newborns with physiologically low BP. The serial change in BP with age in the newborn period suggests that MCW may also be affected by age. In this study we observed similar results for MCW using echocardiography between infants and adult patients with DM. We believe that these results might be due to similar pathological findings.
Other Cardiac Parameters of Infants With GDMRegarding other cardiac parameters, IVS thickness showed a positive correlation with HbA1c in GDM, and infants with GDM, born to GDM mothers with HbA1c >6.5%, had thicker IVS than those born to GDM mothers with HbA1c <6.5%. Additionally, HbA1c in GDM showed a positive correlation with endocardial and transmural GLS and a negative correlation with LVEF. For IVIG and IVPG, HbA1c in GDM showed a negative correlation, and infants with GDM born to GDM mothers with HbA1c <6.5% during pregnancy had higher negative correlation than those born to GDM mothers with HbA1c >6.5%. Cardiac hypertrophy in infants with GDM may be caused by fetal hyperinsulinemia, which increases the synthesis and deposition of fat and glycogen in the myocardial cells.37 Reduced contractility and its underlying causes include insulin signal changes, apoptosis, and necrosis, leading to the loss of contractile cells and stress on the endoplasmic reticulum.38 Characterizing myocardial adaptation using echocardiography is important to identify and manage circulatory disturbances during the critical periods of development in infants.39 We found that infants with GDM and uncontrolled blood glucose had reduced myocardial deformation components in all directions; however, favorable glycemic control during pregnancy can prevent harmful cardiac effects. There have been few studies exploring the potential impact of HbA1c control during pregnancy on the cardiac function of infants born with GDM. In addition, appropriate GDM blood glucose management and maintaining HbA1c <6.5% during pregnancy might be favorable for the cardiac performance of infants with GDM.
Study LimitationsFirst, there were relatively few subjects and the study was retrospective. Second, because echocardiography was performed, 2 infants were excluded because appropriate quality images for MCW evaluation could not be obtained. When evaluating MCW, it is necessary to match the HR with the measurements in the 4-, 3-, and 2-chamber views. However, the HR fluctuates easily in the neonatal period, so MCW must be evaluated with caution. In addition, GWW was overestimated because 3 outliers were not tracked appropriately, suggesting that more accurate tracking was needed to correctly assess the GWW. Third, because this study was retrospective the timing of HbA1c measurements in GDM may not have been similar. Pregnant women afflicted by pre-conceptional DM and those diagnosed with GDM ought to be regarded as distinct entities.2 Nevertheless, for this study, the classification of GDM encompassed both groups, an approach deemed necessary because the study primarily focused on investigating the effect of maternal glycemic regulation during pregnancy on infant cardiac function. Moving forward, a comparative assessment of neonatal cardiac function between the 2 aforementioned groups is imperative.
Despite these limitations, our study provided some new, substantial insights. Additional studies involving a larger number of individuals are required to confirm the observed correlations.
In GDM, the hyperglycemic environment and uncontrolled blood sugar levels during pregnancy lead to impaired MCW in the infants. MCW has clinical applicability as a useful and sensitive indicator that can predict severe cardiac dysfunction in infants with GDM. Therefore, future studies should focus on the ability of these measures to distinguish myocardial dysfunction secondary to adverse loading conditions from dysfunction due to impairment in intrinsic contractility (or a mixture of both).
The authors are grateful for the valuable assistance of staff in treating the infants admitted to the Department of Pediatrics at the Chutoen General Medical Center. This research received no specific grants from any funding agency in the public, commercial, or not-for-profit sectors. Equipment of the Chutoen General Medical Center was used.
There are no conflicts of interest to declare. This research received no specific grants from any funding agency in the public, commercial, or not-for-profit sectors. Equipment of the Chutoen General Medical Center was used.
Please find supplementary file(s);
https://doi.org/10.1253/circj.CJ-22-0804