Abstract
Background: Coronary healed plaques (HPs) reportedly have high vulnerability or show advanced atherosclerosis and a risk of rapid plaque progression. However, the prognosis of stable angina pectoris (SAP) patients with HPs undergoing percutaneous coronary intervention (PCI) remains under-investigated.
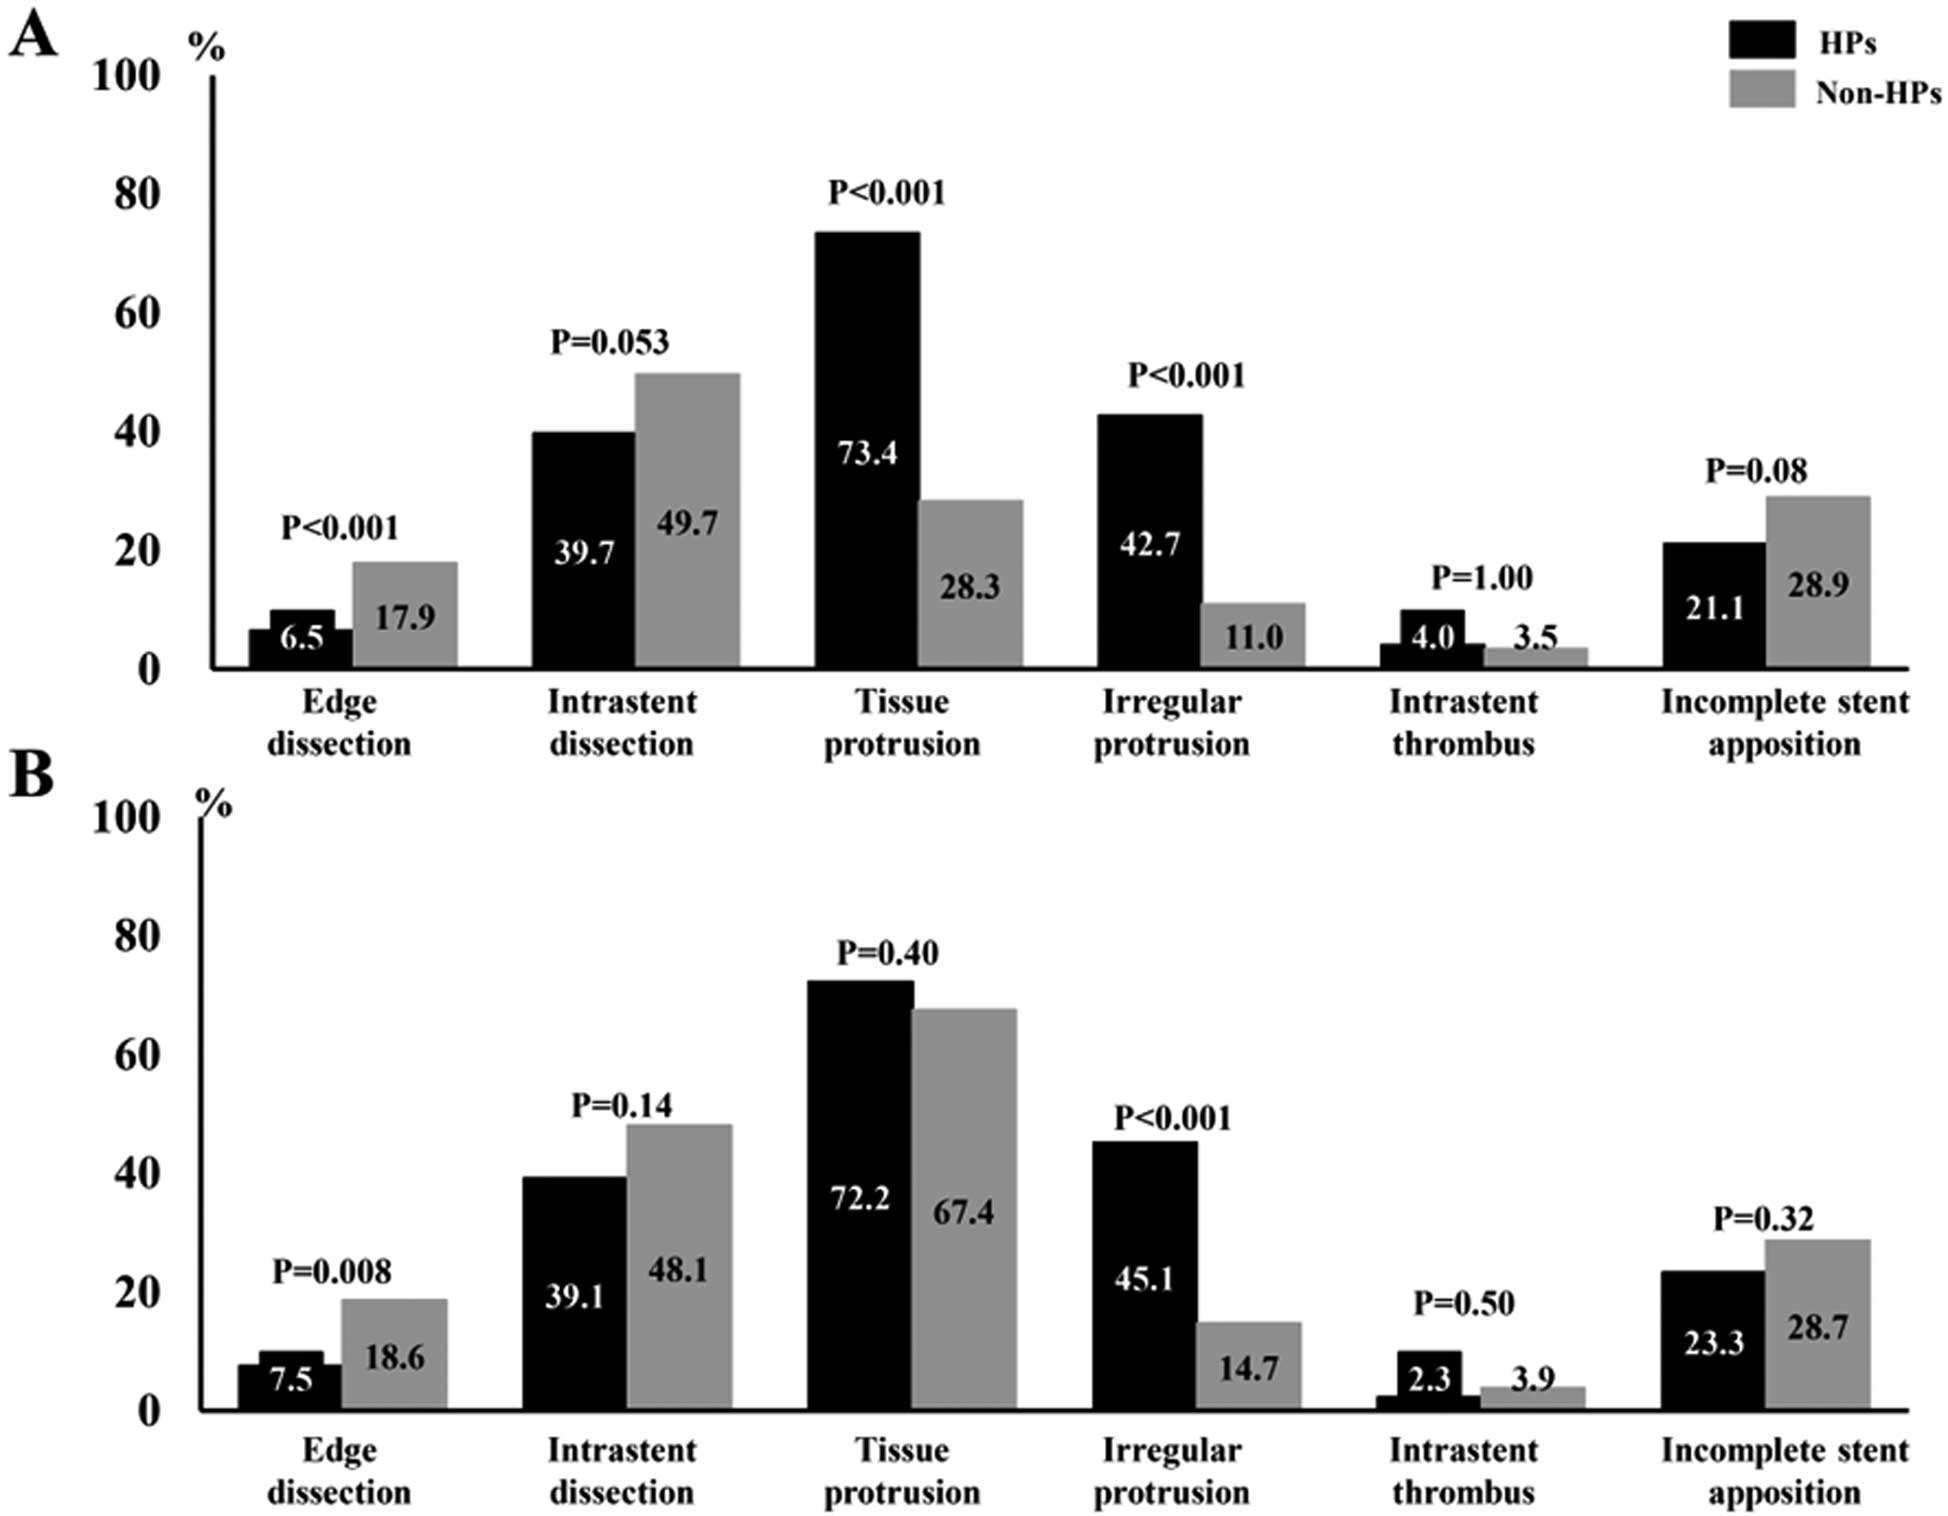
Methods and Results: We analyzed 417 consecutive lesions from SAP patients undergoing pre- and post-intervention optical coherence tomography (OCT) for which HPs were defined as having a layered appearance. We investigated the differences in clinical and lesion characteristics, and post-PCI outcomes between HPs and non-HPs. To account for differences in clinical characteristics, propensity score matching was performed between the groups. HPs were observed in 216 lesions (51.8%) in the total cohort. In the propensity-matched cohort (n=294), HPs had higher rates of angiographic-B2/C lesions (77.6% vs. 59.2%, P<0.001), OCT-lipid-rich plaques (40.8% vs. 25.9%, P=0.007), macrophages (78.2% vs. 44.2%, P<0.001), greater luminal area stenosis (73.5±11.0% vs. 71.5±10.3%, P=0.002), and a higher prevalence of post-stenting irregular tissue protrusion (45.1% vs. 14.7%, P<0.001) than non-HPs. In the total cohort, target lesion revascularization (TLR)-free survival was poorer for HPs (log-rank test 7.66; P=0.006), and Cox proportional hazards analysis showed HP as an independent predictor of TLR (hazard ratio, 5.98; 95% confidence interval, 1.72–20.82; P=0.005).
Conclusions: In SAP patients, HPs had greater complexity of lesions and higher vulnerability, which may have contributed to the poorer post-PCI outcomes.
Histologically, atherosclerosis progression and increasing vulnerability of coronary plaques is the basis for plaque rupture, erosion, or calcified nodules and superimposed thrombus formation, ultimately resulting in acute coronary syndrome (ACS).1 However, most thrombotic lesions remain subclinical and may not cause life-threatening coronary occlusion if the plaque burden or thrombus volume is small.2 Subsequent repair leads to stabilization of the ruptured or eroded site and results in the formation of a healed plaque (HP),1,3,4 which is histologically characterized by distinct layers of organized thrombi and collagen.1,4 The presence of HPs suggests possible plaque progression and stenosis advancement.2,3 Recently, several in vivo studies using high-resolution imaging, primarily by optical coherence tomography (OCT), reported the prevalence of HPs in patients with ACS and stable angina pectoris (SAP) and demonstrated a link between HPs and plaque vulnerability or advancement of atherosclerosis.5–10 An OCT study using a multicenter registry reported HP as an independent predictor of angiography-detected lesion progression.11 Furthermore, culprit HPs might be related to non-culprit plaque vulnerability or poor clinical outcomes.12–14 However, the data regarding outcomes after percutaneous coronary intervention (PCI) for culprit HPs are lacking, especially data from daily clinical practice, although a few multicenter registry studies have reported some outcomes.15,16
OCT, a high-resolution intravascular imaging modality, has high reliability for identifying coronary plaques, which has been validated in a histological study,17 and allows the classification of atherosclerotic coronary plaques in vivo.18
We hypothesized that assessing intracoronary images of HPs in detail and following the patient’s post-PCI clinical course could help us understand the clinical significance of HPs. Accordingly, we investigated HP lesion morphology and plaque characteristics using OCT and post-PCI intrastent findings in patients with SAP and assessed their post-PCI clinical outcomes.
Methods
Study Population
Of the 807 patients who underwent PCI at Yokohama Minami Kyosai Hospital between November 2018 and January 2021, 469 consecutive, single-culprit, native and de novo coronary artery lesions from 469 SAP patients who underwent OCT examination during PCI were reviewed. Among them, 22 chronic totally occluded lesions, 16 with inability of passing the imaging catheter, and 14 with poor image quality were excluded. We excluded patients with in-stent restenosis, bypass graft lesions, multiple culprit lesions, lesions previously treated at the same culprit site, those undergoing periprocedural imaging other than OCT, and patients with unstable hemodynamic conditions (Supplementary Figure 1). Finally, 417 lesions in 417 patients were analyzed.
SAP patients were defined as having coronary artery lesions with a positive stress test for myocardial ischemia and no change in the frequency, duration, or intensity of angina symptoms within 6 weeks pre-PCI. We routinely perform PCI with OCT guidance, so most of the patients enrolled in this study underwent pre- and post-interventional OCT examination.
Lesions were classified as with or without HPs (HP and non-HP groups). Differences in clinical characteristics, angiographic findings, pre- and post-PCI intracoronary OCT images, and the frequency of major adverse cardiac events (MACE) at follow-up were compared between the groups.
The Institutional Review Committee of Yokohama Minami Kyosai Hospital approved this study, and all patients provided written informed consent.
Angiographic Analysis and Interventional Procedures
Quantitative coronary angiography was performed using QAngio XA 7.3 (Medis Medical Imaging Systems BV, Leiden, the Netherlands). The minimal luminal diameter (MLD), reference vessel diameter, diameter stenosis, and culprit lesion length were measured, and acute gain was calculated using the differences between the pre- and post-PCI values of the MLD. Coronary flow was assessed according to the TIMI flow grade19 and corrected TIMI frame count.20 Coronary angiograms were analyzed by 2 experienced observers blinded to the OCT findings. All patients were treated with aspirin (200 mg loading dose, 100 mg/day) and clopidogrel (300 mg loading dose, 75 mg/day) or prasugrel (20 mg loading dose, 3.75 mg/day). Before PCI, all patients received intravenous heparin (8,000–10,000 IU) and intracoronary nitroglycerin (0.2 mg). The culprit lesion was identified using a combination of coronary angiography, left ventricular wall motion abnormalities, ECG findings, angiographic lesion morphology, and scintigraphic or fractional flow reserve evidence of ischemia. Conventional PCI was performed and interventional procedures, including the use of drug-eluting stents, drug-coated balloon (SeQuent Please, B. Braun, Melsungen, Germany), rotational or orbital atherectomy devices, stent-less PCI, and pharmacotherapy, were chosen at the interventionalist’s discretion. All stent-less PCIs were performed using a drug-coated balloon for lesions that might have been unsuitable for stent implantation, including small vessels, major side branches, or severe calcification due to suboptimal stent apposition and/or expansion. All patients showed <25% residual stenosis after procedures.
OCT Image Acquisition and Analysis
OCT images were acquired with the ILUMIEN OPTIS system and the Dragonfly OPTIS or Dragonfly OpStar imaging catheter (Abbott, Santa Clara, CA, USA) as previously described.21 A 2.7-Fr OCT catheter (Abbott Vascular, Santa Clara, CA, USA) was advanced distal to the lesion, and automatically pulled back at 36 mm/s (180 frames/s) to the proximal end of the lesion in concordance with blood clearance after injecting contrast media or low-molecular weight dextran. All OCT images were analyzed using an offline review workstation by 2 independent investigators who were blinded to the angiographic and clinical data. Discordance between investigators was resolved by consensus diagnosis using repeated offline readings. Cross-sectional OCT images were analyzed with 1.0-mm intervals. Using angiographic references and landmarks, such as the aorto-ostial junction, side branches, and calcification, the image at the culprit lesion site could be locatedion.21
Qualitative and quantitative analyses of lesion morphology, plaque components and immediate post-PCI OCT findings at the culprit site were performed according to previously validated criteria for OCT plaque characterization5–8,21–26 and post-PCI intrastent findings,15,16,22,27 which are summarized in the Supplementary Methods. An HP on OCT was defined as a heterogeneous plaque having ≥1 layers with different optical densities and a distinct border from the underlying components (Figure 1).5–8 In lipid plaques, the lipid arc degrees and overlying fibrous cap thickness at the thinnest part were measured. Lipid-rich plaques, thin-cap fibroatheroma, plaque rupture, intracoronary thrombi, macrophages, microvessels and cholesterol crystals were evaluated.21–25 To determine the calcific content, the maximum value at the culprit site was used and the presence of calcified plaques was assessed (Supplementary Figure 2A).26 Post-PCI OCT findings, including minimum stent area, stent expansion index, stent eccentricity index, presence of stent-edge dissection, in-stent dissection, irregular tissue protrusion (TP), thrombus, and incomplete stent apposition were also evaluated (Supplementary Figure 2B).15,22,27 Irregular TP was defined as protrusion of material with an irregular surface into the lumen between stent struts.27 When it was difficult to differentiate between a thrombus and irregular TP, the mass was categorized as irregular TP, as previously reported.27

Post-PCI clinical complications and outcomes during follow-up were assessed. Post-discharge follow-up data were collected from the outpatient clinic or through telephone interviews. The study endpoints were MACE, defined as cardiac death, recurrent or new-onset unstable angina, nonfatal myocardial infarction (MI), or ischemia-driven target lesion revascularization (TLR). In the present study, cardiac death was defined as death from cardiac causes such as new-onset MI or decompensated/treatment-resistant heart failure. MI was defined as a rise and fall of cardiac troponin or creatine kinase-myocardial band values with ≥1 value above the 99th percentile upper reference limit (URL) and ≥1 of resting or continuous chest pain >30 min during the preceding 48 h, new ischemic ECG change, or new regional cardiac wall motion abnormalities. Patients with suspected ACS that was ruled out for MI with normal cardiac biomarker values (≤99th percentile URL) were defined as having unstable angina.28
All cases of MACE were retrieved and collected from the hospitalization records and diagnosed by a cardiologist.
Statistical Analysis
Categorical data are expressed as absolute frequencies and percentages, compared using the χ2
or Fisher’s exact test, as appropriate. Continuous variables are expressed as mean±standard deviation for normally distributed variables or as median (25–75th percentile) for non-normally distributed variables and compared using Student’s t-test or Mann-Whitney U-test, respectively. Intra- and interobserver agreement for qualitative plaque morphologies determined by OCT were assessed using κ statistics. To reduce bias regarding the presence of HPs, we adjusted for significant differences in clinical characteristics between HPs and non-HPs. Propensity score matching was performed with a 1 : 1 algorithm using nearest neighbor matching with a caliper width of ±0.1 and no replacement. In the total cohort, Kaplan-Meier estimates of ischemia-driven TLR rate distributions were compared using the Mantel-Cox test. Cox regression analyses were performed to assess predictors of TLR during follow-up. Hazard ratios with corresponding 95% confidence intervals were calculated. Variables associated with TLR at P<0.05 in the univariate analyses were included in a multivariate Cox regression analysis. Natural logarithmic transformation was used for regression analyses of non-normally distributed variables. A P value <0.05 was considered statistically significant. IBM SPSS Statistics v. 21.0 software (IBM, Armonk, NY, USA) was used for statistical analyses. Propensity score calculations and propensity score matching were performed using R statistics version 4.1.3 (The R foundations for Statistical Computing, Vienna, Austria).
Results
Baseline Clinical Characteristics, Angiographic Lesion Characteristics and Procedural Results
Patients’ characteristics, laboratory data, angiographic findings, and procedures performed are shown in Table 1. HPs were observed in 216 lesions (51.8%). In the total cohort, HPs were associated with younger age, larger body mass index (BMI), a higher frequency of insulin use, higher values of pre-PCI estimated glomerular filtration rate (eGFR), and lower levels of B-type natriuretic peptide (BNP) than non-HPs. We derived propensity scores for each patient based on age, pre-PCI values of GFR, BNP, insulin use and stent-less PCI, and 147 in each group could be matched between HPs and non-HPs. In the total and matched cohorts, HPs had a higher prevalence of B2/C lesions, eccentric lesions, a lower frequency of angiography-detected calcified lesions, and larger pre-PCI percent-diameter stenosis than non-HPs. HPs also had post-PCI acute gain of lumen diameter, and lower frequency of stent-less PCI than non-HPs only in the total cohort.
Table 1. Baseline Clinical Characteristics and Procedural Results
| |
Total cohort |
Matched cohort |
Total
(n=417) |
HPs
(n=216) |
Non-HPs
(n=201) |
P value |
Total
(n=294) |
HPs
(n=147) |
Non-HPs
(n=147) |
P value |
| Age, years |
73±9 |
71±9 |
74±8 |
<0.001 |
74±8 |
74±8 |
73±9 |
0.55 |
| Male sex |
346 (83.2) |
180 (83.3) |
166 (82.6) |
0.84 |
244 (83.0) |
122 (83.0) |
122 (83.0) |
1.00 |
| BMI, kg/m2 |
24.0±3.3 |
24.3±3.4 |
23.6±3.1 |
0.02 |
23.9±3.3 |
24.1±3.4 |
23.7±3.1 |
0.28 |
| Current smoker |
255 (61.2) |
135 (62.5) |
120 (59.7) |
0.51 |
176 (59.9) |
88 (59.9) |
88 (59.9) |
1.00 |
| Diabetes mellitus |
202 (48.4) |
112 (51.9) |
90 (44.8) |
0.15 |
137 (46.6) |
70 (47.6) |
67 (59.2) |
0.73 |
| Hypertension |
298 (71.4) |
152 (70.4) |
146 (72.6) |
0.61 |
207 (70.4) |
104 (70.7) |
103 (70.1) |
0.90 |
| Dyslipidemia |
298 (71.4) |
154 (71.3) |
144 (71.6) |
0.94 |
201 (68.4) |
99 (67.3) |
102 (69.4) |
0.71 |
| Previous MI |
90 (21.6) |
45 (20.8) |
45 (22.4) |
0.70 |
64 (21.8) |
28 (19.0) |
36 (24.5) |
0.26 |
| Previous PCI |
180 (43.2) |
97 (44.9) |
83 (41.3) |
0.46 |
124 (42.2) |
64 (43.5) |
60 (40.8) |
0.64 |
| Previous CABG |
12 (2.9) |
5 (2.3) |
7 (3.5) |
0.56 |
8 (2.7) |
3 (2.0) |
5 (3.4) |
0.72 |
| Chronic kidney disease |
141 (33.8) |
69 (31.9) |
72 (35.8) |
0.40 |
109 (37.1) |
55 (37.4) |
54 (36.7) |
0.90 |
| Baseline LVEF, % |
60.3±13.3 |
61.2±12.6 |
59.3±14.0 |
0.15 |
59.9±13.5 |
60.9±13.1 |
58.9±13.8 |
0.20 |
| Medications |
| Aspirin |
387 (92.8) |
202 (93.6) |
185 (92.0) |
0.56 |
274 (93.2) |
138 (93.9) |
136 (92.5) |
0.82 |
| P2Y12 inhibitors |
369 (88.5) |
197 (91.2) |
172 (85.6) |
0.07 |
259 (88.1) |
133 (90.5) |
126 (85.7) |
0.21 |
| DAPT |
358 (85.9) |
189 (87.5) |
169 (84.1) |
0.32 |
252 (85.7) |
128 (87.1) |
124 (84.4) |
0.62 |
| β-blocker |
193 (46.3) |
96 (44.4) |
97 (48.3) |
0.44 |
137 (46.6) |
65 (44.2) |
72 (49.0) |
0.41 |
| Statin |
352 (84.4) |
185 (85.6) |
167 (83.1) |
0.47 |
250 (85.0) |
127 (86.4) |
123 (83.7) |
0.51 |
| ACE-I or ARB |
221 (53.0) |
113 (52.3) |
108 (53.7) |
0.77 |
158 (53.7) |
79 (53.7) |
79 (53.7) |
1.00 |
| Insulin therapy |
56 (13.4) |
40 (18.5) |
16 (8.0) |
0.002 |
23 (7.8) |
11 (7.5) |
12 (8.2) |
0.83 |
| Laboratory data |
| HDL-C, mg/dL |
48.7±12.9 |
47.8±12.7 |
49.8±13.2 |
0.11 |
49.3±13.1 |
48.0±12.2 |
50.5±13.8 |
0.10 |
| LDL-C, mg/dL |
87.9±30.6 |
87.3±30.4 |
88.6±30.8 |
0.68 |
89.2±31.8 |
89.8±32.1 |
88.5±31.5 |
0.73 |
| Triglyceride, mg/dL |
145.4±89.1 |
149.9±96.7 |
140.7±80.2 |
0.30 |
142.7±83.5 |
143.7±82.7 |
141.6±84.6 |
0.83 |
| Hemoglobin A1c, % |
6.6±1.1 |
6.7±1.2 |
6.5±1.0 |
0.22 |
6.5±1.1 |
6.6±1.2 |
6.5±1.1 |
0.97 |
| eGFR, mL/min/1.73 m2 |
59.9±20.5 |
61.8±20.9 |
57.9±20.0 |
0.05 |
58.9±19.9 |
59.5±19.6 |
58.2±20.3 |
0.56 |
| BNP, pg/mL |
39.2
(15.5–99.1) |
33.7
(14.0–87.3) |
50.5
(19.6–128.7) |
0.008 |
42.5
(18.1–101.0) |
42.8
(19.3–96.4) |
39.0
(16.6–106.9) |
0.90 |
| hs-cTnI, ng/L |
9 (5.0–31.5) |
9 (5–29) |
10 (5–33) |
0.35 |
10 (5–27) |
10 (5–29) |
10 (5–26) |
0.57 |
| hs-CRP, mg/dL |
0.11
(0.05–0.40) |
0.10
(0.05–0.34) |
0.13
(0.05–0.46) |
0.20 |
0.10
(0.04–0.34) |
0.10
(0.04–0.29) |
0.10
(0.04–0.40) |
0.61 |
| Angiographic data |
| LAD/RCA/LCX/LMT |
200/106/98/13
(48.0/25.4/
23.5/3.1) |
100/61/47/8
(46.3/28.2/
21.8/3.7) |
100/45/51/5
(49.8/22.3/
25.4/2.5) |
0.43 |
144/76/67/7
(49.0/25.9/
22.8/2.4) |
69/43/32/3
(46.9/29.3/
21.8/2.0) |
75/33/35/4
(51.0/22.4/
23.8/2.7) |
0.61 |
| B2/C lesion* |
287 (68.8) |
170 (78.7) |
117 (58.2) |
<0.001 |
201 (68.4) |
114 (77.6) |
87 (59.2) |
<0.001 |
| Eccentric lesions |
187 (44.8) |
121 (56.0) |
66 (32.8) |
<0.001 |
123 (41.8) |
75 (51.0) |
48 (32.7) |
0.001 |
| Calcified lesions |
126 (30.2) |
52 (24.1) |
74 (36.8) |
0.005 |
93 (31.6) |
38 (25.9) |
55 (37.4) |
0.03 |
| Pre-PCI MLD, mm |
0.99±0.37 |
0.96±0.34 |
1.02±0.40 |
0.08 |
0.99±0.39 |
0.95±0.35 |
1.03±0.42 |
0.11 |
| Pre-PCI RD, mm |
2.60±0.43 |
2.63±0.40 |
2.56±0.45 |
0.09 |
2.62±0.44 |
2.65±0.41 |
2.59±0.46 |
0.18 |
| Pre-PCI DS, % |
62.0±11.9 |
63.4±12.0 |
60.5±11.7 |
0.01 |
62.4±12.3 |
63.9±12.2 |
60.8±12.3 |
0.03 |
Pre-PCI lesion length,
mm |
20.6±8.1 |
21.2±8.3 |
20.0±8.0 |
0.13 |
20.4±7.9 |
20.9±8.1 |
19.9±7.8 |
0.25 |
| Pre-PCI TIMI flow 2 |
20 (4.8) |
12 (5.6) |
8 (4.0) |
0.45 |
14 (4.8) |
8 (5.4) |
6 (4.1) |
0.58 |
| Pre-PCI CTFC |
13.2±8.6 |
13.6±8.6 |
12.7±8.5 |
0.32 |
12.7±7.2 |
13.2±7.0 |
12.2±7.3 |
0.22 |
| Procedural results |
| Stent number |
1.0±0.3 |
1.0±0.3 |
1.0±0.2 |
0.84 |
1.0±0.3 |
1.0±0.3 |
1.0±0.2 |
0.62 |
| Stent size, mm |
2.90±0.63 |
2.92±0.63 |
2.88±0.62 |
0.58 |
2.90±0.64 |
2.88±0.66 |
2.91±0.62 |
0.78 |
| Stent length, mm |
22.3±8.5 |
22.8±8.4 |
21.8±8.6 |
0.25 |
21.9±8.3 |
22.3±8.1 |
21.6±8.5 |
0.53 |
| Post-PCI MLD, mm |
2.39±0.47 |
2.40±0.43 |
2.37±0.52 |
0.46 |
2.41±0.47 |
2.41±0.43 |
2.41±0.51 |
0.93 |
| Post-PCI DS, % |
13.7±7.6 |
13.7±7.2 |
13.8±7.9 |
0.97 |
13.5±7.5 |
13.3±7.0 |
13.6±7.9 |
0.76 |
Post-PCI acute gain,
mm |
1.39±0.45 |
1.45±0.45 |
1.35±0.45 |
0.03 |
1.42±0.45 |
1.45±0.46 |
1.38±0.44 |
0.20 |
| Final CTFC |
10.9±5.3 |
11.3±5.8 |
10.5±4.7 |
0.10 |
10.8±5.5 |
10.9±6.0 |
10.7±5.0 |
0.71 |
Atherectomy device
use** |
35 (8.4) |
13 (6.0) |
22 (10.9) |
0.07 |
26 (8.8) |
10 (6.9) |
16 (10.9) |
0.22 |
| Stent-less PCI |
45 (10.8) |
17 (7.9) |
28 (13.9) |
0.047 |
32 (10.9) |
14 (9.5) |
18 (12.2) |
0.45 |
| Peak cTnI, ng/L |
216
(66–724) |
193
(57–643) |
254
(89–822) |
0.17 |
232
(81–741) |
200
(59–725) |
253
(100–775) |
0.40 |
| |
Total
(n=372) |
HPs
(n=199) |
Non-HPs
(n=173) |
P value |
Total
(n=262) |
HPs
(n=133) |
Non-HPs
(n=129) |
P value |
| Post-stenting MLD, mm |
2.45±0.44 |
2.44±0.41 |
2.46±0.47 |
0.71 |
2.46±0.43 |
2.44±0.40 |
2.48±0.46 |
0.51 |
| Post-stenting DS, % |
13.1±7.2 |
13.2±6.9 |
13.1±7.6 |
0.91 |
12.8±7.1 |
12.6±6.6 |
13.0±7.5 |
0.62 |
Post-stenting acute gain,
mm |
1.45±0.43 |
1.48±0.44 |
1.41±0.43 |
0.14 |
1.47±0.43 |
1.48±0.45 |
1.45±0.41 |
0.44 |
| Post-stenting CTFC |
11.0±5.4 |
11.4±6.0 |
10.4±4.5 |
0.07 |
10.8±5.6 |
11.0±6.2 |
10.7±4.9 |
0.67 |
Data are presented as n (%), mean±standard deviation, or median (interquartile range). *Lesion complexity assessed according to the modified classification of the American College of Cardiology/American Heart Association. **Rotational or orbital atherectomy use. ACE-I, angiotensin-converting enzyme inhibitor; ACS, acute coronary syndrome; ARB, angiotensin-receptor blocker; BMI, body mass index; BNP, B-type natriuretic peptide; CABG, coronary artery bypass graft; CTFC, corrected TIMI frame count; DAPT, dual antiplatelet therapy; DS, diameter stenosis; eGFR, estimated glomerular filtration rate; HDL-C, high-density lipoprotein-cholesterol; hs-CRP, high-sensitivity C-reactive protein; hs-cTnI, high-sensitivity cardiac troponin-I; HP, healed plaque; LAD, left anterior descending artery; LCX, left circumflex artery; LDL-C, low-density lipoprotein-cholesterol; LMT, left main trunk artery; LVEF, left ventricular-ejection fraction; MI, myocardial infarction; MLD, minimal luminal diameter; PCI, percutaneous coronary intervention; RCA, right coronary artery; RD, reference vessel diameter; TIMI, Thrombolysis in Myocardial Infarction.
In the subgroups undergoing PCI with stent implantations, there were no significant differences in post-PCI angiographic outcomes between HPs and non-HPs in the total and matched cohorts.
Pre- and Post-PCI OCT Findings
Pre-PCI OCT showed that HPs had a smaller pre-PCI minimum lumen area, greater percentage of lumen area stenosis, larger lipid arcs, greater lipid lengths, and higher rates of OCT-lipid-rich plaques, macrophages, microvessels, and cholesterol crystals than non-HPs. HPs had a smaller calcification arc, shorter calcification length, and lower rate of OCT-detected calcified lesions than non-HPs in the total and matched cohorts (Table 2; Figure 2). In subgroups undergoing stent implantations, HPs had greater stent-expansion and stent-symmetry indexes, lower frequency of stent-edge dissection, as well as higher rates of TP and irregular TP than non-HPs in the total and matched cohorts (Table 2; Figure 3).
Table 2. Quantitative OCT Findings
| |
Total cohort |
Matched cohort |
Total
(n=417) |
HPs
(n=216) |
Non-HPs
(n=201) |
P value |
Total
(n=294) |
HPs
(n=147) |
Non-HPs
(n=147) |
P value |
| Minimum lumen area, mm2 |
1.30±0.73 |
1.19±0.60 |
1.41±0.85 |
0.003 |
1.32±0.77 |
1.19±0.61 |
1.44±0.90 |
0.006 |
| Reference lumen area, mm2 |
5.11±2.07 |
5.17±1.98 |
5.05±2.17 |
0.56 |
5.18±2.11 |
5.19±2.06 |
5.18±2.17 |
0.97 |
| Luminal area stenosis, % |
73.5±10.9 |
75.5±11.0 |
71.4±10.5 |
<0.001 |
73.5±11.0 |
75.5±11.3 |
71.5±10.3 |
0.002 |
| Lipid arc, degrees |
133
(0–196) |
153
(0–206) |
104
(0–187) |
<0.001 |
132
(0–197) |
157
(15–206) |
101
(0–187) |
0.001 |
| Fibrous cap thickness, μm |
170
(110–248) |
180
(110–260) |
170
(120–220) |
0.50 |
170
(110–250) |
170
(100–260) |
170
(120–225) |
0.77 |
| Lipid length, mm |
2.9
(0.0–5.5) |
3.9
(0.0–6.0) |
2.0
(0.0–4.5) |
<0.001 |
3.0
(0.0–5.4) |
3.7
(0.7–5.9) |
2.2
(0.0–4.9) |
<0.001 |
| Calcification arc, degrees |
114
(0–200) |
95
(0–174) |
136
(42–226) |
0.002 |
114
(0–204) |
92
(0–173) |
128
(42–227) |
0.02 |
| Calcification thickness, μm |
650
(0–870) |
600
(0–838) |
700
(335–920) |
0.03 |
650
(0–880) |
620
(0–858) |
700
(320–880) |
0.12 |
| Calcification length, mm |
4.8
(0.0–11.0) |
3.8
(0.0–9.6) |
5.8
(1.9–13.2) |
0.003 |
4.6
(0.0–11.0) |
3.7
(0.0–9.8) |
5.7
(1.6–13.0) |
0.02 |
| |
Total
(n=372) |
HPs
(n=199) |
Non-HPs
(n=173) |
P value |
Total
(n=262) |
HPs
(n=133) |
Non-HPs
(n=129) |
P value |
| Post-stenting MSA, mm2 |
5.29±1.79 |
5.42±1.66 |
5.14±1.92 |
0.14 |
5.31±1.85 |
5.38±1.69 |
5.24±2.00 |
0.53 |
| Post-stenting expansion index |
0.83±0.16 |
0.85±0.17 |
0.82±0.15 |
0.04 |
0.83±0.15 |
0.85±0.16 |
0.81±0.14 |
0.03 |
| Post-stenting symmetry index |
0.81±0.09 |
0.82±0.09 |
0.80±0.09 |
0.01 |
0.81±0.09 |
0.83±0.09 |
0.80±0.09 |
0.01 |
Data are presented as n (%), mean±standard deviation, or median (interquartile range). MSA, minimum stent area; OCT, optical coherence tomography. Other abbreviations as in Table 1.

Median follow-up duration was 413 (range, 292–593) days in the total and 431 (308–622) days in the matched cohort. Post-PCI ischemia-driven TLR and MACE were significantly more frequent in patients with HPs than in those with non-HPs in the total and matched cohorts (Table 3). In the total cohort, patients with HPs showed worse TLR-free survival than those with non-HPs (Figure 4). Diabetes mellitus (DM), insulin use, stent-less PCI and HPs, which were associated with TLR at P<0.05 in the univariate analyses, were selected in the multivariate Cox regression analysis, which revealed that stent-less PCI and HPs remained independent predictors of TLR during follow-up in the total cohort (Table 4).
Table 3. Cardiac Events During Follow-up
| |
Total cohort |
Matched cohort |
Total
(n=417) |
HPs
(n=216) |
Non-HPs
(n=201) |
P value |
Total
(n=294) |
HPs
(n=147) |
Non-HPs
(n=147) |
P value |
| Cardiac death |
2 (0.5) |
1 (0.5) |
1 (0.5) |
0.96 |
2 (0.7) |
1 (0.7) |
1 (0.7) |
1.00 |
| Unstable angina |
7 (1.7) |
4 (1.9) |
3 (1.5) |
0.78 |
6 (2.0) |
4 (2.7) |
2 (1.4) |
0.68 |
| Nonfatal MI |
4 (1.0) |
3 (1.4) |
1 (0.5) |
0.35 |
3 (1.0) |
3 (2.0) |
0 (0.0) |
0.25 |
| Ischemia-driven TLR |
19 (4.6) |
16 (7.4) |
3 (1.5) |
0.004 |
15 (5.1) |
12 (8.2) |
3 (2.0) |
0.02 |
| MACE* |
22 (5.3) |
18 (8.3) |
4 (2.0) |
0.004 |
18 (6.1) |
14 (9.5) |
4 (2.7) |
0.03 |
Data are presented as n (%), mean±standard deviation, or median (interquartile range). *Includes cardiac death, unstable angina, nonfatal MI, or ischemia-driven TLR. MACE, major adverse cardiac event; TLR, target lesion revascularization. Other abbreviations as in Table 1.

Table 4. Factors Related to Ischemia-Driven TLR in the Total Cohort
| |
Univariate Cox regression analysis |
| HR |
95% CI |
P value |
| Age, per 1-year increment |
0.97 |
0.92–1.01 |
0.15 |
| Male sex |
1.12 |
0.33–3.84 |
0.86 |
| BMI |
0.92 |
0.78–1.07 |
0.27 |
| Current smoker |
1.86 |
0.67–5.18 |
0.23 |
| Diabetes mellitus |
3.10 |
1.12–8.63 |
0.03 |
| Hypertension |
1.22 |
0.44–3.40 |
0.70 |
| Dyslipidemia |
1.44 |
0.48–4.34 |
0.52 |
| Previous MI |
0.94 |
0.31–2.82 |
0.91 |
| Previous PCI |
0.55 |
0.21–1.46 |
0.23 |
| Chronic kidney disease |
0.58 |
0.19–1.76 |
0.34 |
| Baseline LVEF, per 1-% increment |
0.98 |
0.95–1.01 |
0.26 |
| Aspirin use |
1.33 |
0.18–9.97 |
0.78 |
| Statin use |
0.51 |
0.18–1.41 |
0.19 |
| ACE-I or ARB use |
1.00 |
0.41–2.47 |
0.99 |
| β-blocker |
0.81 |
0.33–2.03 |
0.66 |
| Insulin use |
3.90 |
1.53–9.90 |
0.004 |
| HDL-C, per 1-mg/dL increment |
0.99 |
0.95–1.03 |
0.53 |
| LDL-C, per 1-mg/dL increment |
1.01 |
0.99–1.02 |
0.32 |
| Triglyceride, per 1-mg/dL increment |
1.00 |
1.00–1.01 |
0.25 |
| Hemoglobin A1c, per 1-% increment |
1.16 |
0.84–1.60 |
0.37 |
| eGFR, per 1-mL/min/1.73 m2 increment |
1.01 |
0.98–1.04 |
0.44 |
| BNP, per 10-fold increment |
1.17 |
0.55–2.47 |
0.69 |
| hs-cTnI, per 10-fold increment |
0.97 |
0.55–1.69 |
0.91 |
| hs-CRP, per 10-fold increment |
1.12 |
0.58–2.18 |
0.73 |
| LAD lesion |
0.78 |
0.31–1.94 |
0.59 |
| B2/C* |
3.70 |
0.85–15.97 |
0.08 |
| Pre-PCI MLD, per 1-mm increment |
0.50 |
0.14–1.77 |
0.28 |
| Pre-PCI RD, per 1-mm increment |
0.37 |
0.11–1.23 |
0.11 |
| Pre-PCI DS, per 1-% increment |
1.01 |
0.98–1.05 |
0.67 |
| Pre-PCI lesion length, per 1-mm increment |
0.99 |
0.93–1.05 |
0.66 |
| Pre-PCI CTFC |
0.93 |
0.85–1.03 |
0.15 |
| Post-PCI MLD, per 1-mm increment |
0.57 |
0.21–1.59 |
0.28 |
| Post-PCI DS, per 1-% increment |
0.99 |
0.92–1.06 |
0.68 |
| Acute gain, per 1-mm increment |
0.82 |
0.29–2.31 |
0.71 |
| Final CTFC |
1.00 |
0.91–1.09 |
0.94 |
| Atherectomy device use** |
2.52 |
0.73–8.79 |
0.14 |
| Stent-less PCI |
5.01 |
1.89–13.26 |
0.001 |
| Peak cTnI, per 10-fold increment |
0.95 |
0.52–1.74 |
0.88 |
| OCT-lipid-rich plaque |
0.66 |
0.24–1.81 |
0.43 |
| OCT-thin-cap fibroatheroma |
0.95 |
0.22–4.10 |
0.94 |
| OCT-thrombus |
0.99 |
0.14–7.31 |
0.99 |
| OCT-macrophage |
0.95 |
0.38–2.38 |
0.92 |
| OCT-cholesterol crystals |
1.13 |
0.43–2.97 |
0.81 |
| OCT-micro-vessels |
1.15 |
0.38–3.45 |
0.81 |
| OCT-calcification |
1.37 |
0.55–3.41 |
0.50 |
| OCT-healed plaque |
4.83 |
1.41–16.58 |
0.01 |
| OCT-MSA per 1-mm2 increment |
0.90 |
0.64–1.26 |
0.54 |
| OCT-symmetry index |
0.24 |
0.0006–93.56 |
0.64 |
| OCT-edge dissection |
2.45 |
0.67–8.91 |
0.17 |
| OCT-irregular tissue protrusion |
0.80 |
0.22–2.91 |
0.74 |
| OCT-incomplete stent apposition |
1.17 |
0.36–3.82 |
0.79 |
| |
Multivariate Cox regression analysis |
| HR |
95% CI |
P value |
| Stent-less PCI |
6.62 |
2.47–17.74 |
<0.001 |
| OCT-healed plaques |
5.98 |
1.72–20.82 |
0.005 |
*Lesion complexity assessed according to the modified classification of the American College of Cardiology/American Heart Association. **Rotational or orbital atherectomy use. CI, confidence interval; HR, hazard ratio. Other abbreviations as in Tables 1–3.
Intra- and interobserver agreement values were good regarding the identification of OCT findings (HPs [intra-observer variability, κ=0.91 and interobserver variability, κ=0.85], thin-cap fibroatheroma [κ=0.93 and κ=0.87], plaque rupture [κ=0.94 and κ=0.88], macrophages [κ=0.87 and κ=0.81], and irregular TP [κ=0.90 and κ=0.83]).
Discussion
Clinical and Angiographic Data of HP Lesions
In the present study, HPs were associated with younger age, higher BMI, higher pre-PCI eGFR values, and lower BNP levels than non-HPs. HPs had a higher frequency of being lipid-rich and a lower prevalence of calcified lesions than non-HPs, possibly contributing to the differences in clinical characteristics between the groups. Calcified lesions were related to older age and renal or cardiac dysfunction.29,30 Younger age or less frequent calcification in HPs is consistent with a previous study,8 suggesting that HP formation during atherosclerosis progression might be independent of the aging risk. On the other hand, the present study showed a higher frequency of insulin use in patients with HPs than in those without, although there were no differences in the frequency of DM or HbA1c values between the groups. Previous studies have also reported that HPs were more frequently observed in patient with DM or those with higher HbA1c values.6,8,13,31 In DM patients, vascular complications, including thrombotic events, might be induced by increased oxidative stress, inflammatory response, and endothelial dysfunction.32 Pathological studies have shown that coronary plaques in DM patients have a larger necrotic core and greater inflammation with macrophage accumulation or T lymphocytes, and higher incidence of HP rupture and thrombus formation than in non-DM patients.33 Increased insulin use, reflecting greater DM severity, might contribute to advanced atherosclerosis or high plaque vulnerability in patients with HPs. As far as we know, no previous studies have reported a relationship between HPs and BMI. We speculate that it might be influenced by other patient characteristics in the present study, such as young age and high frequency of insulin use. A previous study reported that BMI positively correlated with early incidence of coronary artery disease (CAD) and in patients diagnosed with CAD, increased BMI was positively associated with the presence of DM.34 In our study, after propensity matching in which age or insulin use were entered, BMI was not significantly different between HP and non-HP lesions.
HPs are reportedly associated with high lesion severity or complexity, such as severe lumen narrowing, high frequency of type B2/C lesions, or large plaque burden.6–10 In the total and matched cohorts of the present study, we found smaller angiographic lumen diameter or OCT-luminal area stenosis, more frequent B2/C lesions and, especially, higher lumen eccentricity, which is also supported by a previous study.7 Eccentric lesions have a vulnerable morphology, associated with advanced atherosclerosis resulting in plaque rupture or erosion.35 The continuation of subclinical plaque disruption or erosion and subsequent thrombosis healing at multiple sites may cause an increased plaque burden and lumen narrowing.11 Lesion severity or complexity, including plaque distribution, might reflect a history of advanced atherosclerosis or subclinical thrombotic events in HPs.
Plaque Components on OCT in HPs
Pathologically, HPs exhibit distinct layers of collagen. HP rupture is characterized by a disrupted fibrous cap with a surrounding repair phenomenon. In the early healing phase, thrombus organization is identified as fibrin-rich with platelets and smooth muscle cell infiltration, which is gradually replaced by granulation tissue with accumulated proteoglycans and type III collagen. In the late phase, type III collagen is eventually replaced by dense, collagen-rich, type I collagen, forming a new fibrous layer that will later be fully reendothelialized.1,4 Healed erosions have distinct layers of dense collagen with smooth muscle cells and proteoglycans, often containing fibrin and/or platelets without a necrotic core.1 The present study showed that HPs in SAP patients had a higher prevalence of lipid-rich plaques, macrophages, microvessels, and cholesterol crystals than non-HPs, consistent with previous data.8–10,15,31 Inflammation with macrophage infiltration makes the fibrous cap thinner, leading to cap disruption and thrombus formation,1,4 whereas half of the eroded lesions also have a fibrous cap heavily infiltrated by macrophages.1 Microvessels or cholesterol crystals are also related to vulnerable plaque and might contribute to plaque progression and the lumen narrowing caused by repetitive episodes of plaque rupture/erosion and healing or development of intraplaque hemorrhage.24,25 The histopathological components of HPs might explain the pathogenesis of their formation and the potential risk for future coronary events.
Post-PCI OCT Findings
Because the PCI procedures were left to the interventionalist’s discretion in the present study, the reason why HPs were less likely to be treated with stent-less PCI than non-HPs remains unclear. However, we speculate that it might be due to more severe lumen narrowing or increased prevalence of vulnerable lesions with HPs than with non-HPs. Few studies have assessed the post-PCI intravascular findings of HPs. An OCT study with a multicenter registry reported that HPs showed smaller stent expansion and more eccentric lumens after stenting than non-HPs, although these differences in post-PCI findings between HPs and non-HPs were observed only in ACS but not in SAP patients.15 In contrast, the present study showed that the stent-expansion or stent-symmetry indexes were larger in HPs than in non-HPs. This discrepancy might be due to the differences in clinical and lesion characteristics between studies. Although the present study was a single-center, retrospective study, we enrolled only consecutive SAP lesions. Lesions in patients undergoing PCI with atherectomy devices were not excluded. In a population with more severely calcified lesions than in previous studies, HPs had a higher frequency of being lipid-rich, and conversely, less prevalence of calcification than non-HPs, which may have led to better post-PCI stent-expansion and stent-symmetry indexes, and less frequent stent-edge dissection in HPs than in non-HPs. On the other hand, irregular TP after stenting was more frequently observed in HPs than in non-HPs. HPs had a higher frequency of angiography-detected eccentric plaque distribution and more severe lumen narrowing, reflecting a larger plaque burden than in patients with non-HPs. Nevertheless, HPs may show greater acute gain in lumen diameter on angiography, as well as higher stent-expansion and stent-symmetry indexes than non-HPs. A previous angioscopy study reported that HPs had a higher incidence of thrombi, as well as being lipid-rich, than non-HPs.31 Compression of lipid-rich lesions or large thrombus might lead to the formation of TP, especially with an irregular appearance, after stenting of HPs.
Post-PCI Clinical Outcomes
The post-PCI prognosis of HP culprit lesions is not well-investigated. An OCT study using a multicenter registry targeting patients with ACS and SAP demonstrated that HP culprit lesions had poor post-PCI clinical outcomes, including TLR.16 The present study also showed a higher occurrence of chronic-phase post-PCI MACE for HPs than non-HPs in SAP patients. The mechanism of the poor post-PCI prognosis for HPs remains unclear. MACE in the present study mainly consisted of ischemia-driven TLR. Although a direct link between irregular TP and poor clinical outcomes could not be found in the present study, post-PCI irregular TP might reflect underlying lipid content, thrombus, and local inflammation in HPs.36 The present and previous studies showed that HPs in SAP patients had a higher prevalence of macrophages or microvessels, as well as being lipid-rich.8–10,15,31 Persistent plaque vulnerability and local inflammation might contribute to the higher prevalence of post-PCI irregular TP or TLR in HPs. Irregular TP is identified as a risk for excessive neointimal proliferation27 and might contribute to neoatherosclerosis progression inside the stents.36 To determine the effect of irregular TP on chronic-phase stent outcomes in HPs, serial intrastent OCT examinations are required.
Clinical Implications of HPs
Assessing the clinical implications of HPs in SAP patients is important to understand the mechanism of atherosclerosis progression in coronary artery lesions. The results of the present study suggested that HPs in SAP patients might have underlying plaque characteristics such as persistent vulnerability and local inflammation during the healing process after subclinical plaque rupture or erosion. Even in SAP patients, HPs may be a risk for future coronary events. Additionally, suboptimal stent findings and poor post-PCI prognosis in HP culprit lesions was demonstrated in the present study. On the other hand, stent-less PCI was also identified as an independent predictor of TLR during follow-up. Even post-PCI, the continuation of optimal medical therapy and strict follow-up should be considered for patients with HPs.
Study Limitations
First, this was a single-center, retrospective study, and selection bias may have occurred, such as exclusion of lesions that were difficult to observe using OCT. To reduce selection bias regarding the prevalence of HPs, we performed propensity score matching and successfully adjusted for the differences in clinical characteristics between HPs and non-HPs. Second, there may also be bias regarding PCI procedures; for example, stent-less PCI was performed in approximately 10% of the population in the present study. However, recent studies have reported comparable results between PCI with drug-eluting stents and stent-less PCI using a drug-coated balloon.37 Because stent-less PCI is not a special procedure in current daily clinical practice, the patients who underwent this procedure could not be excluded from the assessment of the clinical significance of HPs. Using multivariate analysis, HPs were identified as a predictor of post-PCI TLR independent of stent-less PCI in the present study. Prospective studies with consistent treatment procedures are needed to confirm the results of our study. Third, we did not perform 3-vessel OCT analysis and therefore the plaque characteristics at non-culprit coronary lesions could not be assessed. The present study sought to assess the prognosis of HP culprit lesions in SAP patients undergoing PCI. To control for this limitation, the present study enrolled only patients with known single-culprit lesions, which likely explains ischemic TLR as the major cause of MACE during follow-up. Fourth, out-of-hospital cardiac events could not be confirmed in the present study because of its retrospective nature. Further prospective studies with more strict follow-up are needed. Finally, although previous studies have demonstrated the high reliability of OCT in evaluating coronary plaque components, the definition of HPs by OCT has been histologically validated in only a few studies.5,8 Further studies are also needed to establish the plaque characterization of HPs.
Conclusions
The present study showed that HPs in SAP patients had higher lesion complexity, greater plaque vulnerability, and higher prevalence of suboptimal intrastent findings, as well as higher frequency of post-PCI ischemia-driven TLR than non-HPs. HPs may reflect not only a previous history of atherosclerosis progression but also a potential risk for future coronary events in SAP patients undergoing PCI. Assessing intracoronary OCT images and determining post-PCI prognosis might help us understand the clinical significances of HPs.
Conflict of Interest
The authors report no conflicts of interest with respect to this manuscript.
IRB Information
The Institutional Review Committee of Yokohama Minami Kyosai Hospital approved this study. All patients provided written informed consent. Reference Number: [1-22-12-9].
Author Contributions
S.K. designed the study. S.K., A.I., M. Shimizu, H.F. collected the clinical data. S.K. performed the statistical analysis and interpretation of data. S.K. drafted or revised the work. M. Shimizu, H.F., M. Suzuki, responsible for the revision of the manuscript. S.K. performed final approval of the manuscript to be submitted. All authors have read and approved submission of this manuscript.
Supplementary Files
Please find supplementary file(s);
https://doi.org/10.1253/circj.CJ-23-0031
References
- 1.
Virmani R, Kolodgie FD, Burke AP, Farb A, Schwartz SM. Lessons from sudden coronary death: A comprehensive morphological classification scheme for atherosclerotic lesions. Arterioscler Thromb Vasc Biol 2000; 20: 1262–1275.
- 2.
Mann J, Davies MJ. Mechanisms of progression in native coronary artery disease: Role of healed plaque disruption. Heart 1999; 82: 265–268.
- 3.
Burke AP, Kolodgie FD, Farb A, Weber DK, Malcom GT, Smialek J, et al. Healed plaque ruptures and sudden coronary death: Evidence that subclinical rupture has a role in plaque progression. Circulation 2001; 103: 934–940.
- 4.
Otsuka F, Joner M, Prati F, Virmani R, Narula J. Clinical classification of plaque morphology in coronary disease. Nat Rev Cardiol 2014; 11: 379–389.
- 5.
Shimokado A, Matsuo Y, Kubo T, Nishiguchi T, Taruya A, Teraguchi I, et al. In vivo optical coherence tomography imaging and histopathology of healed coronary plaques. Atherosclerosis 2018; 275: 35–42.
- 6.
Fracassi F, Crea F, Sugiyama T, Yamamoto E, Uemura S, Vergallo R, et al. Healed culprit plaques in patients with acute coronary syndromes. J Am Coll Cardiol 2019; 73: 2253–2263.
- 7.
Wang C, Hu S, Wu J, Yu H, Pan W, Qin Y, et al. Characteristics and significance of healed plaques in patients with acute coronary syndrome and stable angina: An in vivo OCT and IVUS study. EuroIntervention 2019; 15: e771–e778.
- 8.
Okamoto H, Kume T, Yamada R, Koyama T, Tamada T, Imai K, et al. Prevalence and clinical significance of layered plaque in patients with stable angina pectoris: Evaluation with histopathology and optical coherence tomography. Circ J 2019; 83: 2452–2459.
- 9.
Araki M, Yonetsu T, Russo M, Kurihara O, Kim HO, Shinohara H, et al. Predictors for layered coronary plaques: An optical coherence tomography study. J Thromb Thrombolysis 2020; 4: 886–894.
- 10.
Russo M, Fracassi F, Kurihara O, Kim HO, Thondapu V, Araki M, et al. Healed plaques in patients with stable angina pectoris. Arterioscler Thromb Vasc Biol 2020; 40: 1587–1597.
- 11.
Araki M, Yonetsu T, Kurihara O, Nakajima A, Lee H, Soeda T, et al. Predictors of rapid plaque progression: An optical coherence tomography study. JACC Cardiovasc Imaging 2021; 8: 1628–1638.
- 12.
Russo M, Kim HO, Kurihara O, Araki M, Shinohara H, Thondapu V, et al. Characteristics of non-culprit plaques in acute coronary syndrome patients with layered culprit plaque. Eur Heart J Cardiovasc Imaging 2020; 12: 1421–1430.
- 13.
Usui E, Mintz GS, Lee T, Matsumura M, Zhang Y, Hada M, et al. Prognostic impact of healed coronary plaque in non-culprit lesions assessed by optical coherence tomography. Atherosclerosis 2020; 309: 1–7.
- 14.
Yin Y, Fang C, Jiang S, Wang J, Wang Y, Guo J, et al. Culprit and non-culprit plaque characteristics with vs. without a healed phenotype in patients with acute myocardial infarction caused by plaque erosion: A 3-vessel OCT study. Circ J 2022; 5: 846–854.
- 15.
Kurihara O, Shinohara H, Kim HO, Russo M, Araki M, Nakajima A, et al. Comparison of post-stent optical coherence tomography findings: Layered versus non-layered culprit lesions. Catheter Cardiovasc Interv 2021; 7: 1320–1328.
- 16.
Kurihara O, Russo M, Kim HO, Araki M, Shinohara H, Lee H, et al. Clinical significance of healed plaque detected by optical coherence tomography: A 2-year follow-up study. J Thromb Thrombolysis 2020; 4: 895–902.
- 17.
Yabushita H, Bouma BE, Houser SL, Aretz HT, Jang IK, Schlendorf KH, et al. Characterization of human atherosclerosis by optical coherence tomography. Circulation 2002; 106: 1640–1645.
- 18.
Jia H, Abtahian F, Aguirre AD, Lee S, Chia S, Lowe H, et al. In vivo diagnosis of plaque erosion and calcified nodule in patients with acute coronary syndrome by intravascular optical coherence tomography. J Am Coll Cardiol 2013; 19: 1748–1758.
- 19.
TIMI Study Group. The Thrombolysis in Myocardial Infarction (TIMI) trial: Phase I findings. N Engl J Med 1985; 312: 932–936.
- 20.
Gibson CM, Cannon CP, Daley WL, Dodge JT, Alexander B, Marble SJ, et al. TIMI frame count: A quantitative method of assessing coronary artery flow. Circulation 1996; 93: 879–888.
- 21.
Lee T, Yonetsu T, Koura K, Hishikari K, Murai T, Iwai T, et al. Impact of coronary plaque morphology assessed by optical coherence tomography on cardiac troponin elevation in patients with elective stent implantation. Circ Cardiovasc Interv 2011; 4: 378–386.
- 22.
Tearney GJ, Regar E, Akasaka T, Adriaenssens T, Barlis P, Bezerra HG, et al, International Working Group for Intravascular Optical Coherence Tomography (IWG-IVOCT). Consensus standards for acquisition, measurement, and reporting of intravascular optical coherence tomography studies: A report from the International Working Group for Intravascular Optical Coherence Tomography Standardization and Validation. J Am Coll Cardiol 2012; 12: 1058–1072.
- 23.
Kume T, Akasaka T, Kawamoto T, Ogasawara Y, Watanabe N, Toyota E, et al. Assessment of coronary arterial thrombus by optical coherence tomography. Am J Cardiol 2006; 97: 1713–1717.
- 24.
Uemura S, Ishigami K, Soeda T, Okayama S, Sung JH, Nakagawa H, et al. Thin-cap fibroatheroma and microchannel findings in optical coherence tomography correlate with subsequent progression of coronary atheromatous plaques. Eur Heart J 2012; 33: 78–85.
- 25.
Nakamura S, Inami S, Murai K, Takano M, Takano H, Asai K, et al. Relationship between cholesterol crystals and culprit lesion characteristics in patients with stable coronary artery disease: An optical coherence tomography study. Clin Res Cardiol 2014; 103: 1015–1021.
- 26.
Kume T, Okura H, Kawamoto T, Yamada R, Miyamoto Y, Hayashida A, et al. Assessment of the coronary calcification by optical coherence tomography. EuroIntervention 2011; 6: 768–772.
- 27.
Soeda T, Uemura S, Park SJ, Jang Y, Lee S, Cho JM, et al. Incidence and clinical significance of poststent optical coherence tomography findings: One-year follow-up study from a Multicenter Registry. Circulation 2015; 32: 1020–1029.
- 28.
Thygesen K, Alpert JS, Jaffe AS, Chaitman B, Bax J, Morrow D, et al. Fourth universal definition of myocardial infarction (2018). Eur Heart J 2019; 40: 237–269.
- 29.
Kalsch H, Lehmann N, Mohlenkamp S, Neumann T, Slomiany U, Schmermund A, et al. Association of coronary artery calcium and congestive heart failure in the general population: Results of the Heinz Nixdorf Recall study. Clin Res Cardiol 2010; 99: 175–182.
- 30.
Cao XF, Yan LQ, Han LX, Li DM, Zhao RC, Zheng Y, et al. Association of mild to moderate kidney dysfunction with coronary artery calcification in patients with suspected coronary artery disease. Cardiology 2011; 120: 211–216.
- 31.
Kimura S, Cho S, Misu Y, Ohmori M, Tateishi R, Kaneda T, et al. Optical coherence tomography and coronary angioscopy assessment of healed coronary plaque components. Int J Cardiovasc Imaging 2021; 10: 2849–2859.
- 32.
Domingueti, CP, Dusse LM, Carvalho M, Sousa L, Gomes KB, Fernandes AP. Diabetes mellitus: The linkage between oxidative stress, inflammation, hypercoagulability and vascular complications. J Diabetes Complications 2016; 30: 738–745.
- 33.
Yahagi K, Kolodgie FD, Lutter C, Mori H, Romero ME, Finn AV, et al. Pathology of human coronary and carotid artery atherosclerosis and vascular calcification in diabetes mellitus. Arterioscler Thromb Vasc Biol 2017; 37: 191–204.
- 34.
Formentini FS, Zaina Nagano FE, Lopes Neto FDN, Adam EL, Fortes FS, Silva LFD. Coronary artery disease and body mass index: What is the relationship? Clin Nutr ESPEN 2019; 34: 87–93.
- 35.
Von Birgelen C. Klinkhart W, Mintz GS, Papatheodorou A, Herrmann J, Baumgart D, et al. Plaque distribution and vascular remodeling of ruptured and nonruptured coronary plaques in the same vessel: An intravascular ultrasound study in vivo. J Am Coll Cardiol 2001; 37: 1864–1870.
- 36.
Sanuki Y, Sonoda S, Muraoka Y, Shimizu A, Kitagawa M, Takami H, et al. Contribution of poststent irregular protrusion to subsequent in-stent neoatherosclerosis after the second-generation drug-eluting stent implantation. Int Heart J 2018; 2: 307–314.
- 37.
Elgendy IY, Gad MM, Elgendy AY, Mahmoud A, Mahmoud AN, Cuesta J, et al. Clinical and angiographic outcomes with drug-coated balloons for de novo coronary lesions: A meta-analysis of randomized clinical trials. J Am Heart Assoc 2020; 10: e016224.