Abstract
Background: Left heart abnormalities are risk factors for heart failure. However, echocardiography is not always available. Electrocardiograms (ECGs), which are now available from wearable devices, have the potential to detect these abnormalities. Nevertheless, whether a model can detect left heart abnormalities from single Lead I ECG data remains unclear.
Methods and Results: We developed Lead I ECG models to detect low ejection fraction (EF), wall motion abnormality, left ventricular hypertrophy (LVH), left ventricular dilatation, and left atrial dilatation. We used a dataset comprising 229,439 paired sets of ECG and echocardiography data from 8 facilities, and validated the model using external verification with data from 2 facilities. The area under the receiver operating characteristic curves of our model was 0.913 for low EF, 0.832 for wall motion abnormality, 0.797 for LVH, 0.838 for left ventricular dilatation, and 0.802 for left atrial dilatation. In interpretation tests with 12 cardiologists, the accuracy of the model was 78.3% for low EF and 68.3% for LVH. Compared with cardiologists who read the 12-lead ECGs, the model’s performance was superior for LVH and similar for low EF.
Conclusions: From a multicenter study dataset, we developed models to predict left heart abnormalities using Lead I on the ECG. The Lead I ECG models show superior or equivalent performance to cardiologists using 12-lead ECGs.
Worldwide, an increasing number of people are developing heart failure with the aging of the population.1 Once heart failure develops, it is often irreversible and requires semipermanent medical treatment.2 Abnormalities of the left heart, including low left ventricular ejection fraction (EF), wall motion abnormality (WMA), left ventricular hypertrophy (LVH), left ventricular dilatation (LVD), and left atrial dilatation (LAD), are risk factors for heart failure.3–8 In addition, left heart abnormalities have been linked to other serious conditions. For example, WMA is associated with myocardial infarction (MI) and severe coronary stenosis, potentially preceding fatal events. WMA alone is known to be an independent risk factor for heart failure.4 Considering the irreversibility of MI and acute heart failure, early detection is paramount for potential prevention and treatment. LVH alone is known to be a risk factor for heart failure and fatal arrhythmias.5 Significant associations of LVH with an increased risk of MI, stroke, and all-cause mortality have also been reported.9 LVH is also strongly associated with hypertension, with a reported occurrence of 36–41% on echocardiography among hypertensive patients.10 Accurate monitoring is difficult because blood pressure is constantly fluctuating. By identifying LVH, it may be possible to uncover patients with hypertension who have been overlooked. From this evidence, it is clear that early detection of LVH is useful for the detection of and intervention in various diseases. LVD is a compensatory change in heart failure. Dilated cardiomyopathy (DCM), which is incurable and is associated with a risk of sudden death, also presents with LVD. Early detection of LVD allows early intervention, regardless of the underlying disease. It has been reported that the earlier the therapeutic intervention in heart failure, the better.11 LAD alone is known to be a risk factor for heart failure,7 and it is also a risk factor for atrial fibrillation (AF) and cerebral infarction. High-precision AF detection from left atrial enlargement has been reported.12 Stroke risk has also been shown to increase with left atrial size.13 Early detection of LAD could prevent the onset of heart failure. Furthermore, the risk of AF should be assessed and, if appropriate, anticoagulation therapy should be initiated to prevent stroke. Early detection of left heart abnormalities is therefore very useful.
Abnormalities of the left heart are detectable with echocardiography. However, echocardiography is not readily available in many institutions. Recently, several deep learning models have been published to predict left heart function from a 12-lead electrocardiogram (ECG).14 These models have a high accuracy and are expected to be clinically useful.15–18 Early prediction of left heart abnormalities with a simple ECG could lead to early echocardiography screening and therapeutic intervention.
Many artificial intelligence studies have been performed based on the concept of using wearable ECG for efficient screening. Wearable ECG is said to be similar to Lead I on a 12-lead ECG.19,20 Therefore, with an eye towards application to wearable ECG, we conducted a study using Lead I from a 12-lead ECG. Several wearable ECG models for detecting arrhythmias have been reported.18 In addition, a model that detects low EF from wearable ECG with high accuracy was recently developed.19 However, whether models can be created to detect left heart abnormalities other than low EF using Lead I on an ECG remains unclear. Thus, the aim of the present study was to create a useful model to detect low EF, WMA, LVH, LVD, and LAD using Lead I from a 12-lead ECG. Interpretation tests were also performed with cardiologists to determine the clinical utility of the model.
Methods
Ethics Statement
This study was conducted in accordance with the revised Declaration of Helsinki and was approved by the Institutional Review Board of The University of Tokyo Hospital (2021132NI-(1)). Participating facilities were collectively reviewed by the screening committee of The University of Tokyo Hospital. Informed consent was obtained from patients in the form of an opt-out on websites.
Data Source and Study Population
This study used data from patients aged ≥18 years who underwent echocardiography between January 2015 to May 2021 at 8 academic medical institutions (The University of Tokyo Hospital [UTokyo]; Asahi General Hospital [Asahi]; Sakakibara Heart Institute [Sakakibara]; Jichi Medical University Saitama Medical Center [Jichi]; Tokyo Bay Urayasu Ichikawa Medical Center [TokyoBay]; Mitsui Memorial Hospital [Mitsui]; JR Tokyo General Hospital [JR]; and NTT Medical Center Tokyo [NTT]). Patients had an ECG performed within 28 days of their echocardiography. The echocardiography and matched 12-lead ECG were paired (1-to-1). When one echocardiography matched multiple ECGs, we selected the closest ECG. Various cardiac parameters were obtained and evaluated from echocardiography. Unfortunately, we could not obtain information on the diagnostic history of cardiac disease and the presence or absence of symptoms in each patient. Detailed patient background is provided in Table 1. The data for each patient are summarized in Supplementary Table 1.
Table 1.
Patient Characteristics
| |
Facility |
| UTokyo |
Mitsui |
Asahi |
Sakakibara |
Jichi |
TokyoBay |
JR |
NTT |
| No. studies |
38,245 |
48,190 |
44,069 |
35,252 |
24,222 |
22,044 |
13,280 |
4,137 |
| No. patients |
23,358 |
23,682 |
23,940 |
19,442 |
15,829 |
13,607 |
8,116 |
3,611 |
| Age (years) |
63.3±17.0 |
69.9±13.9 |
70.1±13.4 |
68.2±16.2 |
69.0±13.7 |
69.4±15.0 |
67.1±15.5 |
N/A |
| Age groups |
| ≤60 years |
14,177 (37.1) |
11,119 (23.1) |
8,658 (19.6) |
9,239 (26.2) |
5,336 (22.0) |
5,481 (24.9) |
3,977 (29.9) |
N/A |
| 61–70 years |
8,265 (21.6) |
10.841 (22.5) |
11,652 (26.4) |
7,259 (20.6) |
5,680 (23.4) |
4,469 (20.3) |
3,161 (23.8) |
N/A |
| 71–80 years |
10,440 (27.3) |
14,678 (30.5) |
13,857 (31.4) |
10,302 (29.2) |
8,804 (36.3) |
6,575 (29.8) |
3,394 (25.6) |
N/A |
| ≥81 years |
5,363 (14.0) |
11,552 (24.0) |
9,902 (22.5) |
8,452 (24.0) |
4,402 (18.2) |
5,519 (25.0) |
2,748 (20.7) |
N/A |
| Sex |
|
n=48,186 |
|
|
|
|
|
|
| Female |
16,710 (43.7) |
17,863 (37.1) |
17,417 (39.5) |
15,123 (42.9) |
9,133 (37.7) |
9,411 (42.7) |
4,803 (36.2) |
1,511 (36.5) |
| Male |
21,535 (56.3) |
30,323 (62.9) |
26,652 (60.5) |
20,129 (57.1) |
15,089 (62.3) |
12,633 (57.3) |
8,477 (63.8) |
2,626 (63.5) |
| Body height (cm) |
161.9±16.8 (n=37,379) |
161.7±14.0 (n=46,771) |
159.7±16.2 (n=33,537) |
161.0±10.2 (n=34,891) |
161.1±9.7 (n=21,021) |
N/A |
162.3±10.1 (n=13,044) |
N/A |
| Body weight (kg) |
60.4±14.3 (n=37,384) |
61.1±14.8 (n=46,909) |
60.7±14.3 (n=34,500) |
60.1±13.4 (n=34,893) |
60.6±13.4 (n=21,760) |
N/A |
62.1±14.6 (n=13,041) |
N/A |
| Mean EF (%) |
61.6±14.2 (n=37,246) |
61.1±13.2 (n=47,353) |
59.7±13.5 (n=41,394) |
56.8±10.5 (n=34,841) |
59.3±14.3 (n=24,205) |
55.3±11.8 (n=21,676) |
65.1±12.0 (n=12,759) |
64.0±11.6 (n=4,124) |
| Low EF |
3,114 (8.3) |
4,187 (8.8) |
3,903 (9.4) |
3,181 (9.1) |
2,947 (12.2) |
2,724 (12.6) |
595 (4.7) |
199 (4.8) |
| WMSI |
1.15±0.38 (n=37,197) |
N/A |
N/A |
N/A |
N/A |
1.25±0.43 (n=22,037) |
N/A |
N/A |
| WMA |
6,931 (18.6) |
13,920 (29.3) |
N/A |
N/A |
N/A |
7,177 (32.6) |
N/A |
982 (23.8) |
| LA diameter (mm) |
37.9±19.0 (n=36,923) |
39.4±8.7 (n=45,903) |
42.5±15.9 (n=42,411) |
39.8±8.6 (n=34,179) |
43.6±8.9 (n=24,201) |
37.6±7.6 (n=21,720) |
38.3±7.7 (n=12,984) |
39.6±7.9 (n=4,128) |
| LAVI (mL/m2) |
35.6±23.0 (n=34,101) |
39.2±28.0 (n=18,269) |
30.6±10.8 (n=21,635) |
47.3±34.8 (n=33.928) |
N/A |
45.0±26.1 (n=12,257) |
N/A |
35.3±22.0 (n=4,054) |
| LAD |
13,409 (39.3) |
8,345 (45.7) |
5,788 (26.8) |
21,547 (63.5) |
N/A |
7,573 (61.8) |
N/A |
1,642 (40.5) |
| IVST (mm) |
9.1±3.1 (n=37,466) |
10.0±2.2 (n=45,901) |
10.5±2.3 (n=39,430) |
10.6±2.0 (n=34,731) |
10.3±1.9 (n=24,206) |
10.7±1.9 (n=21,826) |
9.5±1.5 (n=12,492) |
9.7±1.9 (n=4,126) |
| LVPWT (mm) |
8.9±2.6 (n=37,458) |
9.8±6.3 (n=45,896) |
10.3±1.9 (n=39,419) |
10.1±1.4 (n=34,731) |
10.2±1.7 (n=24,206) |
10.5±1.7 (n=21,827) |
9.2±1.2 (n=12,490) |
9.7±1.6 (n=4,130) |
| LVDd (mm) |
46.3±7.9 (n=37,494) |
45.8±7.3 (n=45,920) |
47.8±7.9 (n=40,698) |
46.4±7.8 (n=34,740) |
49.5±8.6 (n=24,206) |
43.7±7.6 (n=21,830) |
47.0±6.2 (n=12,546) |
45.2±6.8 (n=4,126) |
| LVDs (mm) |
31.1±11.3 (n=37,446) |
30.5±8.4 (n=45,918) |
32.2±8.7 (n=40,398) |
32.4±8.3 (n=34,739) |
33.4±9.8 (n=24,205) |
29.8±8.5 (n=21,821) |
29.9±7.2 (n=12,540) |
29.5±7.4 (n=4,131) |
| LVD |
3,186 (8.5) |
3,452 (7.5) |
4,996 (12.3) |
3,363 (9.7) |
4,355 (18.0) |
1,223 (5.6) |
780 (6.2) |
215 (5.2) |
| LVMI (g/m2) |
89.4±31.3 (n=37,154) |
98.9±34.8 (n=44,633) |
120.5±38.8 (n=29,676) |
106.4±31.4 (n=34,621) |
114.5±37.3 (n=20,753) |
104.2±33.2 (n=14,797) |
94.7±28.5 (n=12,439) |
N/A |
| LVH |
8,219 (22.1) |
14,523 (32.5) |
17,225 (58.0) |
14,933 (43.1) |
10,556 (50.9) |
5,909 (39.9) |
3,038 (24.4) |
N/A |
| Manufacturer |
Fukuda Denshi |
Fukuda Denshi |
Nihon Kohden |
Nihon Kohden |
Nihon Kohden |
Nihon Kohden |
Nihon Kohden |
Nihon Kohden |
| ECG findings |
| HR (beats/min) |
74.0±14.9 |
74.2±17.8 |
72.2±15.6 |
71.2±15.5 |
73.6±16.5 |
76.3±19.5 |
N/A |
74.7±17.0 |
| P-R |
170.9±42.9 |
173.7±49.4 |
173.5±32.2 |
179.1±35.9 |
174.5±32.9 |
174.5±33.3 |
N/A |
176.3±33.0 |
| QRS |
105.5±22.3 |
108.7±22.4 |
101.1±22.4 |
104.7±26.2 |
101.0±22.7 |
100.0±21.9 |
N/A |
98.5±19.9 |
| Wide QRS |
6,272 (16.4) |
9,480 (19.7) |
7,163 (16.3) |
7,696 (21.8) |
4,038 (16.7) |
3,454 (15.7) |
N/A |
603 (14.6) |
| QT |
395.5±38.8 |
401.8±45.0 |
406.3±41.5 |
412.8±44.7 |
403.5±45.4 |
403.1±45.5 |
N/A |
400.2±42.6 |
| QTc |
433.6±33.3 |
439.1±35.4 |
425.9±30.8 |
430.7±34.0 |
425.1±34.0 |
427.7±32.5 |
N/A |
423.4±30.4 |
| RV5 |
1.55±0.80 |
1.51±0.80 |
1.86±0.95 |
1.77±0.96 |
1.83±0.94 |
1.73±0.92 |
N/A |
1.73±0.83 |
| SV1 |
0.85±0.63 |
0.70±0.61 |
0.97±0.63 |
0.97±0.68 |
0.99±0.65 |
0.97±0.63 |
N/A |
0.91±0.57 |
| RV5+SV1 |
2.40±1.09 |
2.21±1.07 |
2.83±1.22 |
2.75±1.29 |
2.82±1.25 |
2.70±1.22 |
N/A |
2.64±1.09 |
Data are expressed as the mean±SD or n (%). There are several labels for which data could either not be collected or the amount of data was considerably reduced at some facilities. Asahi, Asahi General Hospital; ECG, electrocardiogram; EF, ejection fraction; HR, heart rate; IVST, interventricular septum thickness; Jichi, Jichi Medical University Saitama Medical Center; JR, JR Tokyo General Hospital; LA, left atrium; LAD, left atrial dilatation; LAVI, left atrial volume index; LVD, left ventricular dilatation; LVDd, left ventricular end-diastolic diameter; LVDs, left ventricular end-systolic diameter; LVH, left ventricular hypertrophy; LVMI, left ventricular mass index; LVPWT, left ventricular posterior wall thickness; Mitsui, Mitsui Memorial Hospital; NTT, NTT Medical Center Tokyo; Sakakibara, Sakakibara Heart Institute; TokyoBay, Tokyo Bay Urayasu Ichikawa Medical Center; UTokyo, The University of Tokyo Hospital; WMA, wall motion abnormality; WMSI, wall motion score index.
Definition of Case and Data Acquisition
All echocardiography was performed by a trained sonographer or cardiologist. The findings were interpreted by 1 or 2 experienced cardiologists. Linear measurements of cardiac chambers were performed in accordance with the current American Society of Echocardiography guidelines.21 Left ventricular (LV) mass (g) was calculated using the following formula:
LV mass = 0.8 × {1.04 × ([IVST + LVEDD + PWT]3 − [LVEDD]3)} + 0.6
where IVST is interventricular septum thickness, LVEDD is LV end-diastolic diameter, and PWT is posterior wall thickness.21 LV mass was indexed for body surface area. LVEF was evaluated by Simpson’s biplane method. For low EF, the definition of heart failure with reduced EF is defined in the American, European, and Japanese guidelines. With reference to previous studies, we defined low EF as a LVEF <40%.19,22 Other morphologic features were defined based on the proposal of the American Society of Echocardiography.21 WMA was defined as a wall motion score >1; LVH was defined as an LV mass index >115 g/m2
for men and >95 g/m2
for women; LVD was defined as a LVEDD >58 mm for men and >52 mm for women; and LAD was defined as a left atrial volume index >34 mL/m2.
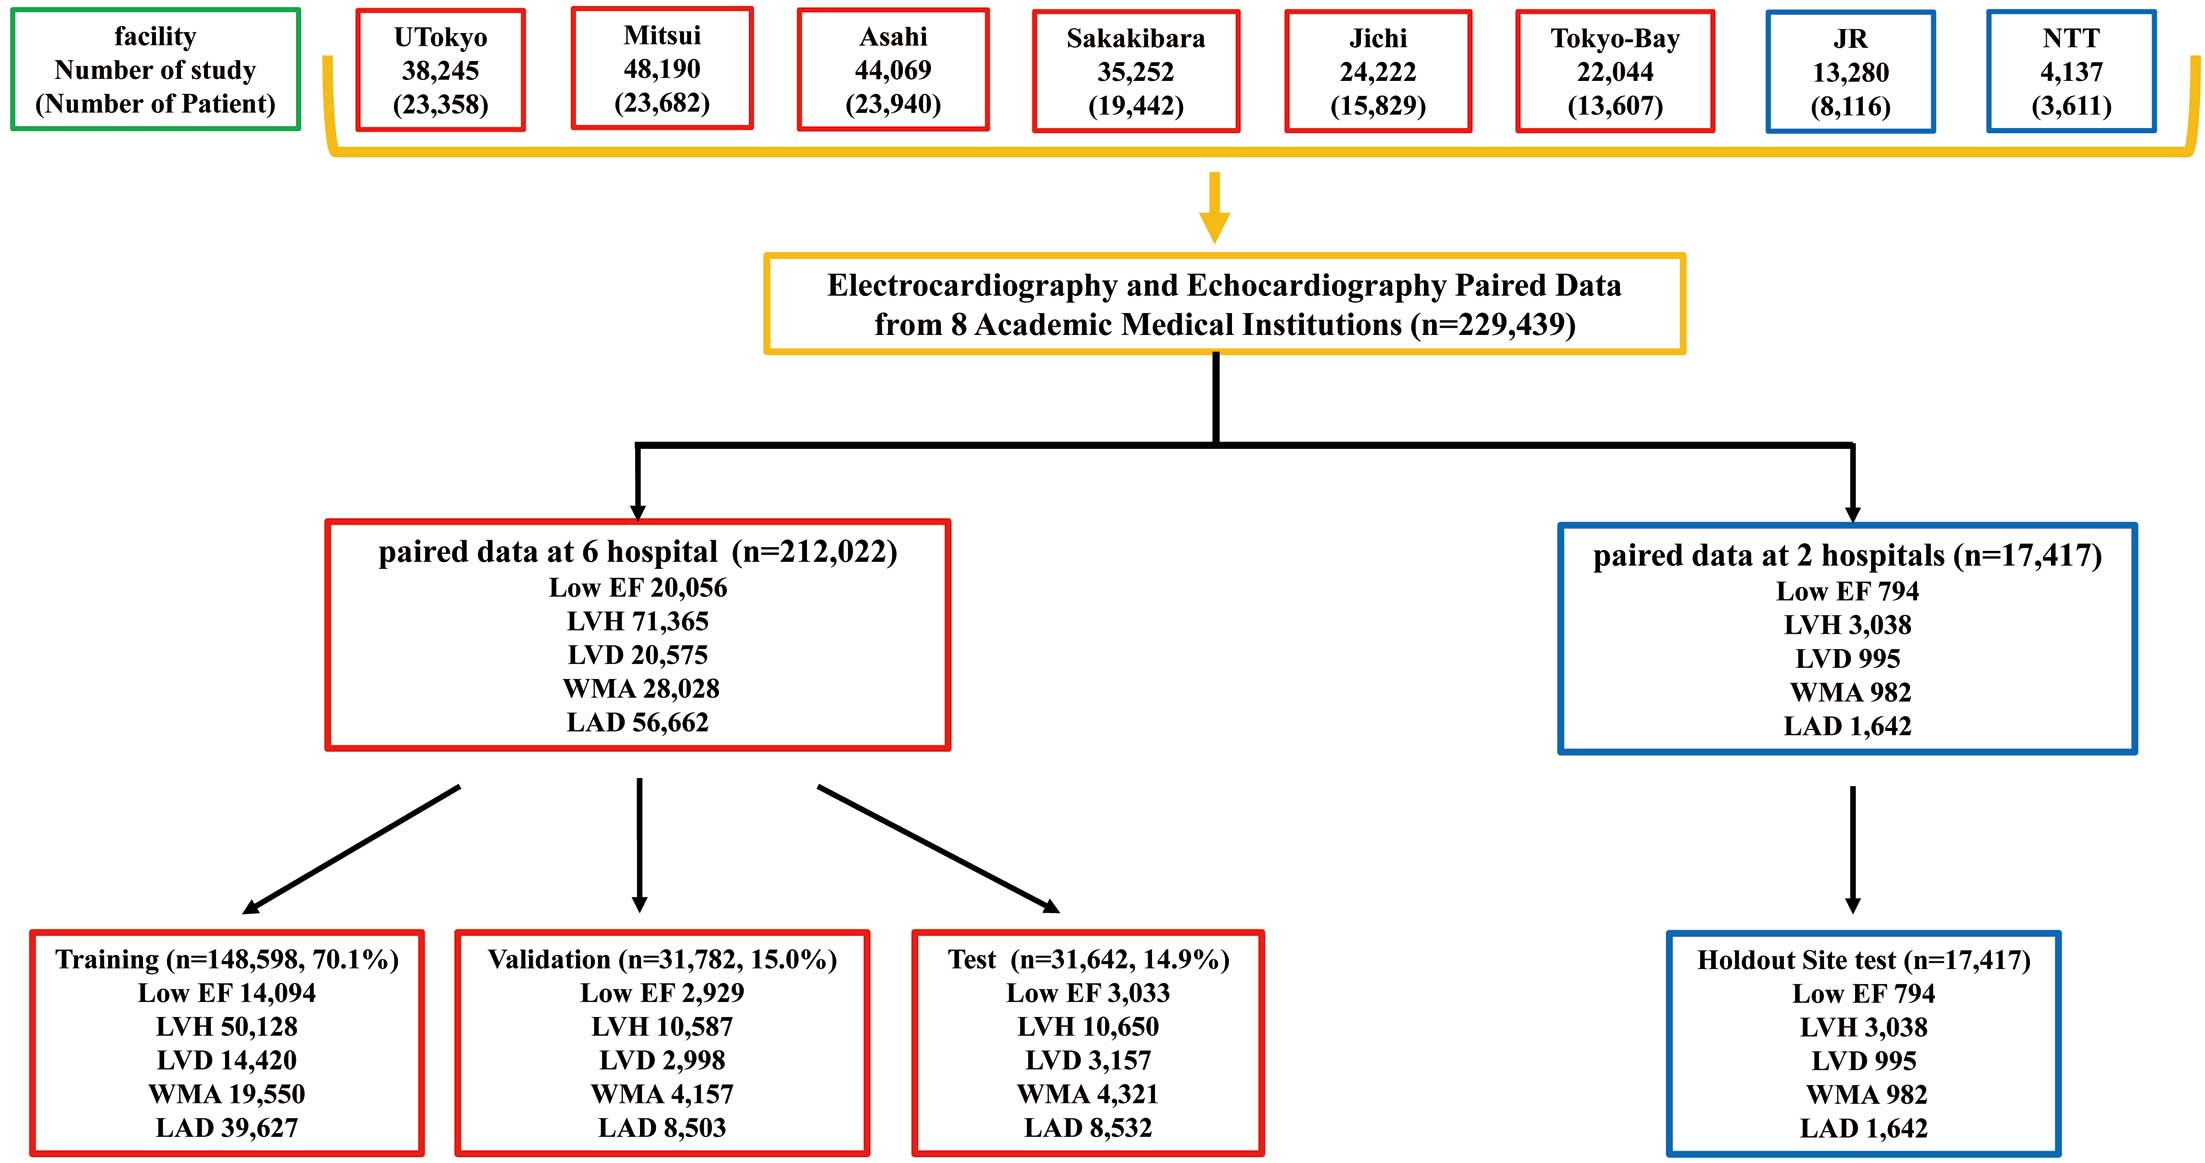
Data Adjustment, Allocation, and External Verification
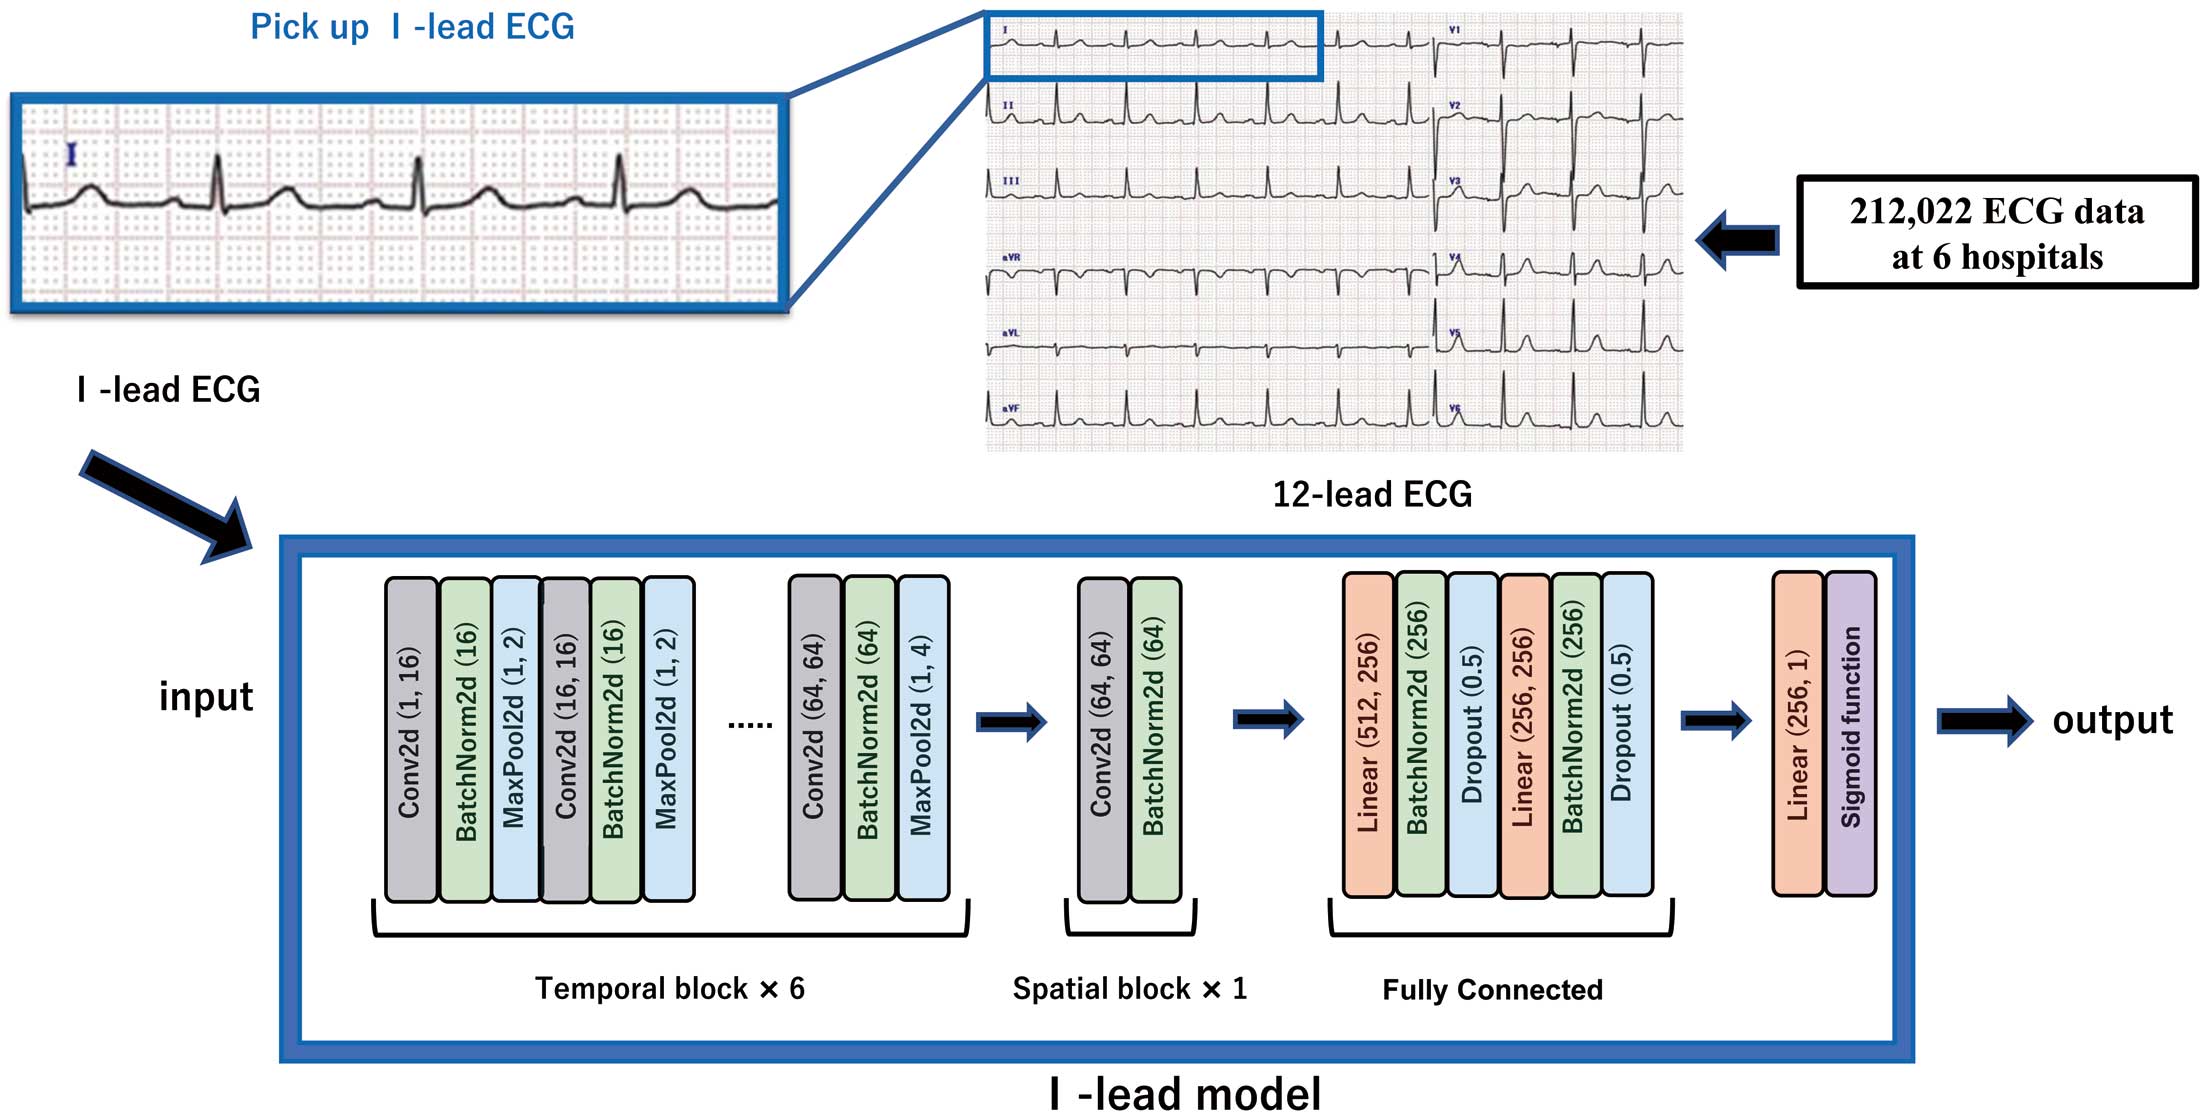
The data assignment is shown in Figure 1. In all, 212,022 datasets were used from 6 facilities (UTokyo, Asahi, Sakakibara, Jichi, TokyoBay, and Mitsui). The samples were assigned to train, validate, and test in the ratio of 7 : 1.5 : 1.5, respectively, by random numbers. Patients with multiple pairs of ECG-echocardiography were included in the same dataset. To evaluate the generalizability of the ECG model, external verification was performed using data from 17,417 patients from 2 facilities (NTT and JR). The performance of the model was primarily calculated at the sample level, and was checked at the patient level. For the analysis at the patient level, the oldest data were used if multiple data existed for 1 patient. The ECG data for UTokyo and Mitsui Memorial Hospital were obtained using equipment from Fukuda Denshi (Tokyo, Japan), whereas the data for other facilities were obtained using equipment from Nihon Kohden (Tokyo, Japan). Because different facilities use ECG equipment manufactured by different companies, we also performed validation by adjusting the manufacturer. Both companies’ data formats were standardized with a 500-Hz sampling rate and 10-s intervals. Our dataset encompasses various samples, including patients with pacemakers and arrhythmias like AF and ventricular extrasystole. We used the original ECG waveforms for these arrhythmias without alterations. Unfortunately, the dataset lacks information on the percentage of patients with arrhythmias. The Lead I trace was extracted from a 12-lead ECG (Figure 2). The Lead I trace is reported to be equivalent to a wearable ECG.23
Model Development
A convolutional neural network model was used as the machine learning model. We developed our model with reference to a previous study.24 A summary of the model is shown in Figure 2. This model is based on the 12-lead model and uses these data efficiently. We did not create a model specifically for Lead I because it would be convenient to be able to use almost the same model for both 12-lead and Lead I ECGs. The Lead I trace was extracted from the 12-lead ECG and substituted into the model. A 6-layer convolutional block (termed a temporal block) was followed by a spatial convolutional block. The output was then obtained through fully connected layers. For the obtained outputs, the optimal cut-off values were set using the Youden index.25 The cut-off value was defined as the point furthest away from the straight line (area under the receiver operating characteristic curve [AUROC]=0.5), which is the receiver operating characteristic (ROC) curve with the lowest classification accuracy. Therefore, ROC curves were first drawn from the output of the model for the internal test set and the correct answer label. Then, for each ROC curve for each label, the optimal cut-off was calculated using the Youden index. The model was trained and validated as shown Figure 1. We validated with multiple cut-off values. Cut-off 1 was calculated from the Youden index; and Cut-off 2 and Cut-off 3 were calculated with the sensitivity and specificity set to 90%, respectively. We used gradient-weighted class activation mapping (Grad-CAM) for models.26 In addition, 12-lead ECG models were created for performance comparison. These models were developed using Python version 3.10, PyTorch deep learning library, and Nvidia Tesla V-100 32 GB graphics processing unit.
Interpretation Tests
To evaluate clinical utility, interpretation tests were compared between cardiologists and the deep learning models. Twelve cardiologists performed interpretation tests on low EF and LVH. Each test question required the cardiologist or the model to assess 1 ECG and choose an answer from 2 options: low EF or not low EF. Two types of ECGs, lead 1 and lead 12, were prepared from the same samples. The model and cardiologists were asked to solve a total of 120 2-choice ECGs, including Lead I ECGs (30 normal, 30 low EF) and 12-lead ECGs (30 normal, 30 low EF). Models and specialists first solved 60 Lead I questions and then 60 12-lead questions. We randomly selected ECGs from low EF and not low EF cases. The same method was used to test LVH. Samples with both low EF and LVH, were not included in the test questions. The accuracy evaluation was verified by the accuracy in the cardiologists and deep learning models.
Statistical Analysis
Continuous variables are expressed as the mean±SD and were compared using a 2-tailed variance analysis. Categorical variables are presented as frequencies and percentages and were compared using the Chi-squared test. The 95% confidence intervals (95% CI) of the accuracy, sensitivity, specificity, positive predictive value, and negative predictive value were assessed by bootstrapping (10,000 resamplings with replacement).27 For AUROC assessment, tests with an AUROC >0.9 were interpreted as highly accurate, those with an AUROC of 0.7–0.9 as moderately accurate, those with an AUROC of 0.5–0.7 as low accuracy, and those with an AUROC of 0.5 as a chance result.28 We performed subgroup analyses by sex, age, heart rate, and QRS width. Interpretation tests performed on the model and 12 cardiologists were analyzed using the Cochran–Mantel–Haenszel test.29,30 Statistical analyses were performed using JMP Pro 16 (SAS Institute, Tokyo, Japan). Statistical significance was defined as P<0.05.
Results
Patient Characteristics
This study included 229,439 ECG-echocardiography pairs from 131,585 patients. Table 1 provides the background of the patients for each facility. The mean age of the patients at each facility ranged from 63.3 to 70.1 years. By sex, 137,464 (59.9%) were male and 91,971 (40.1%) were female. Other detailed echocardiographic findings and ECG information are presented in Table 1. There are several labels for which data could either not be collected or the amount of data was considerably reduced at some facilities. In particular, several facilities had deficient wall motion score index, left atrial volume index, and LV mass index data. Missing labels are indicated as not applicable in Table 1. Patient characteristics of each dataset for training, validation, and testing are summarized in Supplementary Table 2.
Diagnostic Performance
The AUROC for left heart morphology parameters for each of the 1- and 12-lead models are shown in Figure 3. The AUROC in the Lead I model was 0.913 (95% CI 0.907–0.917) for low EF, 0.832 (95% CI 0.825–0.839) for WMA, 0.797 (95% CI 0.792–0.802) for LVH, 0.838 (95% CI 0.830–0.845) for LVD, and 0.802 (95% CI 0.795–0.808) for LAD. The respective accuracy of the Lead I ECG models was 81.6% (95% CI 81.1–82.0%) for low EF, 74.5% (95% CI 73.8–75.2%) for WMA, 71.6% (95% CI 71.1–72.2%) for LVH, 75.6% (95% CI 75.1–76.1%) for LVD, and 72.9% (95% CI 72.3–73.6%) for LAD. The sensitivity, specificity, positive predictive value, and negative predictive value data are presented in Table 2. The results of external validation using data from the 2 facilities are also presented. The performance was maintained in the external verification. The results for each facility are presented in Supplementary Table 3. The results of validation with another dataset differentiated by manufacture are presented in Supplementary Table 4. Supplementary Table 5 presents results for each site with multiple cut-off values. The results of the 12-lead models are presented in Table 3. The 12-lead ECG model outperformed the Lead I model in all categories. The results of the subgroup analysis are presented in Supplementary Table 6.
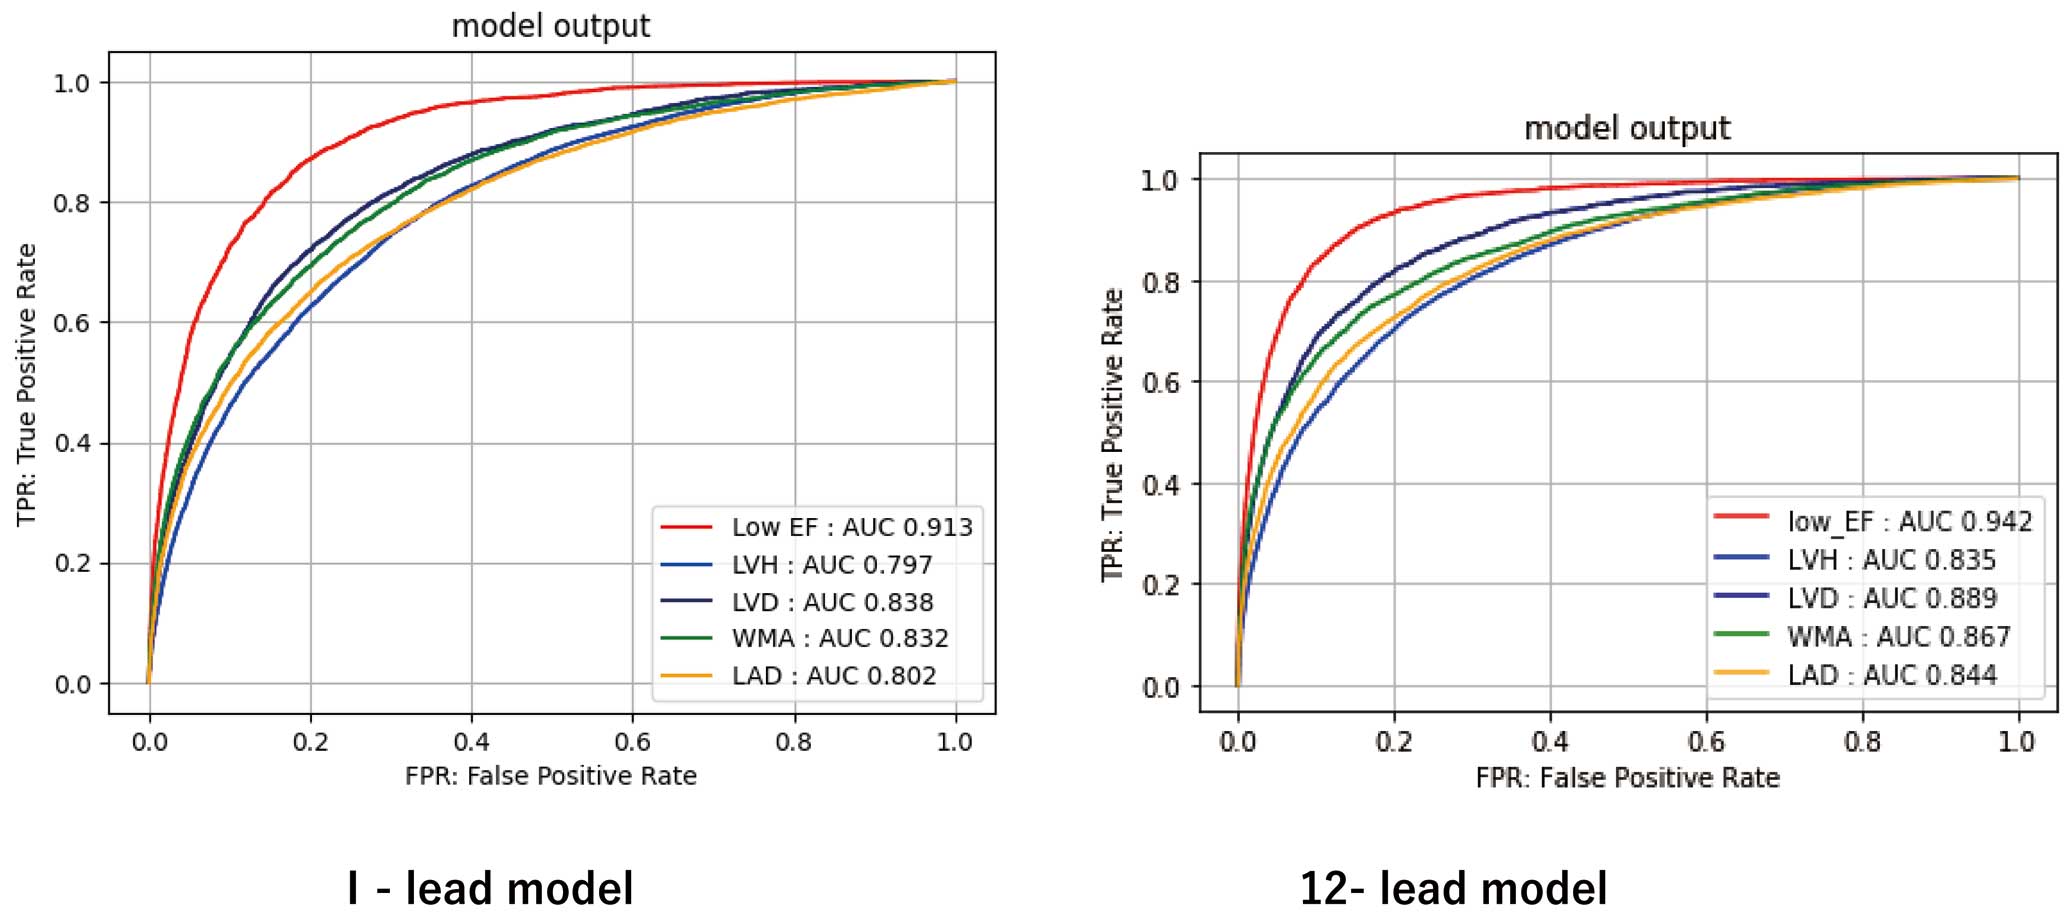
Table 2.
Performance of the Lead I Model
| |
AUROC |
Accuracy (%) |
Sensitivity (%) |
Specificity (%) |
PPV (%) |
NPV (%) |
| Internal test |
| Low EF |
0.913
(0.907–0.917) |
81.6
(81.1–82.0) |
86.2
(84.9–87.4) |
81.1
(80.6–81.5) |
33.1
(32.5–33.8) |
98.2
(98.0–98.3) |
| WMA |
0.832
(0.825–0.839) |
74.5
(73.8–75.2) |
76.3
(75.0–77.5) |
73.9
(73.0–74.7) |
52.1
(51.2–52.9) |
89.3
(88.8–89.8) |
| LVH |
0.797
(0.792–0.802) |
71.6
(71.1–72.2) |
74.9
(74.1–75.8) |
69.5
(68.8–70.2) |
61.4
(60.8–62.0) |
81.1
(80.6–81.6) |
| LVD |
0.838
(0.830–0.845) |
75.6
(75.1–76.1) |
77.1
(75.6–78.5) |
75.4
(74.9–75.9) |
26.5
(26.0–27.1) |
96.6
(96.4–96.8) |
| LAD |
0.802
(0.795–0.808) |
72.9
(72.3–73.6) |
70.6
(69.6–71.6) |
75.0
(74.2–75.9) |
71.9
(71.1–72.6) |
73.9
(73.2–74.5) |
| External test |
| Low EF |
0.939
(0.931–0.945) |
83.0
(82.4–83.6) |
91.2
(89.0–93.1) |
82.6
(82.0–83.2) |
20.5
(19.9–21.2) |
99.5
(99.4–99.6) |
| WMA |
0.786
(0.769–0.802) |
76.7
(75.4–78.0) |
63.1
(60.0–66.2) |
81.0
(79.6–82.3) |
50.9
(48.7–53.0) |
87.6
(86.6–88.5) |
| LVH |
0.809
(0.800–0.817) |
73.5
(72.7–74.2) |
74.1
(72.5–75.6) |
73.2
(72.3–74.1) |
47.2
(46.2–48.2) |
89.7
(89.2–90.3) |
| LVD |
0.877
(0.866–0.887) |
82.0
(81.4–82.6) |
76.5
(73.7–79.1) |
82.3
(81.7–82.9) |
21.6
(20.8–22.4) |
98.2
(98.0–98.4) |
| LAD |
0.812
(0.799–0.825) |
74.9
(73.5–76.2) |
66.9
(64.5–69.1) |
80.3
(78.7–81.9) |
69.8
(67.9–71.6) |
78.1
(76.8–79.3) |
| External test by patient |
| Low EF |
0.924
(0.902–0.941) |
80.9
(79.7–82.0) |
91.1
(86.2–94.4) |
80.4
(79.2–81.6) |
16.5
(14.3–18.8) |
99.5
(99.3–99.7) |
| WMA |
0.781
(0.762–0.799) |
76.8
(75.4–78.2) |
61.2
(57.7–64.5) |
81.3
(79.8–82.7) |
47.9
(44.9–51.0) |
88.1
(86.8–89.3) |
| LVH |
0.817
(0.784–0.845) |
73.3
(70.5–75.8) |
78.7
(72.9–83.6) |
71.8
(68.7–74.8) |
42.2
(37.6–47.1) |
92.8
(90.6–94.6) |
| LVD |
0.869
(0.842–0.891) |
76.2
(74.9–77.4) |
84.2
(78.7–88.5) |
75.8
(74.5–77.0) |
14.3
(12.5–16.4) |
99.0
(98.6–99.3) |
| LAD |
0.811
(0.796–0.825) |
75.6
(74.1–77.0) |
65.1
(62.5–67.5) |
82.3
(80.6–83.9) |
70.2
(67.6–72.6) |
78.6
(76.9–80.3) |
Values in parentheses are 95% confidence intervals. AUROC, area under the receiver operating characteristic curve; NPV, negative predictive value; PPV, positive predictive value. Other abbreviations as in Table 1.
Table 3.
Performance of the 12-Lead Model
| |
AUROC |
Accuracy (%) |
Sensitivity (%) |
Specificity (%) |
PPV (%) |
NPV (%) |
| Internal test |
| Low EF |
0.942
(0.938–0.946) |
85.2
(84.8–85.5) |
90.3
(89.2–91.3) |
84.6
(84.2–85.0) |
38.9
(38.2–39.7) |
98.8
(98.6–98.9) |
| WMA |
0.867
(0.861–0.873) |
80.7
(80.1–81.3) |
74.7
(73.4–76.0) |
82.9
(82.2–83.6) |
62.0
(60.9–63.0) |
89.8
(89.3–90.3) |
| LVH |
0.835
(0.830–0.840) |
75.2
(74.71–75.7) |
76.7
(75.8–77.5) |
74.3
(73.6–75.0) |
65.9
(65.2–66.5) |
83.1
(82.6–83.6) |
| LVD |
0.889
(0.883–0.895) |
79.9
(79.5–80.4) |
82.2
(80.8–83.5) |
79.7
(79.2–80.1) |
31.7
(31.1–32.3) |
97.5
(97.3–97.7) |
| LAD |
0.844
(0.838–0.850) |
76.4
(75.8–77.0) |
76.7
(75.7–77.6) |
76.2
(75.3–77.0) |
74.4
(73.7–75.1) |
78.3
(77.6–79.0) |
| External test |
| Low EF |
0.964
(0.959–0.970) |
90.0
(89.6–90.5) |
92.1
(90.0–93.9) |
89.9
(89.4–90.4) |
31.1
(30.0–32.1) |
99.6
(99.5–99.7) |
| WMA |
0.852
(0.837–0.866) |
78.5
(77.2–79.7) |
76.4
(73.6–79.0) |
79.1
(77.6–80.5) |
53.3
(51.4–55.2) |
91.5
(90.6–92.3) |
| LVH |
0.848
(0.841–0.856) |
78.1
(77.3–78.8) |
73.4
(71.8–74.9) |
79.6
(78.8–80.4) |
53.8
(52.6–54.9) |
90.2
(89.7–90.8) |
| LVD |
0.915
(0.906–0.923) |
83.8
(83.2–84.3) |
84.0
(81.6–86.2) |
83.7
(83.2–84.3) |
24.7
(23.9–25.5) |
98.8
(98.6–99.0) |
| LAD |
0.850
(0.838–0.862) |
78.3
(77.0–79.6) |
70.3
(68.1–72.5) |
83.7
(82.2–85.2) |
74.6
(72.8–76.4) |
80.6
(79.3–81.7) |
Values in parentheses are 95% confidence intervals. Abbreviations as in Tables 1,2.
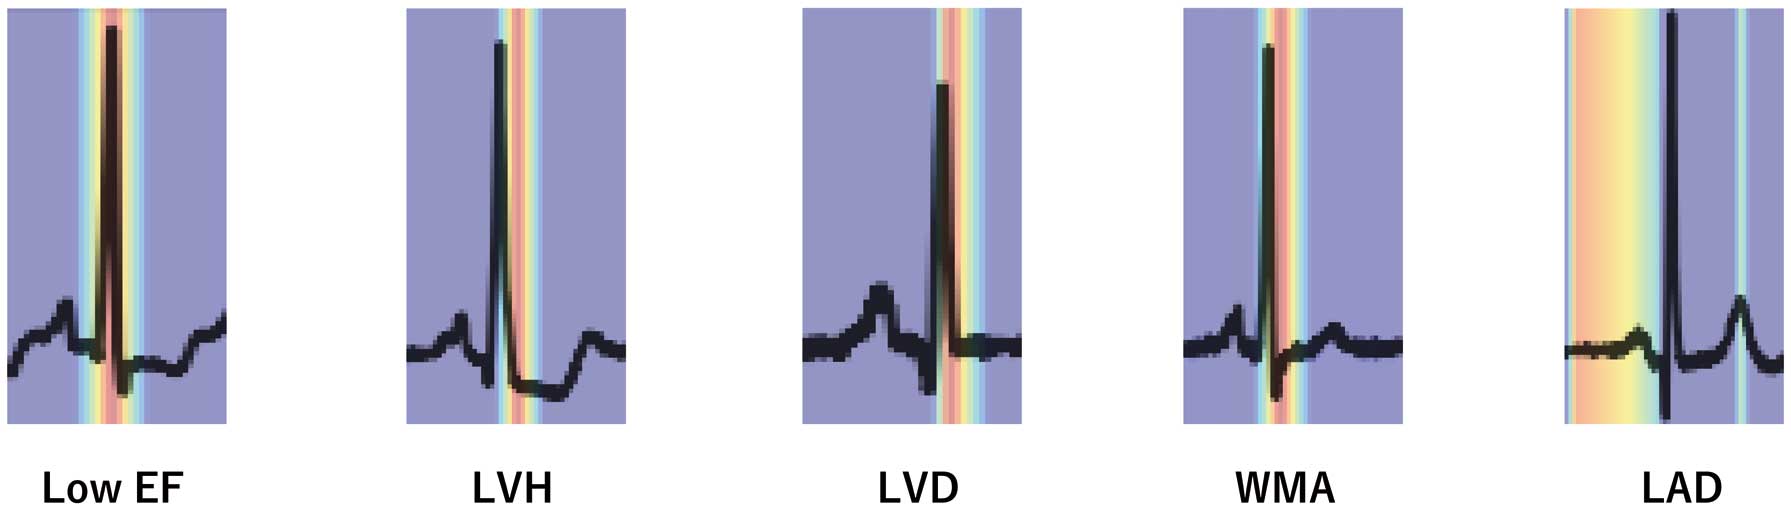
Visualizing Model Decision Making
Grad-CAM shows where the model focuses its attention in the ECG (Figure 4). The models are shown to focus on the P wave in detecting LAD and on the QRS wave in other detections.
Interpretation Test
The results of the interpretation tests are presented in Table 4. The accuracy for the Lead I model was 78.3% for low EF and 68.3% for LVH. Both were significantly superior to cardiologists who read Lead I traces from ECGs (low EF: 65.6%, P=0.0127; LVH: 55.6%, P=0.0091). Compared with cardiologists who read the 12-lead ECGs, the correct response rate for the Lead I model was significantly higher for LVH (cardiologist 56.9%; P=0.0268). However, there was no difference for low EF (cardiologist 69.1%; P=0.0572). The sensitivity and specificity are presented in Table 4. Both were either superior or non-inferior to cardiologist diagnosis.
Table 4.
Outcomes of Interpretation Tests
| |
Accuracy (%) |
Sensitivity (%) |
Specificity (%) |
| Low EF |
| Lead I model |
78.3 |
68.9 |
93.3 |
| vs. Lead I cardiologist |
65.6 (P=0.0127) |
53.7 (P=0.0379) |
78.6 (P=0.0370) |
| vs. 12-lead cardiologist |
69.1 (P=0.0572) |
60.3 (P=0.2049) |
80.0 (P=0.0572) |
| LVH |
| Lead I model |
68.3 |
40.0 |
96.7 |
| vs. Lead I cardiologist |
55.6 (P=0.0091) |
32.2 (P=0.2743) |
79.1 (P=0.0078) |
| vs. 12-lead cardiologist |
56.9 (P=0.0268) |
39.1 (P=0.9145) |
73.6 (P=0.0006) |
Abbreviations as in Table 1.
Discussion
In the present study, we developed models to predict left heart abnormalities from the Lead I trace taken from 12-lead ECGs. The accuracy for the Lead I ECG interpretation test was comparable to that of cardiologists who read 12-lead ECGs. Thus, our model is useful because it can robustly detect abnormalities of the left heart, with a performance comparable to that of cardiologists who interpret 12-lead ECGs.
The detection accuracy of our models was highest for low EF compared with other left heart abnormalities. The AUROC of the model was 0.913, comparable to 0.88 reported in a previous study.19 These findings suggest that the Lead I trace extracted from 12-lead ECGs contains features indicative of low EF. During interpretation tests, cardiologists achieved higher accuracy in the detection of low EF when using 12-lead ECGs as opposed to Lead I ECGs. Thus, chest lead information proves valuable for cardiologists interpreting low EF, aligning with clinical practice. The experts’ ECG judgment was based on the following points: low EF was judged comprehensively based on findings of poor R progression, abnormal T wave, left bundle branch block, Q wave, low voltage, S wave prolongation in leads V2–3, and QTc prolongation.31 While considering these features, the specialists made an overall determination of whether or not the patient had low EF. The final decision was left to the judgment of the specialist. The fact that the performance of the model using only Lead I traces for detecting low EF was equivalent to that of cardiologists using 12-lead ECGs provides support for the clinical utility of our model.
The LVH detection model had the lowest performance among the left heart abnormality models. Previous studies presented several LVH detection models from 12-lead ECGs, with AUROC ranging from 0.62 to 0.89.32–34 Our 12-lead model performed comparably to those studies. In contrast, our Lead I model showed a decrease in performance, demonstrating the importance of information from chest leads for the detection of LVH (Figure 3; Table 3). In the interpretation test, cardiologists referred to findings of R wave height, S wave depth, T wave changes, and strain-type ST changes. As with low EF, the final decision regarding LVH was left to the judgment of the specialist. The sensitivity was notably low; this is comparable to the low sensitivity (21%) but high specificity (95%) characteristics of the Sokolow–Lyon voltage criteria used as electrocardiographic diagnostic criteria for LVH.35 Although it may be challenging to detect LVH from an ECG alone, our Lead I model outperforms cardiologists using 12-lead ECGs and is more useful even under these conditions. Considering our LVH model’s somewhat restricted performance, insights were drawn from prior LVH model studies. A Grad-CAM analysis revealed that an artificial intelligence learning model emphasized the QRS complex in ECGs meeting the LVH voltage criterion and the QT interval in those that did not.36 Our model displayed a similar emphasis on the QRS complex but paid less attention to the QT interval. It is plausible that the model struggled to learn from LVH ECGs not meeting the voltage criterion. In the present study, only lead I was analyzed; it has been reported that a model’s performance decreased most when the V3 and aVR leads were masked, suggesting a significant impact of these 2 leads.37 In that study, the echocardiographic video was also partially masked for validation.37 The results showed that the performance of the model deteriorated when the echocardiographic video was restricted to the LV periphery.37 This means that the LVH information is influenced by non-LV information. As with echocardiography, this effect is likely to be present on the ECG as well. Due to these effects, the performance of the Lead I model of LVH may have been moderate and not high.
Previous studies have reported that WMA, LAD, and LVD can be detected in 12-lead ECGs with an AUROC of approximately 0.81.33,38 Compared with low EF and LVH, there are relatively fewer studies assessing these features because of their lower incidence on ECG recordings. However, our Lead I model demonstrated positive performance, with AUROC of 0.832, 0.802, and 0.838 for WMA, LAD, and LVD, respectively. The AUROC for some specific tests used in clinical practice have been reported; for example, the AUROC for B-type natriuretic peptide for heart failure, cytology for cervical cancer, and mammography for breast cancer were reported to be 0.6–0.7, approximately 0.7, and 0.67–0.84, respectively.39–41
Considering these reports, our model may have moderate performance to detect WMA, LAD, and LVD from ECGs. Compared with the performance of the low EF model, the performance of the other labels was not high: the AUROC exceeded 0.8, indicating that further improvement of performance is needed for clinical application.
Our model can predict abnormalities of the left heart from the Lead I trace on the ECG. We used a large dataset of 212,022 datasets collected from 6 facilities. Although previous studies have developed Lead I models, models that use multifacility data and predict abnormalities of left heart abnormalities have not been reported. In addition, no studies have conducted both external validation and interpretation tests to assess model accuracy. Precision was also maintained via external validation using data from 2 facilities. When examining the data from each facility, interfacility differences were observed. These differences may have resulted from interfacility heterogeneity in technical factors, such as signal processing approaches, when performing echocardiography and electrocardiography, even when skilled personnel perform the assesssments.36 Grad-CAM demonstrated the model’s effective focus on ECG data, signifying appropriate learning. Our findings indicate that the model was reliable. Our model will be useful for clinical detection of low EF (with an AUROC >0.9) because the accuracy was equivalent to that of cardiologists who read 12-lead ECGs. In contrast, the clinical utility of our models for detecting other left heart features is less clear, although even our LVH model (which had the lowest AUROC) outperformed cardiologists who read 12-lead ECGs. Unfortunately, the immediate clinical deployment of this model as a screening tool presents challenges. Even after validation, which was conducted on a dataset comprising patients who sought medical care at a hospital, the model’s positive and negative predictive values did not demonstrate sufficient performance when used for screening purposes. Specifically, the positive predictive value is expected to be lower, given that the primary target population comprised healthy individuals, resulting in a lower detection rate. It remains unclear whether the model can maintain similar performance in healthy subjects. Consequently, our model is not yet prepared for clinical use. Nevertheless, with further improvements in model performance and targeted subject selection, clinical application becomes a possibility. We acknowledge that this study remains preliminary.
One-lead ECGs are primarily used in wearable devices.19 Because of the absence of wearable ECG data in our study, we can only speculate that it may be possible to incorporate our model into wearable devices in the future. The model could detect left heart abnormalities from a Lead I ECG performed at home, which could urge a hospital visit. That way, the patient would first undergo 12-lead ECG at the clinic or hospital, possibly followed by additional echocardiography. This may enable early disease detection and therapeutic intervention. Although this application remains speculative at this time, our study serves as an initial exploration in this direction.
This study has several limitations. First, although the model creation and precision were good, the data were not collected from wearable ECGs. Although wearable ECGs are becoming increasingly popular, there are still limited data as compared with 12-lead ECGs. Therefore, whether our model can identify left heart abnormalities from wearable devices remains unclear. Future validation using wearable ECGs is needed. Second, this study only used retrospective data. Thus, future prospective studies are required to evaluate generalizability of the model. Third, this study includes data from patients with and without symptoms. The patients who underwent testing were those with suspected cardiac disease or those who underwent routine testing prior to surgery. Consequently, asymptomatic patients and those without active suspicion of heart disease were included. A limitation of this study is that the analysis was not based on the presence or absence of symptoms. Moreover, it is uncertain whether the model is better able to identify patients with known cardiac disease because the present data do not provide a diagnostic history of cardiac disease. Further analysis is needed to determine the presence or absence of cardiac disease when considering the application of this model to asymptomatic patients. Fourth, there was inadequate analysis of subgroups, such as patients with arrhythmias and emergency diseases. Most data came from outpatient settings with patients at rest. Only a small number of patients in our study required an emergency room visit. Specifically, patients with acute MI, cardiac arrest, or ventricular tachycardia were not included. A major limitation of our study is that we did not analyze arrhythmias. Arrhythmias may be linked to some tested pathologies, and the model’s potential relevance to arrhythmia characteristics cannot be dismissed. Future research, encompassing arrhythmia analysis, is essential. Fifth, in this study we used interpretation tests to compare the performance of the models and specialists. The sample sizes for these tests were small and the results cannot be considered to have been adequately validated. This is an important limitation of our study. Finally, the dataset predominantly consisted of data from Japanese patients, thus raising uncertainties about the applicability of this model to individuals of Western or other racial backgrounds.
Conclusions
Using data from a multicenter study, we developed models to predict abnormalities of the left heart including low EF, WMA, LVH, LVD, and LAD using Lead I traces extracted from 12-lead ECGs. The Lead I ECG models showed superior or equivalent performance to cardiologists using 12-lead ECGs, indicating the clinical utility of these models.
Acknowledgments
The authors thank Edanz (https://jp.edanz.com/ac) for editing a draft of this manuscript.
Sources of Funding
This study was supported by the Japan Agency for Medical Research and Development (Grant Number: JP23hk0102078h0003).
Disclosures
M.D., H.A., H. Morita, and I.K. are members of Circulation Journal’s Editorial Team. The remaining authors have no conflicts of interest to declare.
IRB Information
This study was approved by the Institutional Review Board of The University of Tokyo (Reference no. 2021132NI-(1)).
Data Availability
As part of the informed consent process, participants were informed that data from this study would not be shared with other researchers, even if the individuals were not identifiable. Thus, the data used in this study cannot be shared. We cannot disclose the code and weights because this is proprietary information.
Supplementary Files
Please find supplementary file(s);
https://doi.org/10.1253/circj.CJ-23-0216
References
- 1.
Curtis LH, Whellan DJ, Hammill BG, Hernandez AF, Anstrom KJ, Shea AM, et al. Incidence and prevalence of heart failure in elderly persons, 1994–2003. Arch Intern Med 2008; 168: 418–424, doi:10.1001/archinternmed.2007.80.
- 2.
Butler J, Yang M, Manzi MA, Hess GP, Patel MJ, Rhodes T, et al. Clinical course of patients with worsening heart failure with reduced ejection fraction. J Am Coll Cardiol 2019; 73: 935–944, doi:10.1016/j.jacc.2018.11.049.
- 3.
Wang TJ, Evans JC, Benjamin EJ, Levy D, LeRoy EC, Vasan RS. Natural history of asymptomatic left ventricular systolic dysfunction in the community. Circulation 2003; 108: 977–982, doi:10.1161/01.Cir.0000085166.44904.79.
- 4.
Espersen C, Modin D, Platz E, Jensen GB, Schnohr P, Prescott E, et al. Global and regional wall motion abnormalities and incident heart failure in the general population. Int J Cardiol 2022; 357: 146–151, doi:10.1016/j.ijcard.2022.03.027.
- 5.
Gottdiener JS, Arnold AM, Aurigemma GP, Polak JF, Tracy RP, Kitzman DW, et al. Predictors of congestive heart failure in the elderly: The Cardiovascular Health Study. J Am Coll Cardiol 2000; 35: 1628–1637, doi:10.1016/s0735-1097(00)00582-9.
- 6.
Echouffo-Tcheugui JB, Erqou S, Butler J, Yancy CW, Fonarow GC. Assessing the risk of progression from asymptomatic left ventricular dysfunction to overt heart failure: A systematic overview and meta-analysis. JACC Heart Fail 2016; 4: 237–248, doi:10.1016/j.jchf.2015.09.015.
- 7.
Koh AS, Murthy VL, Sitek A, Gayed P, Bruyere J Jr, Wu J, et al. Left atrial enlargement increases the risk of major adverse cardiac events independent of coronary vasodilator capacity. Eur J Nucl Med Mol Imaging 2015; 42: 1551–1561, doi:10.1007/s00259-015-3086-6.
- 8.
Jan MI, Khan RA, Khan N, Mahak A, Shah A, Hussain ST, et al. Cardiac hypertrophic risk markers of left ventricle and left atrium in chronic heart failure due to aortic and mitral valve disease. Acta Radiol 2021; 62: 603–609, doi:10.1177/0284185120933530.
- 9.
Bang CN, Soliman EZ, Simpson LM, Davis BR, Devereux RB, Okin PM; ALLHAT Collaborative Research Group. Electrocardiographic left ventricular hypertrophy predicts cardiovascular morbidity and mortality in hypertensive patients: The ALLHAT study. Am J Hypertens 2017; 30: 914–922, doi:10.1093/ajh/hpx067.
- 10.
Cuspidi C, Sala C, Negri F, Mancia G, Morganti A; Italian Society of Hypertension. Prevalence of left-ventricular hypertrophy in hypertension: An updated review of echocardiographic studies. J Hum Hypertens 2012; 26: 343–349, doi:10.1038/jhh.2011.104.
- 11.
Abdin A, Anker SD, Butler J, Coats AJS, Kindermann I, Lainscak M, et al. “Time is prognosis” in heart failure: Time-to-treatment initiation as a modifiable risk factor. ESC Heart Fail 2021; 8: 4444–4453, doi:10.1002/ehf2.13646.
- 12.
Pritchett AM, Jacobsen SJ, Mahoney DW, Rodeheffer RJ, Bailey KR, Redfield MM. Left atrial volume as an index of left atrial size: A population-based study. J Am Coll Cardiol 2003; 41: 1036–1043, doi:10.1016/s0735-1097(02)02981-9.
- 13.
Overvad TF, Nielsen PB, Larsen TB, Søgaard P. Left atrial size and risk of stroke in patients in sinus rhythm. A systematic review. Thromb Haemost 2016; 116: 206–219, doi:10.1160/TH15-12-0923.
- 14.
Somani S, Russak AJ, Richter F, Zhao S, Vaid A, Chaudhry F, et al. Deep learning and the electrocardiogram: Review of the current state-of-the-art. Europace 2021; 23: 1179–1191, doi:10.1093/europace/euaa377.
- 15.
Attia ZI, Kapa S, Lopez-Jimenez F, McKie PM, Ladewig DJ, Satam G, et al. Screening for cardiac contractile dysfunction using an artificial intelligence-enabled electrocardiogram. Nat Med 2019; 25: 70–74, doi:10.1038/s41591-018-0240-2.
- 16.
Elias P, Poterucha TJ, Rajaram V, Moller LM, Rodriguez V, Bhave S, et al. Deep learning electrocardiographic analysis for detection of left-sided valvular heart disease. J Am Coll Cardiol 2022; 80: 613–626, doi:10.1016/j.jacc.2022.05.029.
- 17.
Kwon JM, Lee SY, Jeon KH, Lee Y, Kim KH, Park J, et al. Deep learning-based algorithm for detecting aortic stenosis using electrocardiography. J Am Heart Assoc 2020; 9: e014717, doi:10.1161/jaha.119.014717.
- 18.
Lee S, Chu Y, Ryu J, Park YJ, Yang S, Koh SB. Artificial intelligence for detection of cardiovascular-related diseases from wearable devices: A systematic review and meta-analysis. Yonsei Med J 2022; 63: S93–S107, doi:10.3349/ymj.2022.63.S93.
- 19.
Attia ZI, Harmon DM, Dugan J, Manka L, Lopez-Jimenez F, Lerman A, et al. Prospective evaluation of smartwatch-enabled detection of left ventricular dysfunction. Nat Med 2022; 28: 2497–2503, doi:10.1038/s41591-022-02053-1.
- 20.
Hannun AY, Rajpurkar P, Haghpanahi M, Tison GH, Bourn C, Turakhia MP, et al. Cardiologist-level arrhythmia detection and classification in ambulatory electrocardiograms using a deep neural network. Nat Med 2019; 25: 65–69, doi:10.1038/s41591-018-0268-3.
- 21.
Lang RM, Badano LP, Mor-Avi V, Afilalo J, Armstrong A, Ernande L, et al. Recommendations for cardiac chamber quantification by echocardiography in adults: An update from the American Society of Echocardiography and the European Association of Cardiovascular Imaging. J Am Soc Echocardiogr 2015; 28: 1–39.e14, doi:10.1016/j.echo.2014.10.003.
- 22.
Yancy CW, Jessup M, Bozkurt B, Butler J, Casey DE Jr, Drazner MH, et al. 2013 ACCF/AHA guideline for the management of heart failure: A report of the American College of Cardiology Foundation/American Heart Association Task Force on Practice Guidelines. J Am Coll Cardiol 2013; 62: e147–e239, doi:10.1016/j.jacc.2013.05.019.
- 23.
Samol A, Bischof K, Luani B, Pascut D, Wiemer M, Kaese S. Recording of bipolar multichannel ECGs by a smartwatch: Modern ECG diagnostic 100 years after Einthoven. Sensors (Basel) 2019; 19: 2894, doi:10.3390/s19132894.
- 24.
Katsushika S, Kodera S, Nakamoto M, Ninomiya K, Inoue S, Sawano S, et al. The effectiveness of a deep learning model to detect left ventricular systolic dysfunction from electrocardiograms. Int Heart J 2021; 62: 1332–1341, doi:10.1536/ihj.21-407.
- 25.
Youden WJ. Index for rating diagnostic tests. Cancer 1950; 3: 32–35, doi:10.1002/1097-0142(1950)3:1<32::aid-cncr2820030106>3.0.co;2-3.
- 26.
Selvaraju RR, Cogswell M, Das A, Vedantam R, Parikh D, Batra D. Grad-CAM: Visual explanations from deep networks via gradient-based localization. In:Proceedings of the 2017 IEEE International Conference on Computer Vision (ICCV), Venice, Italy. 2017; 618–626, doi: 10.1109/ICCV.2017.74.
- 27.
Carpenter J, Bithell J. Bootstrap confidence intervals: When, which, what? Stat Med 2000; 19: 1141–1164, doi:10.1002/(sici)1097-0258(20000515)19:9<1141::aid-sim479>3.0.co;2-f.
- 28.
Fischer JE, Bachmann LM, Jaeschke R. A readers’ guide to the interpretation of diagnostic test properties: Clinical example of sepsis. Intensive Care Med 2003; 29: 1043–1051, doi:10.1007/s00134-003-1761-8.
- 29.
Cochran WG. Some methods for strengthening the common χ2 tests. Biometrics 1954; 10: 417–451.
- 30.
Matthews JN, Hoenich NA. Statistical aspects of the design and analysis of studies to compare haemodialysis membranes. Nephrol Dial Transplant 1994; 9(Suppl 2): 176–183.
- 31.
Katsushika S, Kodera S, Sawano S, Shinohara H, Setoguchi N, Tanabe K, et al. An explainable artificial intelligence-enabled electrocardiogram analysis model for the classification of reduced left ventricular function. Eur Heart J Digit Health 2023; 4: 254–264, doi:10.1093/ehjdh/ztad027.
- 32.
Zhao X, Huang G, Wu L, Wang M, He X, Wang JR, et al. Deep learning assessment of left ventricular hypertrophy based on electrocardiogram. Front Cardiovasc Med 2022; 9: 952089, doi:10.3389/fcvm.2022.952089.
- 33.
Kokubo T, Kodera S, Sawano S, Katsushika S, Nakamoto M, Takeuchi H, et al. Automatic detection of left ventricular dilatation and hypertrophy from electrocardiograms using deep learning. Int Heart J 2022; 63: 939–947, doi:10.1536/ihj.22-132.
- 34.
Liu CM, Hsieh ME, Hu YF, Wei TY, Wu IC, Chen PF, et al. Artificial intelligence-enabled model for early detection of left ventricular hypertrophy and mortality prediction in young to middle-aged adults. Circ Cardiovasc Qual Outcomes 2022; 15: e008360, doi:10.1161/circoutcomes.121.008360.
- 35.
Reichek N, Devereux RB. Left ventricular hypertrophy: Relationship of anatomic, echocardiographic and electrocardiographic findings. Circulation 1981; 63: 1391–1398, doi:10.1161/01.cir.63.6.1391.
- 36.
Goto S, Solanki D, John JE, Yagi R, Homilius M, Ichihara G, et al. Multinational federated learning approach to train ECG and echocardiogram models for hypertrophic cardiomyopathy detection. Circulation 2022; 146: 755–769, doi:10.1161/CIRCULATIONAHA.121.058696.
- 37.
Soto JT, Weston Hughes J, Sanchez PA, Perez M, Ouyang D, Ashley EA. Multimodal deep learning enhances diagnostic precision in left ventricular hypertrophy. Eur Heart J Digit Health 2022; 3: 380–389, doi:10.1093/ehjdh/ztac033.
- 38.
Lou YS, Lin CS, Fang WH, Lee CC, Ho CL, Wang CH, et al. Artificial intelligence-enabled electrocardiogram estimates left atrium enlargement as a predictor of future cardiovascular disease. J Pers Med 2022; 12: 315, doi:10.3390/jpm12020315.
- 39.
Bhalla V, Isakson S, Bhalla MA, Lin JP, Clopton P, Gardetto N, et al. Diagnostic ability of B-type natriuretic peptide and impedance cardiography: Testing to identify left ventricular dysfunction in hypertensive patients. Am J Hypertens 2005; 18: 73s–81s, doi:10.1016/j.amjhyper.2004.11.044.
- 40.
Cárdenas-Turanzas M, Follen M, Nogueras-Gonzalez GM, Benedet JL, Beck JR, Cantor SB. The accuracy of the Papanicolaou smear in the screening and diagnostic settings. J Low Genit Tract Dis 2008; 12: 269–275, doi:10.1097/LGT.0b013e31816b44bc.
- 41.
Pisano ED, Gatsonis C, Hendrick E, Yaffe M, Baum JK, Acharyya S, et al. Diagnostic performance of digital versus film mammography for breast-cancer screening. N Engl J Med 2005; 353: 1773–1783, doi:10.1056/NEJMoa052911.