Abstract
Background: The slow-flow phenomenon is associated with worse clinical outcomes after percutaneous coronary intervention (PCI), so our goal for this study was to see how predictive how near-infrared spectroscopy (NIRS) could be.
Methods and Results: We enrolled 179 lesions from 152 patients who had de novo coronary stent implantation guided by NIRS-intravascular ultrasound (IVUS) (male: 69.1%, mean age: 74.3±11.5 years, acute coronary syndrome: 65.1%, diabetes: 42.1%). NIRS automatically determined the maximum 4-mm lipid core burden index (maxLCBI4 mm) value at pre- and post-PCI procedures. The slow-flow phenomenon was defined as the deterioration of TIMI (Thrombolysis in Myocardial Infarction) flows on angiography during the PCI procedure in the absence of mechanical obstruction. The slow-flow phenomenon occurred in 13 (7.3%) lesions, and the slow-flow phenomenon group had a significantly higher maxLCBI4 mm
(740±147 vs. 471±223, P<0.001). The best maxLCBI4 mm
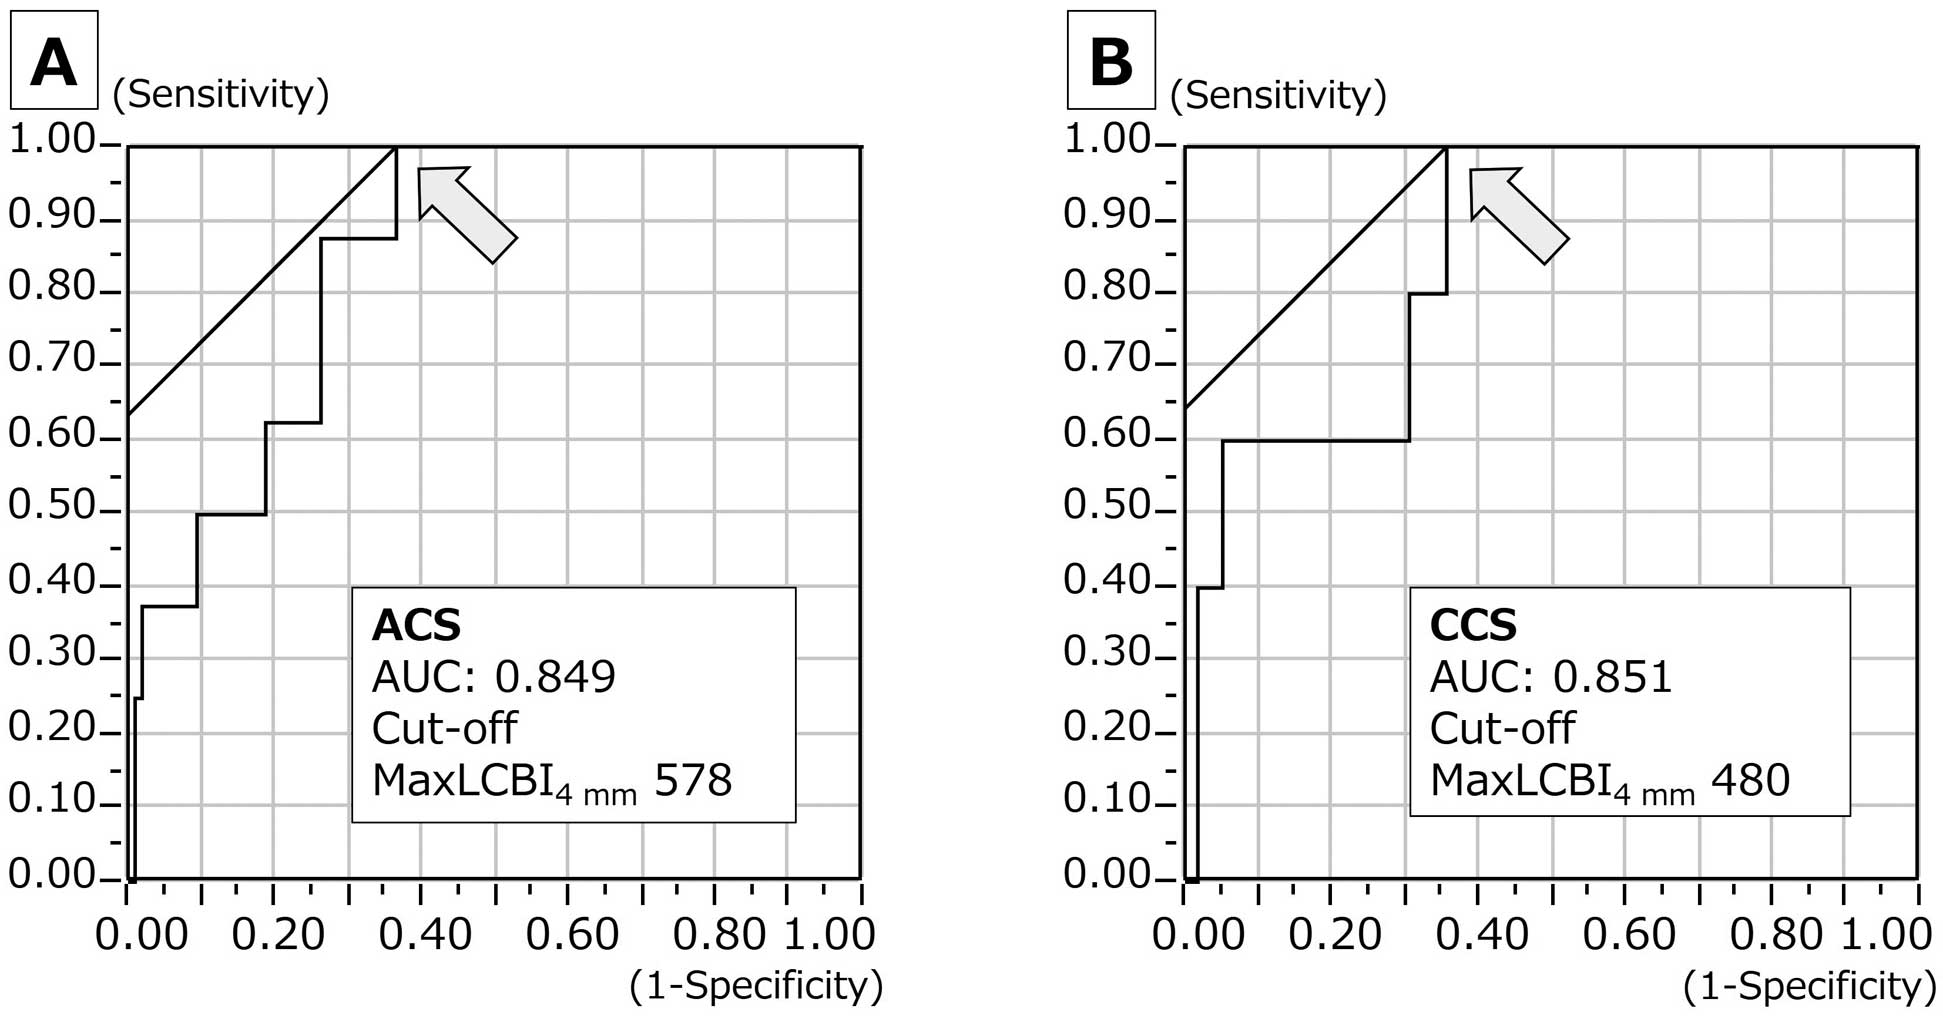
cutoff point in both acute and chronic coronary syndrome was 578 and 480, with sensitivity of 100%, for predicting the slow-flow phenomenon. In the receiver-operating characteristics analysis, the area under the curve for acute and chronic coronary syndrome was 0.849 and 0.851, respectively.
Conclusions: The results of this study support the utility of NIRS-IVUS-guided PCI for the prediction of the slow-flow phenomenon.
The first-line treatment for coronary artery disease is percutaneous coronary intervention (PCI),1 but the slow-flow phenomenon remains a major concern,2 associated with both acute and chronic clinical events after PCI.3 Distal embolization, ischemia-reperfusion injury, and predisposition of an individual’s coronary microcirculation to injury are all factors that contribute to the slow-flow phenomenon.2 The development of intracoronary imaging devices has enabled the evaluation of plaque characteristics of coronary artery stenosis from several perspectives.4–8 Plaque embolization is the primary cause9 and imaging modalities can predict the slow-flow phenomenon.10–12 Recent studies have shown that it can be predicted by automated measurement approaches using near-infrared spectroscopy (NIRS).13
The slow-flow phenomenon is frequently observed during PCI for the culprit lesion in acute coronary syndromes (ACS),2 but can also be seen in chronic coronary syndromes (CCS).10 In the present study, we investigated the prediction of the slow-flow phenomenon in PCI using NIRS in patients with ACS and CCS.
Methods
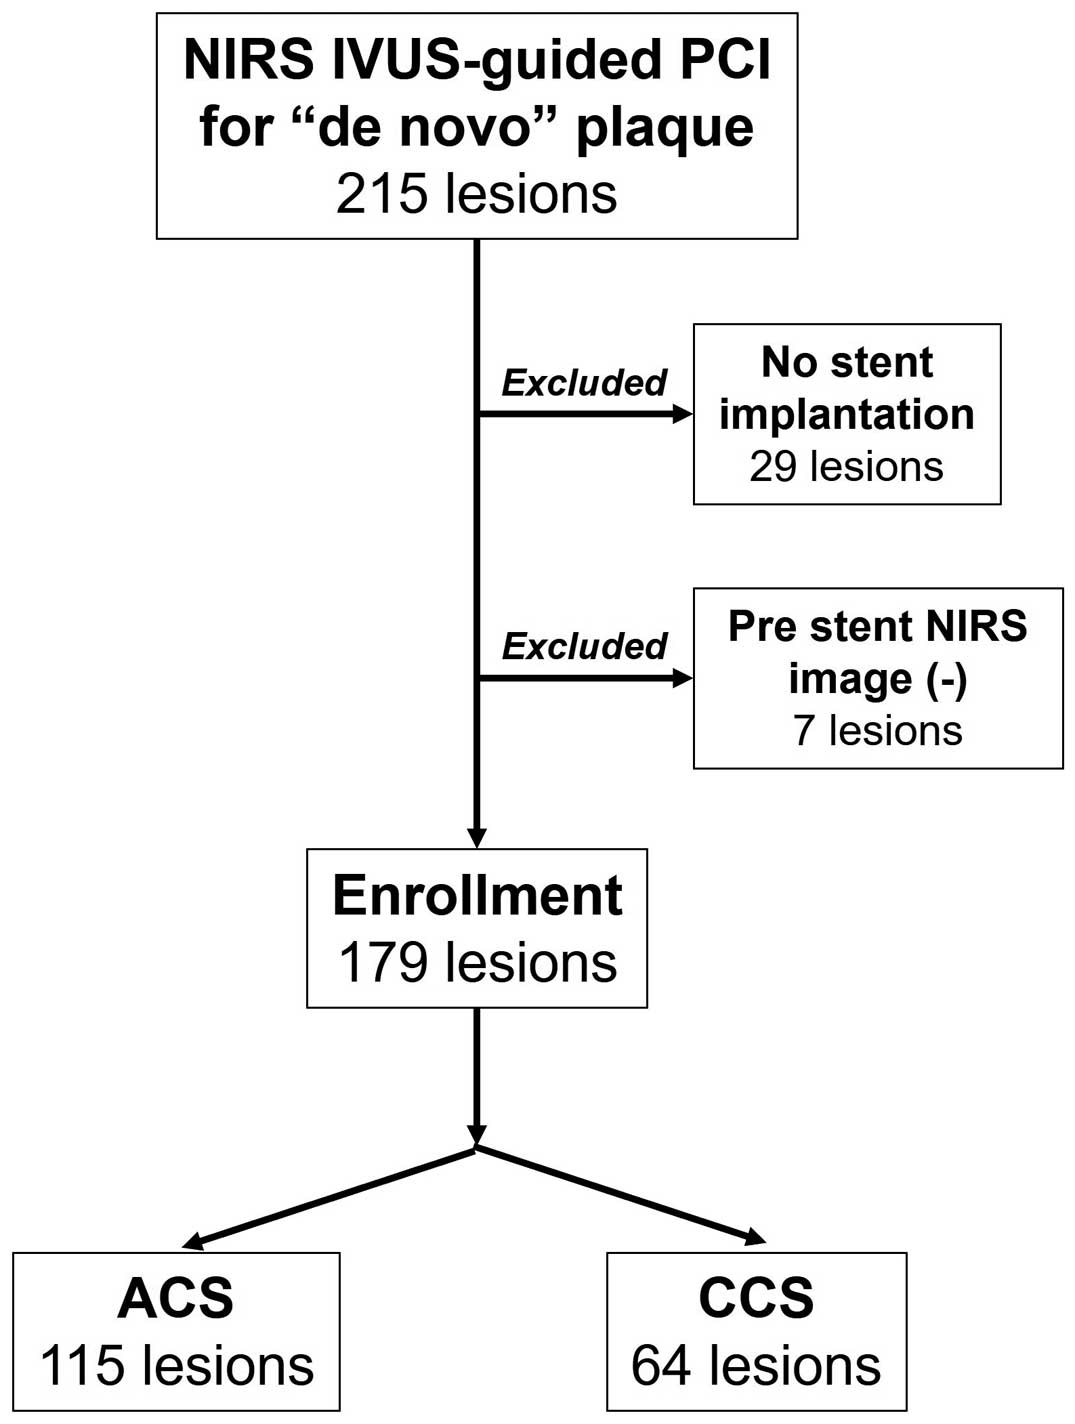
Figure 1 shows the flow chart of patient enrollment for this single-center, observational, retrospective study. Between March 2019 and July 2021, 215 de novo coronary plaque lesions in ACS and CCS were treated with NIRS-IVUS-guided PCI. At our institution, NIRS-IVUS-guided PCI is primarily used for ACS patients, with a utilization rate of 74.6% during the enrollment period; 29 lesions that did not receive stenting were excluded and 7 lesions for which preoperative NIRS observation was not possible were also excluded. Finally, the study included 152 patients with 179 lesions. All PCI procedures were recorded in the Japanese Association of Cardiovascular Intervention and Therapeutics J-PCI registry. The incidence of ACS in 2020 was 54.5%, which was practically equivalent to the average for the entire J-PCI registry.14 The study was approved by the institutional ethics committee (Teirin 21-151) and informed consent was waived following the Japanese Ministry of Health, Labor and Welfare’s standard ethical guidelines. We conducted the study in accordance with the “Declaration of Helsinki” and the ethical standards of the responsible committee (Teikyo University Ethical Review Board for Medical and Health Research Involving Human Subjects) on human experimentation.
Patients were screened for 6-month history of statin use on admission. For qualitative coronary angiographic assessment of lesion characteristics, we used the same standard definitions as previously published.15 At our institution, standard antiplatelet therapy included aspirin 300 mg and thienopyridine (clopidogrel 300 mg or prasugrel 20 mg) given as needed to patients with ACS,16 or aspirin 100 mg/day and thienopyridine (clopidogrel 75 mg/day or prasugrel 3.75 mg) for patients with CCS.17 The following procedure was routine for NIRS-IVUS-guided PCI at our institution. First, patients were preoperatively administered 100 IU/kg of heparin and then a guiding catheter was inserted into the ostium of the target vessel before administration of isosorbide nitrate (0.5 mg). If the NIRS-IVUS catheter (TVC Imaging System, Infrared, Burlington, MA, USA)18 could not cross the target lesion, dilation with a balloon of 2.0 or 2.25 mm diameter was performed until the NIRS-IVUS catheter could cross the target lesion. Motorized pull-back was performed at a rate of 1.0 mm/s. In the culprit plaque, the TVC Imaging System workstation automatically calculated a maximum 4-mm lipid core burden index (maxLCBI4 mm). The LCBI was measured automatically in the vessel, including the culprit lesion, as well as in the in-stent subsegment of the final pull-back image. Vulnerable plaques were defined as maxLCBI4 mm
>400.19 At the time of this study, 3 2nd-generation drug-eluting stents were available: XIENCETM
(Abbott Vascular, Santa Clara, CA, USA), SYNERGYTM
(Boston Scientific, Natick, MA, USA), and ResoluteTM
(Medtronic, Santa Rosa, CA, USA). To minimize incomplete stent apposition and ensure complete lesion coverage, all stent implantations were guided by IVUS and observed concurrently with NIRS.7 The operator chose the stent type, and used a thrombectomy catheter,20 and filter-type distal protection guide wire.21 If the slow-flow phenomenon was identified, additional mechanical dilation was minimized.22 The slow-flow phenomenon was defined as a worsening of TIMI (Thrombolysis In Myocardial Infarction) flow on angiography during the PCI procedure (pre- and post-dilatation, and at stent implantation) without distal protection devices.9
Statistical Analysis
To compare continuous variables expressed as mean±standard deviation, an unpaired t-test was used. The chi-square and Fisher’s exact tests were used to compare categorical variables expressed as frequencies. The optimal maxLCBI4 mm
cutoff value for predicting the slow-flow phenomenon was determined using receiver-operating characteristic (ROC) analysis. The cutoff value was determined by estimating the greatest sum of sensitivity and specificity. To determine test accuracy, the area under the ROC curve (AUC) was calculated. All reported P values are two-sided and had a statistically significant P value of 0.05. For statistical analysis, JMP software was used (SAS Institute, Cary, NC, USA).
Results
Absence of laboratory data or medical information excluded 2 and 3 patients, respectively. The slow-flow phenomenon occurred in 13 (7.3%) lesions: 8 (7.0%) ACS lesions and 5 (7.8%) CCS lessons. Vasodilative agents were administered immediately to all treated vessels exhibiting the slow-flow phenomenon.
The average age of the study group was 74.1 years and the diagnosis was ACS in two-thirds and ST-elevation myocardial infarction (STEMI) in one-third (Table 1). Table 2 shows the lesion characteristics. Approximately half of the lesions were in the left anterior descending coronary artery, and 80% of CCS lesions with the slow-flow phenomenon were in the right coronary artery. Ostial lesions were not frequently observed, but were responsible for 40% of cases of the slow-flow phenomenon in the CCS group. Final TIMI 3 flow was achieved in 11 lesions. TIMI flow 1 remained in 1 ACS lesion despite nicorandil administration to the coronary artery. Coronary dissection, which appeared after the slow-flow phenomenon, resulted in a final TIMI flow 0 in 1 CCS lesion. A total of 1 ACS lesion showed the slow-flow phenomenon after pre-balloon dilatation, and subsequently the FiltrapTM
was used before stent implantation. Of the 3 lesions requiring the FiltrapTM, not one showed the slow-flow phenomenon during protection by the device. In the PCI procedural data, there was no discernible difference between slow-flow phenomenon (+) and (−), regardless of ACS or CCS. The maxLCBI4 mm
and LCBI were significantly higher in slow-flow lesions in both the ACS and CCS groups. Overall, vulnerable plaque, defined as maxLCBI4 mm
>400, was more frequently observed in lesions showing the slow-flow phenomenon. We used ROC analysis to determine the cutoff value of maxLCBI4 mm
for the slow-flow phenomenon. Figure 2 shows that the best maxLCBI4 mm
cutoff value in ACS lesions was 578 (AUC: 0.849, sensitivity: 100%, specificity: 64.4%), and 480 in CCS lesions (AUC: 0.851, sensitivity: 100%, specificity: 63.6%).
Table 1.
Patients’ Demographics
| |
Total (n=152) |
| Male (%) |
105 (69.1) |
| Age, years |
74.3±11.5 |
| Body mass index, kg/m2 |
22.9±4.4 |
| Diagnosis (%) |
| Chronic coronary syndrome |
53 (34.9) |
| Effort angina pectoris |
12 (7.9) |
| Silent myocardial ischemia |
40 (26.3) |
| Old myocardial infarction |
1 (0.7) |
| Acute coronary syndrome |
99 (65.1) |
| Unstable angina pectoris |
20 (13.2) |
| Non-ST-elevation myocardial infarction |
28 (18.4) |
| ST-elevation myocardial infarction |
51 (33.6) |
| Hypertension (%) |
104 (68.4) |
| Dyslipidemia (%) |
89 (58.5) |
| Diabetes (%) |
64 (42.1) |
| Insulin-treated diabetes (%) |
13 (8.6) |
| Current smoking (%) |
9 (5.9) |
| Peripheral artery disease (%) |
11 (7.2) |
| Hemodialysis (%) |
2 (1.3) |
| Current smoking (%) |
41 (27.0) |
| Peripheral artery disease (%) |
26 (17.1) |
| Hemodialysis (%) |
5 (3.3) |
| Atrial fibrillation (%) |
22 (14.5) |
| Old myocardial infarction (%) |
17 (11.2) |
| History of percutaneous coronary intervention (%) |
23 (15.1) |
| Laboratory data |
| Low-density lipoprotein cholesterol, mg/dL |
102.6±36.9 |
| High-density lipoprotein cholesterol, mg/dL |
54.4±14.9 |
| Triglyceride, mg/dL |
122.0±76.1 |
| Serum glucose, mg/dL |
153.4±75.3 |
| HbA1c, % |
6.66±1.46 |
| eGFR |
56.6±24.2 |
| Medication history on admission |
| Statins (%) |
61 (40.4) |
| History of statin use >6 months (%) |
49 (32.9) |
Table 2.
Lesion Characteristics: Slow-Flow Phenomenon (+) vs. (−)
| |
Total
(n=179) |
Total: slow-flow
phenomenon |
ACS
(n=115) |
ACS: slow-flow
phenomenon |
CCS
(n=64) |
CCS: slow-flow
phenomenon |
Yes
(n=13) |
No
(n=166) |
P value |
Yes
(n=8) |
No
(n=107) |
P value |
Yes
(n=5) |
No
(n=59) |
P value |
| Culprit vessel (%) |
|
|
|
0.226 |
|
|
|
0.772 |
|
|
|
0.076 |
| RCA |
54
(30.2) |
7
(53.9) |
47
(28.3) |
|
36
(31.3) |
3
(37.5) |
33
(30.8) |
|
18
(28.1) |
4
(80.0) |
14
(23.7) |
|
| LAD |
89
(49.7) |
5
(38.5) |
84
(50.6) |
|
53
(46.1) |
4
(50.0) |
49
(45.8) |
|
36
(56.3) |
1
(20.0) |
35
(59.3) |
|
| LCx |
29
(16.2) |
1
(7.7) |
28
(4.2) |
|
20
(17.4) |
1
(12.5) |
19
(17.8) |
|
9
(14.1) |
0
(0) |
9
(15.3) |
|
| LMT |
7
(3.9) |
0
(0) |
7
(4.2) |
|
6
(5.2) |
0
(0) |
6
(5.6) |
|
1
(1.6) |
0
(0) |
1
(1.7) |
|
| Qualitative assessment (%) |
Moderate/severe
calcification |
69
(38.5) |
5
(38.5) |
64
(38.6) |
>0.99 |
39
(33.9) |
3
(37.5) |
36
(33.6) |
>0.99 |
30
(46.9) |
2
(40.0) |
28
(47.5) |
>0.99 |
| Bifurcation |
66
(36.9) |
2
(15.4) |
64
(38.6) |
0.136 |
45
(39.1) |
1
(12.5) |
44
(41.1) |
0.146 |
21
(32.8) |
1
(20.0) |
20
(33.9) |
>0.99 |
| Ostium |
11
(6.1) |
2
(15.4) |
9
(5.4) |
0.184 |
6
(5.2) |
0
(0) |
6
(5.6) |
>0.99 |
5
(7.8) |
2
(40.0) |
3
(5.1) |
0.045 |
| Thrombus |
28
(15.6) |
1
(7.7) |
27
(16.3) |
0.695 |
28
(24.3) |
1
(12.5) |
27
(25.2) |
0.677 |
0
(0) |
0
(0) |
0
(0) |
NA |
| Diffuse |
92
(51.4) |
9
(69.2) |
83
(50.0) |
0.251 |
52
(45.2) |
6
(75.0) |
46
(43.0) |
0.138 |
40
(62.5) |
3
(60.0) |
37
(62.7) |
>0.99 |
| Type B2/C |
158
(88.3) |
12
(92.3) |
146
(88.0) |
>0.99 |
102
(88.7) |
7
(87.5) |
95
(88.8) |
>0.99 |
56
(87.5) |
5
(100) |
51
(86.4) |
>0.99 |
| Pre-TIMI: 0 |
30
(16.8) |
2
(15.4) |
28
(16.9) |
>0.99 |
29
(25.2) |
1
(12.5) |
28
(26.2) |
0.677 |
1
(1.6) |
1
(20.0) |
0
(0) |
0.078 |
| Post-TIMI: 3 |
177
(98.9) |
11
(84.6) |
166
(100) |
0.005 |
114
(99.1) |
7
(87.5) |
107
(100) |
0.070 |
63
(98.4) |
4
(80.0) |
59
(100) |
0.078 |
Pre-NIRS balloon
dilatation (%) |
100
(55.9) |
9
(69.2) |
91
(54.8) |
0.392 |
70
(60.9) |
5
(62.5) |
65
(60.8) |
>0.99 |
30
(46.9) |
4
(80.0) |
26
(44.1) |
0.177 |
| Stent |
Mean diameter,
mm |
2.96±0.44 |
2.99±0.50 |
2.96±0.44 |
0.846 |
2.97±0.47 |
2.89±0.48 |
2.97±0.47 |
0.657 |
2.96±0.40 |
3.15±0.54 |
2.94±0.38 |
0.455 |
| Total length, mm |
28.9±15.0 |
38.1±20.5 |
28.2±14.4 |
0.421 |
26.9±12.9 |
34.9±14.4 |
26.3±19.7 |
0.142 |
32.5±17.8 |
43.2±29.0 |
31.6±16.6 |
0.425 |
Stent balloon
pressure, atm |
13.9±2.2 |
14.5±2.2 |
13.8±2.2 |
0.257 |
14.1±2.3 |
15.0±1.4 |
14.0±2.3 |
0.101 |
13.5±2.1 |
13.8±3.0 |
13.4±2.1 |
0.807 |
Post-balloon
dilatation (%) |
115
(64.2) |
7
(53.8) |
108
(65.1) |
0.549 |
67
(58.3) |
3
(37.5) |
64
(59.8) |
0.275 |
48
(75.0) |
4
(80.0) |
44
(74.6) |
>0.99 |
Post-balloon
pressure, atm |
16.3±3.3 |
16.3±1.8 |
16.3±3.3 |
0.941 |
15.8±3.4 |
17.3±1.2 |
15.7±3.5 |
0.114 |
17.1±2.9 |
15.5±1.9 |
17.2±2.9 |
0.170 |
| Thrombectomy (%) |
35
(19.6) |
2
(15.4) |
33
(19.9) |
>0.99 |
35
(30.4) |
2
(25.0) |
33
(30.8) |
>0.99 |
0
(0) |
0
(0) |
0
(0) |
NA |
| Use of FiltrapTM (%) |
3
(1.7) |
1
(7.7) |
2
(1.2) |
0.204 |
2
(1.7) |
1
(12.5) |
1
(0.9) |
0.135 |
1
(1.6) |
0
(0) |
1
(1.7) |
>0.99 |
| NIRS data |
| MaxLCBI4 mm |
491±229 |
740±147 |
471±223 |
<0.001 |
512±237 |
769±128 |
493±227 |
<0.001 |
451±219 |
695±178 |
431±211 |
0.026 |
MaxLCBI4 mm
>400 (%) |
113
(63.1) |
13
(100) |
100
(60.2) |
0.002 |
77
(67.0) |
8
(100) |
69
(64.5) |
0.051 |
36
(56.3) |
5
(100) |
3
(52.5) |
0.062 |
| LCBI |
137±88 |
215±73 |
131±86 |
0.001 |
173±88 |
236±82 |
136±85 |
0.010 |
127±86 |
182±46 |
123±87 |
0.042 |
ACS, acute coronary syndrome; CCS, chronic coronary syndrome; LAD, left anterior descending coronary artery; LCx, left circumflex coronary artery; LMT, left main trunk; maxLCBI4 mm, maximum 4-mm lipid core burden index; NIRS, near-infrared spectroscopy; RCA, right coronary artery; TIMI, Thrombolysis In Myocardial Infarction.
The in-stent maxLCBI4 mm
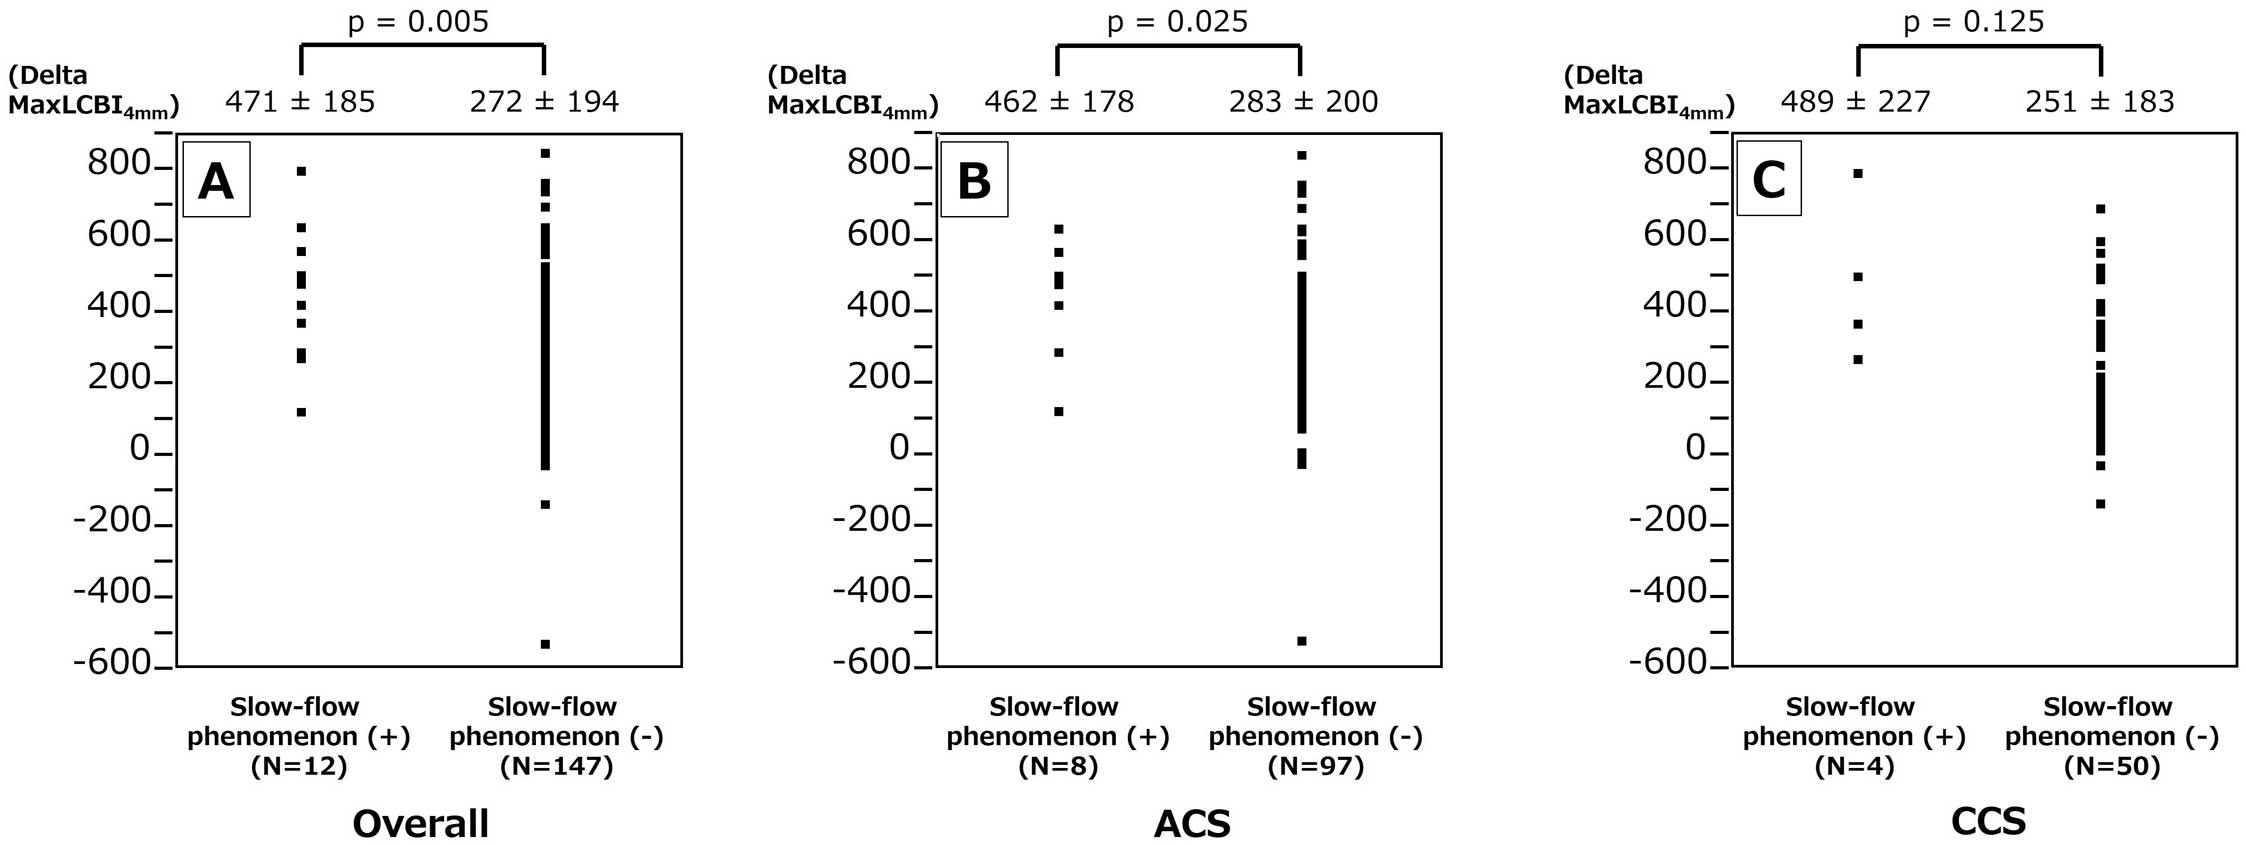
on final pull-back image was analyzable in 159 (88.8%) lesions, and there was no significant difference between slow-flow phenomenon (+) and (−): 261±200 vs. 212±174, P=0.426. Figure 3A depicts the delta in-stent maxLCBI4 mm
(formula: initial maxLCBI4 mm
−final in-stent maxLCBI4 mm) difference between slow-flow phenomenon (+) and (−). The delta in-stent maxLCBI4 mm
was higher in lesions with slow flow. Similarly, the slow-flow phenomenon (+) group showed a higher delta in-stent maxLCBI4 mm
in ACS subgroup, although the difference was not significant in the CCS subgroup (Figure 3B,C). Figure 4A,B shows the delta in-stent maxLCBI4 mm
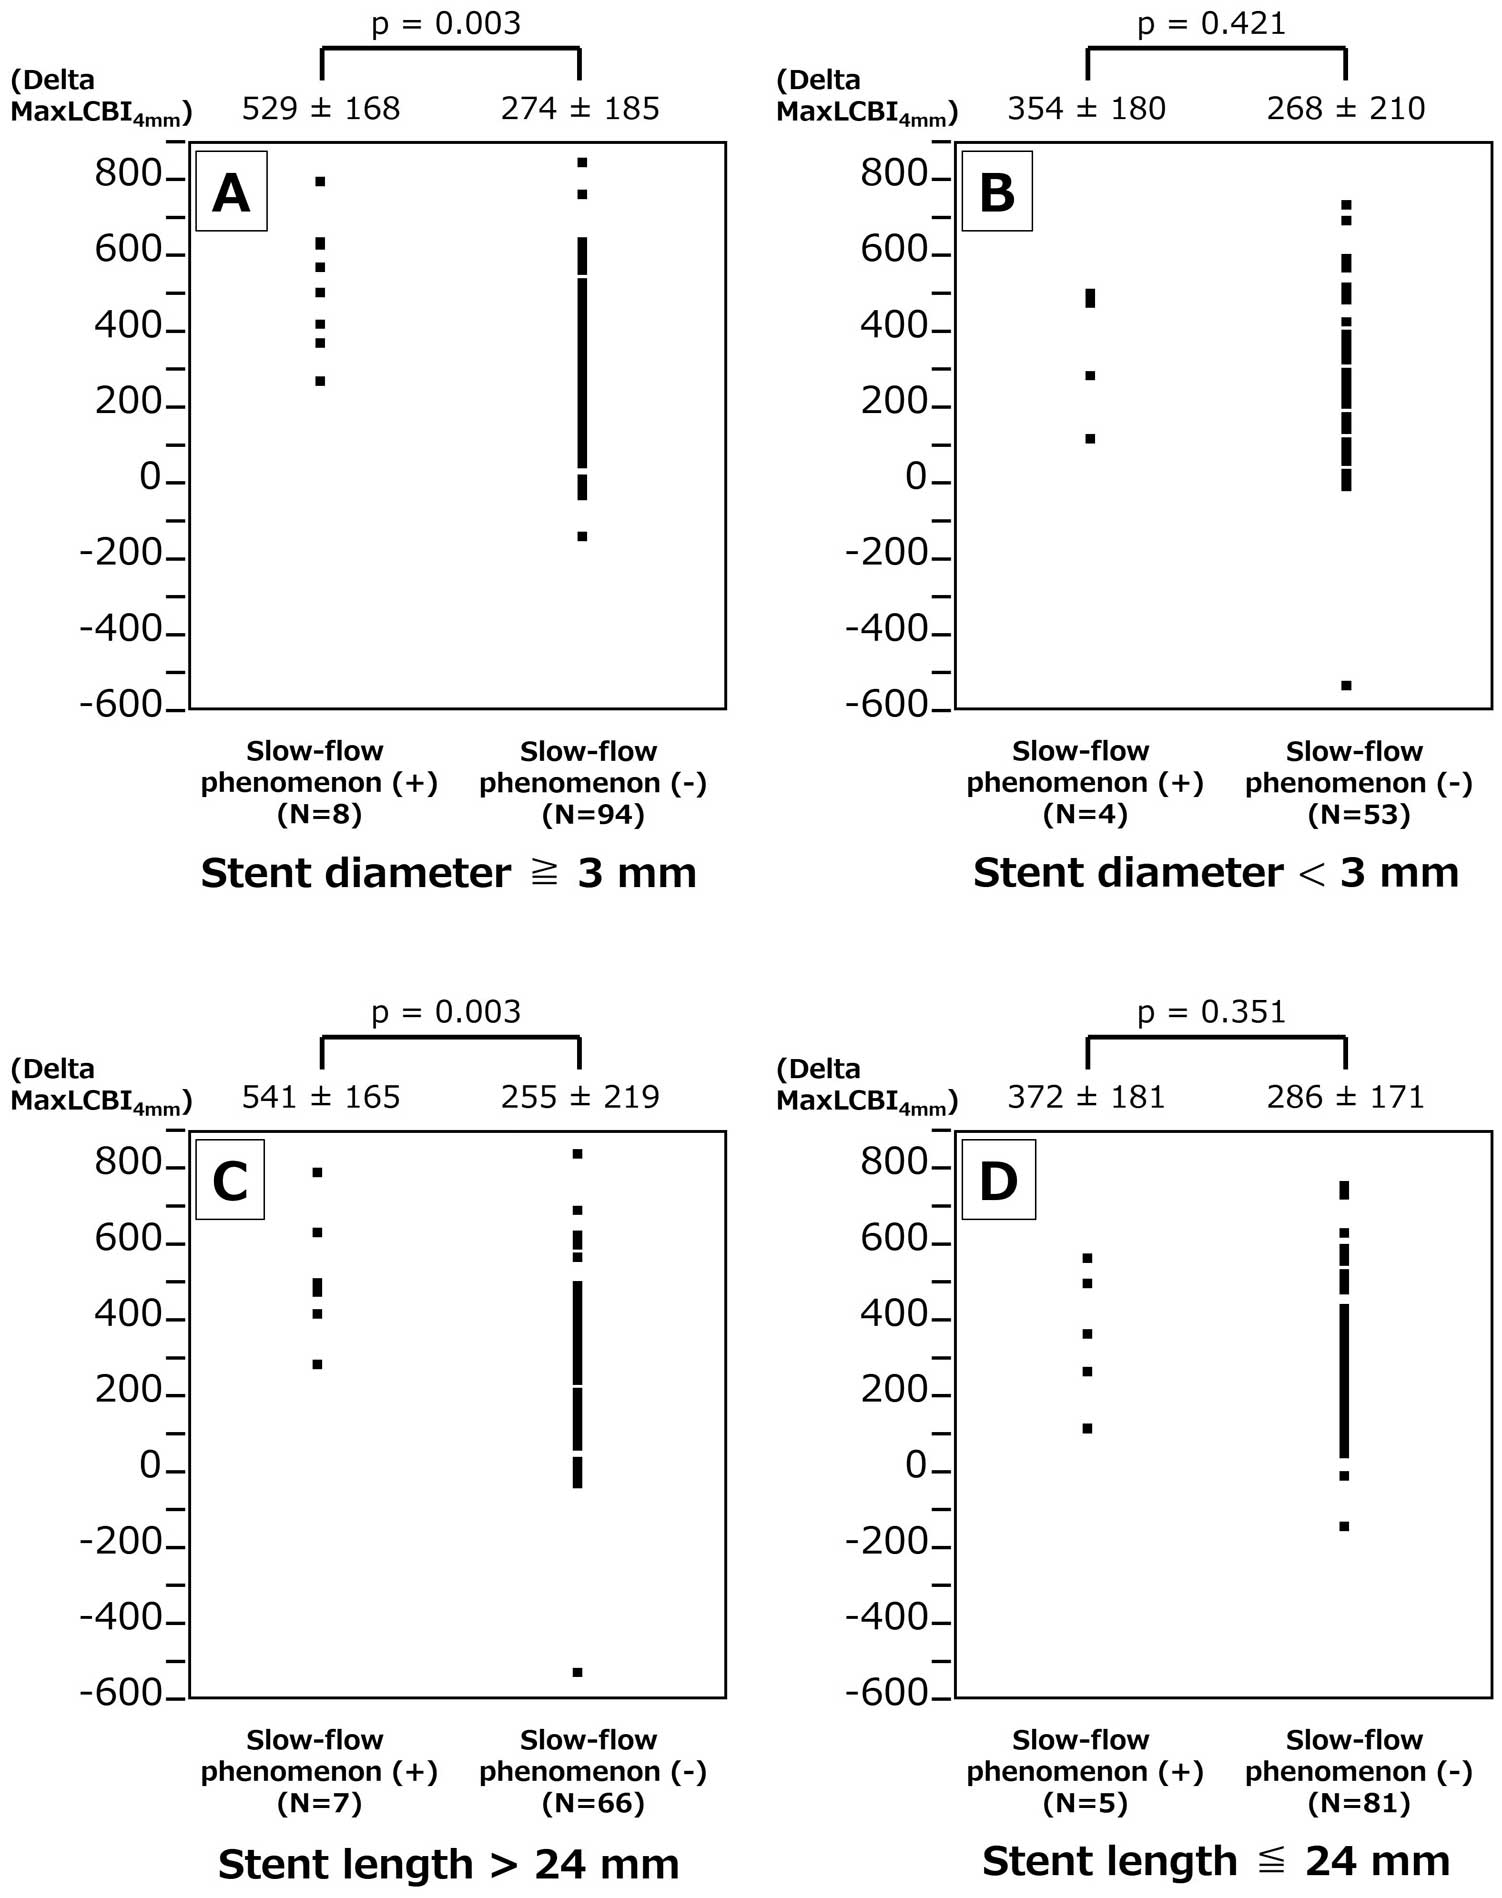
difference between slow-flow phenomenon (+) and (−) in mean stent diameter ≥3- and <3-mm subgroups. The slow-flow phenomenon (+) group showed higher delta in-stent maxLCBI4 mm
in lesions with mean stent diameter ≥3 mm, although the difference was less in lesions with a mean stent diameter <3 mm. Figure 4C,D shows the delta in-stent maxLCBI4 mm
difference between slow-flow phenomenon (+) and (−) in total stent length >24- and ≤24-mm subgroups. The slow-flow phenomenon (+) group showed a higher delta in-stent maxLCBI4 mm
in lesions with total stent length >24 mm, although the difference was less in lesions with total stent length ≤24 mm. Figure 5A,B shows the delta in-stent maxLCBI4 mm
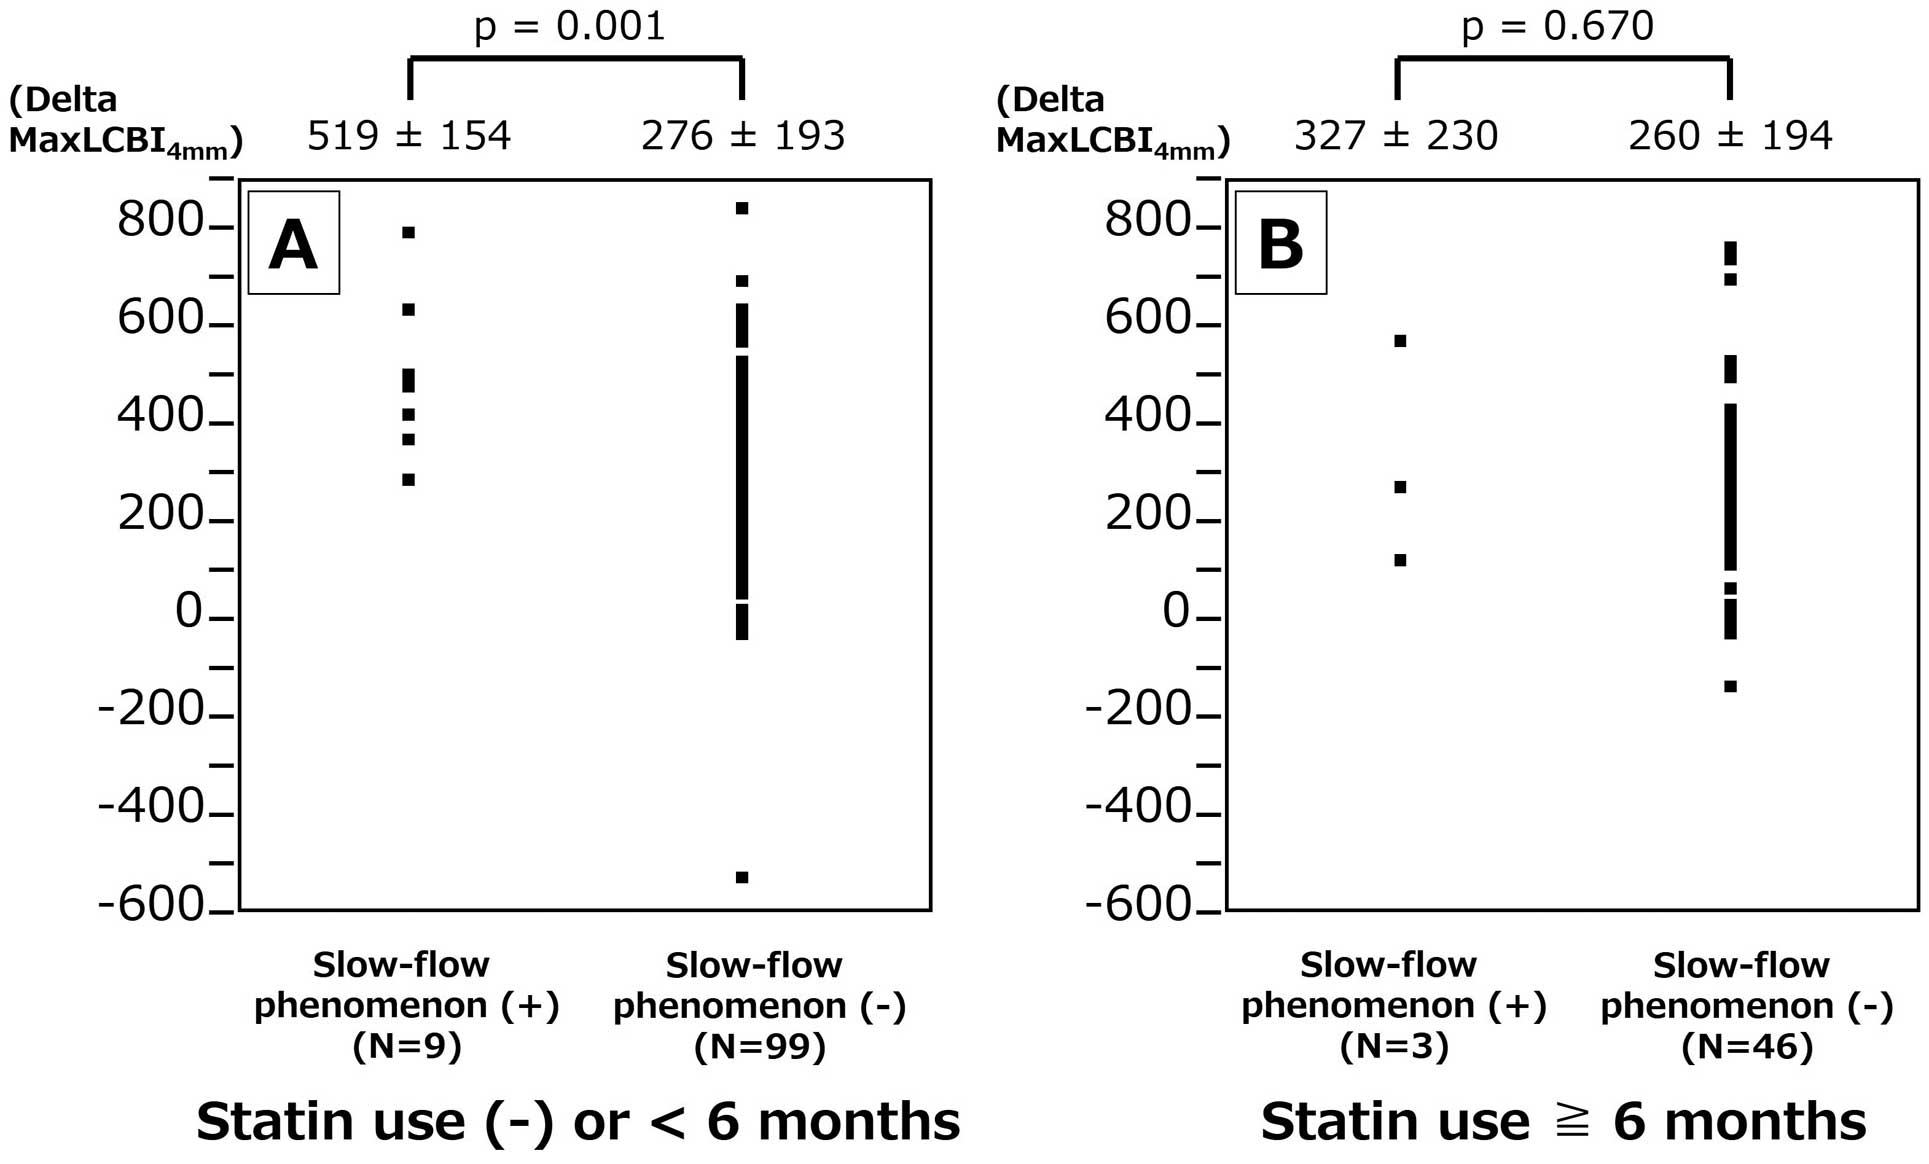
difference between slow-flow phenomenon (+) and (−) in subgroups for a history of statin use over 6 months (+) and (−) significantly. The slow-flow phenomenon (+) group showed a higher delta in-stent maxLCBI4 mm
when the history of statin use over 6 months was negative.
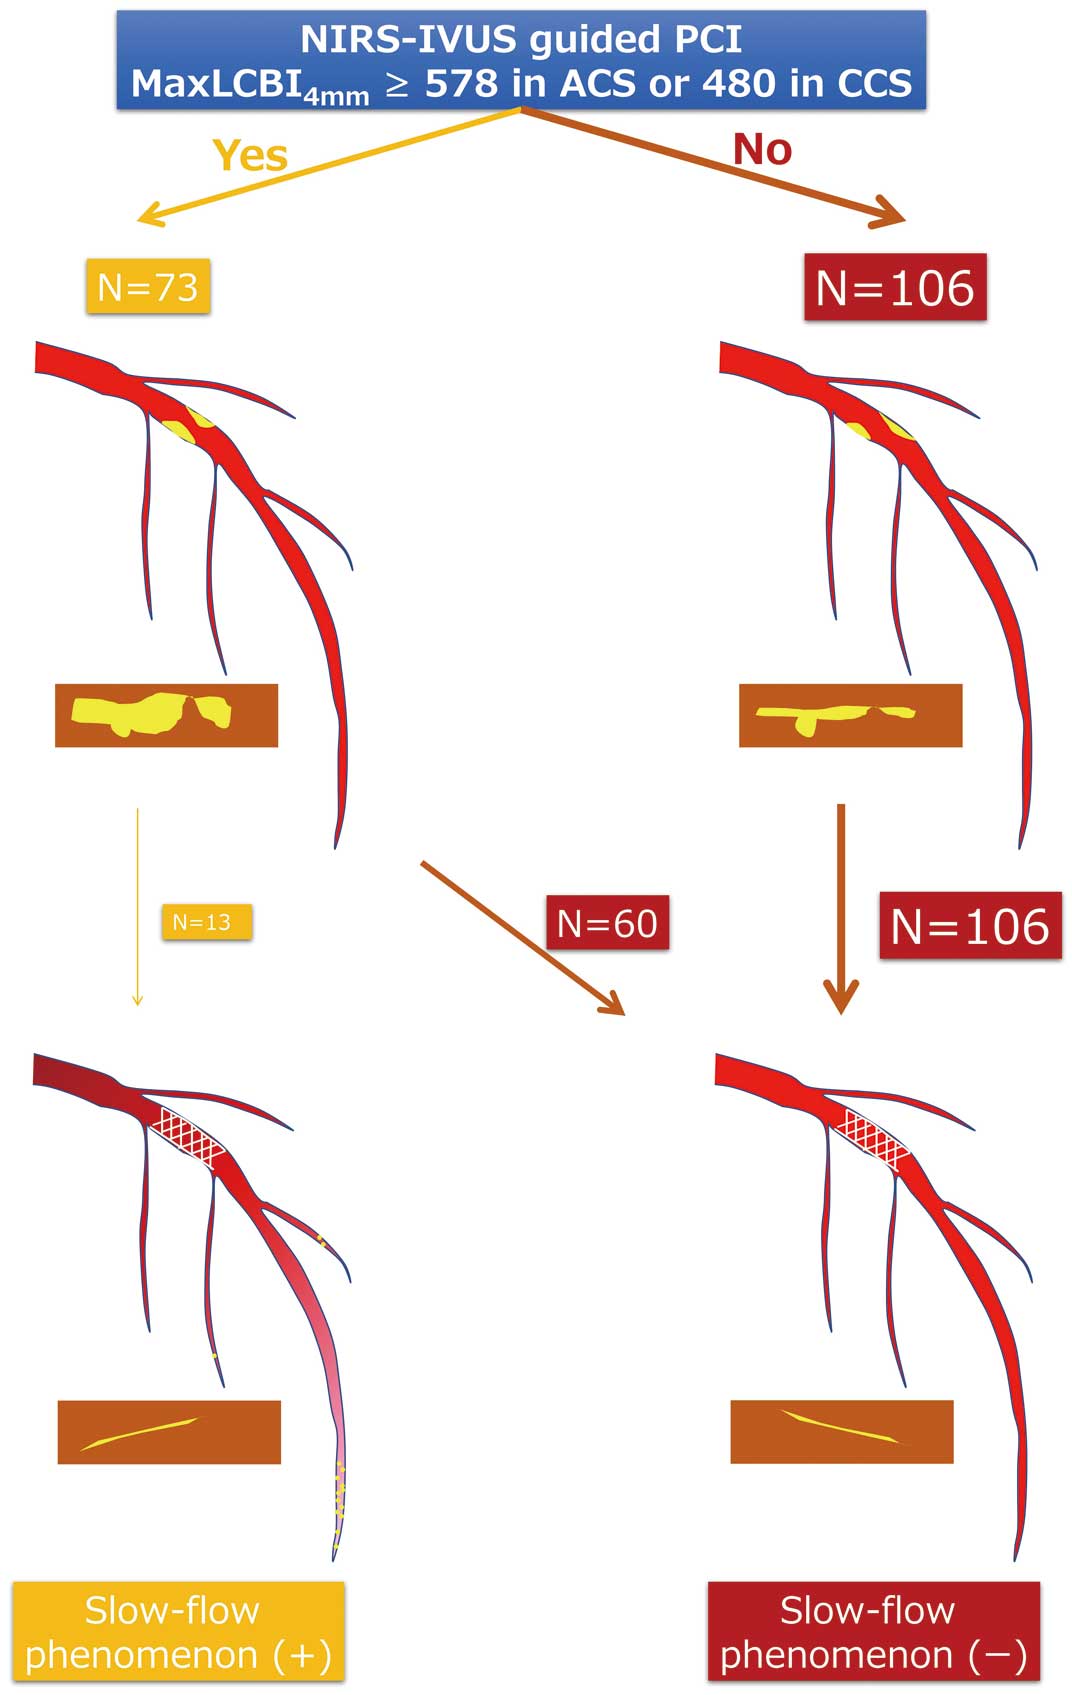
A central illustration of this study is shown in Figure 6.
Discussion
The main findings of this study are: (1) maxLCBI4 mm
was higher in lesions with the slow-flow phenomenon, regardless of ACS or CCS, (2) maxLCBI4 mm
can predict the slow-flow phenomenon, and (3) delta maxLCBI4 mm
is greater in the slow-flow phenomenon.
Previous investigations have already shown that NIRS can predict microvascular obstruction caused by lipid-rich plaque. Sato et al demonstrated the utility of the total LCBI/highest LCBI ratio within the culprit plaque in predicting filter-no reflow in ACS patients.13 In another study, Terada et al demonstrated that NIRS can predict microvascular obstruction, as assessed using cardiac magnetic resonance imaging following PCI for STEMI.23 According to them, maxLCBI4 mm
>600 was the best cutoff value for predicting microvascular obstruction.23 Our data support those reports. On the other hand, the cutoff value of maxLCBI4 mm
for CCS was smaller than that for ACS. Usually at the culprit lesions of CCS, the lipid core is smaller, and the fibrous cap is thicker. However, one may speculate that in relatively noncompliant vessels due to stiff fibrosis or calcification, the intraplaque pressure may increase during balloon inflation or stent implantation, resulting in embolic complications.10
The slow-flow phenomenon is related to poor clinical outcomes.2 According to Ndrepepa et al the slow-flow phenomenon is a strong predictor of 5-year death of patients who undergo PCI for STEMI and provides prognostic information that is independent of and beyond that provided by infarct size.3 FiltrapTM
was invented by Isshiki et al21 as a filter-type distal protection guide wire to prevent microvascular embolism, and Hibi et al investigated the efficacy of FiltrapTM
in PCI for ACS culprit plaque lesions longer than 5 mm on pre-PCI IVUS images, a known predictor for the slow-flow phenomenon.11 FiltrapTM
reduced the incidence of slow-flow phenomenon and in-hospital adverse clinical events,24 but failed to improve 1-year cardiac mortality rates or the incidence of MI.25 IVUS is limited in ability to distinguish between thrombus and lipid-rich plaque that is causing the slow-flow phenomenon because both can show echo attenuation. NIRS can depict lipid-rich plaque by displaying its metric value, but it does not address the issue of intra- and interobserver variability of eye-ball judgment,26 which is undoubtedly a factor in the analysis of IVUS and optical coherence tomography (OCT).
The data from the present study showed that delta maxLCBI4 mm
was greater in lesions showing a slow-flow phenomenon, which suggests that crushed and floating lipid-rich plaque detected by NIRS is responsible for the slow-flow phenomenon. This result was more prominent when the history of statin use was none or <6 months. It is known that lipid-lowering therapy by statins can lead to decreases in both plaque volume and fibrous cap thickening.27 Gamou et al revealed that thin-cap fibroatheroma detected by OCT is a strong predictor for deteriorated coronary flow during stent implantation.28 Our data support that the plaque stabilization by statin therapy may prevent the slow-flow phenomenon. In addition, the relationship between delta maxLCBI4 mm
and the slow-flow phenomenon was prominent with stent length >24 mm, or stent diameter ≥3 mm. In fact, the maxLCBI4 mm
does not necessarily indicate the total amount of lipid-rich plaque that is crushed by PCI, but rather the arc. If the maxLCBI4 mm
is high, plus the lesion is long or the vessel diameter is large, it is presumed that the total plaque volume is sufficient to cause the slow-flow phenomenon. However, some lesions did not show this despite a high delta maxLCBI4 mm. In this study, when the cutoff value of maxLCBI4 mm
was 578 in ACS and 480 in CCS, the sensitivity was 100% and specificity was ≈65%. These data suggest requirements other than distal micro-embolism due to lipid-rich plaque for the occurrence of slow flow. Ischemia-reperfusion injury and the individual’s coronary microcirculation’s predisposition to injury2 may be useful in further distinguishing high-risk plaque causing the slow-flow phenomenon, especially in the culprit lesions of ACS. Future research using modern imaging and physiological modalities may reveal how to accurately select patients who require distal protection devices such as FiltrapTM.29
Study Limitations
First, the corrected TIMI frame count was not measured and accordingly, subtle deteriorations in blood flow may not have been evaluated. For example, sometimes the TIMI grade does not decrease after PCI despite worsening of the coronary artery blood flow. Such cases were not adjudicated as showing the slow-flow phenomenon in this study. Second, the influence of thrombus aspiration on the slow-flow phenomenon could be evaluated in the present study.
Conclusions
The results of this study support the use of NIRS-IVUS-guided PCI to predict the slow-flow phenomenon and to provide insights into both the interventional and medical approaches to treating ACS and CCS.
Conflicts of Interest
N.S. reports a relationship with Nipro Corporation that includes speaking and lecture fees. All of the other authors declare that they have no conflicts of interest.
Disclosures
K.K. is a member of Circulation Journal’s Editorial Team.
IRB Information
The present study was approved by Teikyo University Ethical Review Board for Medical and Health Research Involving Human Subjects. Reference number: Teirin 21-151.
Data Availability
The deidentified participant data will not be shared.
References
- 1.
Neumann FJ, Sousa-Uva M, Ahlsson A, Alfonso F, Banning AP, Benedetto U, et al. 2018 ESC/EACTS Guidelines on myocardial revascularization. Eur Heart J 2019; 40: 87–165, doi:10.1093/eurheartj/ehy394.
- 2.
Niccoli G, Burzotta F, Galiuto L, Crea F. Myocardial no-reflow in humans. J Am Coll Cardiol 2009; 54: 281–292, doi:10.1016/j.jacc.2009.03.054.
- 3.
Ndrepepa G, Tiroch K, Fusaro M, Keta D, Seyfarth M, Byrne RA, et al. 5-year prognostic value of no-reflow phenomenon after percutaneous coronary intervention in patients with acute myocardial infarction. J Am Coll Cardiol 2010; 55: 2383–2389, doi:10.1016/j.jacc.2009.12.054.
- 4.
Suzuki N, Angiolillo DJ, Monteiro C, Shuja S, Futamatsu H, Kawaguchi R, et al. Variable histological and ultrasonic characteristics of restenosis after drug-eluting stents. Int J Cardiol 2008; 130: 444–448, doi:10.1016/j.ijcard.2007.08.143.
- 5.
Coletta J, Suzuki N, Nascimento BR, Bezerra HG, Rosenthal N, Guagliumi G, et al. Use of optical coherence tomography for accurate characterization of atherosclerosis. Arq Bras Cardiol 2010; 94: 250–254, 268–272, 254–259, doi:10.1590/s0066-782x2010000200020.
- 6.
Fu Q, Suzuki N, Kozuma K, Miyagawa M, Nomura T, Kawashima H, et al. Quantitative optical coherence tomography analysis for late in-stent restenotic lesions. Int Heart J 2015; 56: 13–17, doi:10.1536/ihj.14-136.
- 7.
Saito Y, Kobayashi Y, Fujii K, Sonoda S, Tsujita K, Hibi K, et al. Clinical expert consensus document on intravascular ultrasound from the Japanese Association of Cardiovascular Intervention and Therapeutics (2021). Cardiovasc Interv Ther 2022; 37: 40–51, doi:10.1007/s12928-021-00824-0.
- 8.
Fujii K, Kubo T, Otake H, Nakazawa G, Sonoda S, Hibi K, et al. Expert consensus statement for quantitative measurement and morphological assessment of optical coherence tomography: Update 2022. Cardiovasc Interv Ther 2022; 37: 248–254, doi:10.1007/s12928-022-00845-3.
- 9.
Kotani J, Nanto S, Mintz GS, Kitakaze M, Ohara T, Morozumi T, et al. Plaque gruel of atheromatous coronary lesion may contribute to the no-reflow phenomenon in patients with acute coronary syndrome. Circulation 2002; 106: 1672–1677, doi:10.1161/01.cir.0000030189.27175.4e.
- 10.
Kodama T, Kondo T, Oida A, Fujimoto S, Narula J. Computed tomographic angiography-verified plaque characteristics and slow-flow phenomenon during percutaneous coronary intervention. JACC Cardiovasc Interv 2012; 5: 636–643, doi:10.1016/j.jcin.2012.02.016.
- 11.
Endo M, Hibi K, Shimizu T, Komura N, Kusama I, Otsuka F, et al. Impact of ultrasound attenuation and plaque rupture as detected by intravascular ultrasound on the incidence of no-reflow phenomenon after percutaneous coronary intervention in ST-segment elevation myocardial infarction. JACC Cardiovasc Interv 2010; 3: 540–549, doi:10.1016/j.jcin.2010.01.015.
- 12.
Ozaki Y, Taniguchi M, Katayama Y, Satogami K, Ino Y, Tanaka A. Which is more useful for predicting no-reflow phenomenon?: Insights from optical coherence tomography and coronary computed tomography. Cardiovasc Interv Ther 2023; 38: 246–247, doi:10.1007/s12928-022-00897-5.
- 13.
Sato T, Aizawa Y, Suzuki N, Taya Y, Yuasa S, Kishi S, et al. The utility of total lipid core burden index/maximal lipid core burden index ratio within the culprit plaque to predict filter-no reflow: Insight from near-infrared spectroscopy with intravascular ultrasound. J Thromb Thrombolysis 2018; 46: 203–210, doi:10.1007/s11239-018-1697-z.
- 14.
Ando H, Yamaji K, Kohsaka S, Ishii H, Wada H, Yamada S, et al. Japanese Nationwide PCI (J-PCI) Registry Annual Report 2019: Patient demographics and in-hospital outcomes. Cardiovasc Interv Ther 2022; 37: 243–247, doi:10.1007/s12928-021-00832-0.
- 15.
Kozuma K, Otsuka M, Ikari Y, Uehara Y, Yokoi H, Sano K, et al. Clinical and angiographic outcomes of paclitaxel-eluting coronary stent implantation in hemodialysis patients: A prospective multicenter registry: The OUCH-TL study (outcome in hemodialysis of TAXUS Liberte). J Cardiol 2015; 66: 502–508, doi:10.1016/j.jjcc.2015.03.008.
- 16.
Natsuaki M, Sonoda S, Yoshioka G, Hongo H, Kaneko T, Kashiyama K, et al. Antiplatelet therapy after percutaneous coronary intervention: Current status and future perspectives. Cardiovasc Interv Ther 2022; 37: 255–263, doi:10.1007/s12928-022-00847-1.
- 17.
Suzuki N, Nishide S, Kimura T, Aoyagi T, Kanamori K, Shiratori Y, et al. Relationship of quantitative flow ratio after second-generation drug-eluting stent implantation to clinical outcomes. Heart Vessels 2020; 35: 743–749, doi:10.1007/s00380-019-01545-4.
- 18.
Omori H, Ota H, Mizukami T, Kawase Y, Tanigaki T, Hirata T, et al. How do coronary lipid-rich plaques change after cessation of proprotein convertase subtilisin/kexin type 9 inhibitors?: Serial assessment using near-infrared spectroscopy. Circ J 2021; 85: 1404, doi:10.1253/circj.CJ-21-0211.
- 19.
Zanchin C, Ueki Y, Losdat S, Fahrni G, Daemen J, Ondracek AS, et al. In vivo relationship between near-infrared spectroscopy-detected lipid-rich plaques and morphological plaque characteristics by optical coherence tomography and intravascular ultrasound: A multimodality intravascular imaging study. Eur Heart J Cardiovasc Imaging 2021; 22: 824–834, doi:10.1093/ehjci/jez318.
- 20.
Ozaki Y, Hara H, Onuma Y, Katagiri Y, Amano T, Kobayashi Y, et al. CVIT expert consensus document on primary percutaneous coronary intervention (PCI) for acute myocardial infarction (AMI) update 2022. Cardiovasc Interv Ther 2022; 37: 1–34, doi:10.1007/s12928-021-00829-9.
- 21.
Isshiki T, Kozuma K, Kyono H, Suzuki N, Yokoyama N, Yamamoto Y. Initial clinical experience with distal embolic protection using “Filtrap”, a novel filter device with a self-expandable spiral basket in patients undergoing percutaneous coronary intervention. Cardiovasc Interv Ther 2011; 26: 12–17, doi:10.1007/s12928-010-0027-y.
- 22.
Watanabe Y, Sakakura K, Taniguchi Y, Yamamoto K, Seguchi M, Tsukui T, et al. Long-term outcomes of the modest stent expansion strategy for the culprit lesion of acute myocardial infarction. Cardiovasc Interv Ther 2022; 37: 660–669, doi:10.1007/s12928-022-00841-7.
- 23.
Terada K, Kubo T, Madder RD, Ino Y, Takahata M, Shimamura K, et al. Near-infrared spectroscopy to predict microvascular obstruction after primary percutaneous coronary intervention. EuroIntervention 2021; 17: e999–e1006, doi:10.4244/EIJ-D-20-01421.
- 24.
Hibi K, Kozuma K, Sonoda S, Endo T, Tanaka H, Kyono H, et al. A randomized study of distal filter protection versus conventional treatment during percutaneous coronary intervention in patients with attenuated plaque identified by intravascular ultrasound. JACC Cardiovasc Interv 2018; 11: 1545–1555, doi:10.1016/j.jcin.2018.03.021.
- 25.
Hibi K, Kozuma K, Maejima N, Sonoda S, Endo T, Tanaka H, et al. Long-term clinical outcomes after filter protection during percutaneous coronary intervention in patients with attenuated plaque: 1-year follow up of the VAMPIRE 3 (Vacuum Aspiration Thrombus Reemoval 3) trial. Circ J 2020; 85: 44–49, doi:10.1253/circj.CJ-20-0449.
- 26.
Suzuki N. Title: how accurately can machine learning technology for quantitative imaging analysis represent actual coronary artery data? Int J Cardiovas Imag 2022; 38: 1441–1442, doi:10.1007/s10554-022-02575-2.
- 27.
Takarada S, Imanishi T, Ishibashi K, Tanimoto T, Komukai K, Ino Y, et al. The effect of lipid and inflammatory profiles on the morphological changes of lipid-rich plaques in patients with non-ST-segment elevated acute coronary syndrome: Follow-up study by optical coherence tomography and intravascular ultrasound. JACC Cardiovasc Interv 2010; 3: 766–772, doi:10.1016/j.jcin.2010.05.001.
- 28.
Gamou T, Sakata K, Matsubara T, Yasuda T, Miwa K, Inoue M, et al. Impact of thin-cap fibroatheroma on predicting deteriorated coronary flow during interventional procedures in acute as well as stable coronary syndromes: Insights from optical coherence tomography analysis. Heart Vessels 2015; 30: 719–727, doi:10.1007/s00380-014-0542-3.
- 29.
Kubo T, Akasaka T. Benefit of distal protection during percutaneous coronary intervention in properly selected patients. JACC Cardiovasc Interv 2018; 11: 1556–1558, doi:10.1016/j.jcin.2018.04.033.