Abstract
Background: Few studies have compared the Barthel Index (BI) score and postoperative outcomes of transcatheter aortic valve replacement (TAVR) and surgical aortic valve replacement (SAVR). We aimed to examine the relationship between the BI score and postoperative outcomes in patients who underwent TAVR and SAVR.
Methods and Results: The study included patients who underwent SAVR between January 2014 and December 2022 (n=293) and patients who underwent TAVR between January 2016 and December 2022 (n=312). We examined the risk factors for long-term mortality in the 2 groups. The mean (±SD) preoperative BI score was 88.7±18.0 in the TAVR group and 95.8±12.3 in the SAVR group. The home discharge rate was significantly lower in the SAVR than TAVR group. The BI score at discharge was significantly higher in the SAVR than in TAVR group (86.2 vs. 80.2; P<0.001). Significant risk factors for long-term mortality in the TAVR group were sex (P<0.001) and preoperative hemoglobin level (P=0.008), whereas those in the SAVR group were preoperative albumin level (P=0.04) and postoperative BI score (P=0.02). The cut-off point of the postoperative BI score determined by receiver operating characteristic curve analysis was 60.0.
Conclusions: The BI score at discharge was a significant risk factor for long-term mortality in the SAVR group, with a cut-off value of 60.0.
Japan has one of the highest life expectancy rates worldwide, and the incidence of cardiovascular surgery in the older population is increasing.1 Older patients have decreased physical function after cardiac surgery,2 and postoperative rehabilitation is becoming increasingly important. Early cardiac rehabilitation (CR) after cardiovascular surgery is effective in terms of prognosis, length of hospital stay, and hospitalization costs.3,4 Furthermore, an inability to perform activities of daily living (ADL) at discharge predicts mortality or readmission in older patients with heart disease,5 or after cardiothoracic surgery.6
The Barthel Index (BI) is the global standard index for ADL.7 Several reports have compared the BI as an index of ADL and postoperative outcomes after cardiovascular surgery.6,8,9 However, few reports have discussed the BI score in relation to postoperative outcomes of surgical aortic valve replacement (SAVR) and transcatheter aortic valve replacement (TAVR). Therefore, we aimed to examine the relationship between the BI score and postoperative outcomes following SAVR and TAVR.
Methods
Data Collection
All surgeries and data collection were performed at the Ise Red Cross Hospital, Ise, Japan. Clinical outcome data were obtained from hospital records or the patients’ family doctors.
Ethics Approval
This study was approved by the Institutional Review Board of the Ise Red Cross Hospital (October 5, 2022; Approval no. ER2022-49) and the procedures were in accordance with the Declaration of Helsinki. The need for informed consent was waived due to the retrospective nature of the study. All study activities were performed in accordance with the relevant institutional guidelines and regulations.
Study Design and Patients
This study included 293 patients who underwent SAVR at Ise Red Cross Hospital between January 2014 and December 2022. Ise Red Cross Hospital started performing TAVR procedures in 2016, so we also included 312 patients who underwent TAVR between January 2016 and December 2022 in this study. The cardiology team at Ise Red Cross Hospital, which consisted of cardiothoracic surgeons, cardiologists, radiologists, anesthesiologists, and other related medical professionals, decided between SAVR and TAVR for each patient. Preoperative characteristics, operative data, and postoperative outcomes were compared between the SAVR and TAVR groups. In particular, we investigated changes in the BI score before and after surgery in both groups, as well as the relationship between the BI score and long-term outcomes.
Assessment of ADL
We calculated the BI score as an indicator of ADL. The BI consists of the following 10 items: feeding, transferring from the bed to the chair, grooming, toilet use, bathing, walking on a level surface (ambulation), ascending and descending stairs, dressing, and controlling the bowel and bladder. The BI score ranges from 0 to 100, with lower scores indicating greater disability. The preoperative BI score was evaluated on the basis of an interview with the patient or their family 1 month prior to admission. The postoperative BI score was defined as the BI score determined immediately prior to discharge or transfer.
Operative Technique
SAVR was performed via a median sternotomy using a moderately hypothermic cardiopulmonary bypass. Myocardial protection was performed with cold and warm blood cardioplegia using a combination of the antegrade and retrograde methods. Antithrombotic therapy following SAVR consisted of oral warfarin for 3 months after replacement with biological valves and lifelong oral warfarin after replacement with mechanical valves.
TAVR was performed under general or local anesthesia in a hybrid catheterization laboratory. Antithrombotic therapy following TAVR at Ise Red Cross Hospital consisted of dual antiplatelet agents from 2016 to 2019 and a single antiplatelet agent from 2020 onwards.
Postoperative Rehabilitation
The CR program was based on the Japanese Circulation Society’s early postoperative CR guidelines.10 Rehabilitation was started on the day after surgery and was continued until the day before discharge or transfer. The standard program is to start standing and walking on the day after surgery and to achieve independence on Day 4 after surgery. At the time of discharge from Ise Red Cross Hospital, the goal is for patients to be able to walk independently, have expanded ADL, and resume social activities. Many patients indicated for TAVR are very old and frail. Furthermore, post-TAVR patients are often discharged from hospital earlier than those undergoing SAVR, and so do not spend enough time in rehabilitation. We developed case-specific programs based on these considerations.
Statistical Analyses
All statistical analyses were performed using the statistical software EZR (Easy R) in R commander.11 Continuous variables are expressed as the mean±SD and were compared between the 2 groups using Student’s t-test. Categorical variables are expressed as counts and percentages and were compared using Fisher’s exact test. The Kaplan-Meier method using log-rank tests was used to describe the long-term results. A Cox proportional hazards regression model was used to calculate hazard ratios and identify independent risk factors for long-term mortality. Candidate variables were selected based on P<0.05 in univariate analysis and on previous knowledge.5,12–14 Age, sex, albumin and hemoglobin values, preoperative BI score, cardiopulmonary bypass time, BI score at discharge, and discharge to a facility were selected as variables for long-term mortality after SAVR and TAVR. Optimal BI score cut-off values were determined using receiver operating characteristic (ROC) curve analysis to optimize sensitivity and specificity. The final model was evaluated using the area under the ROC curve. Statistical significance was set at two-tailed P<0.05 for all analyses.
Results
Preoperative Characteristics
The preoperative patient characteristics are summarized in Table 1. There were significant differences among the 2 groups in terms of age, sex, body mass index, and body surface area. Serum creatinine concentrations were significantly higher in the SAVR than TAVR group (P<0.001), which may be attributed to the large number of patients undergoing hemodialysis in the SAVR group. Albumin concentrations did not differ significantly between the 2 groups, but hemoglobin concentrations were significantly lower in the TAVR group (P<0.001). In addition, the SAVR group had significantly more cases of aortic valve regurgitation (P<0.001). The Society of Thoracic Surgeons score was significantly lower in the SAVR than TAVR group (3.8 vs. 5.5, respectively; P<0.001). The European System for Cardiac Operative Risk Evaluation score was significantly lower in the TAVR than SAVR group (3.9 vs. 5.2, respectively; P<0.001). The Clinical Frail Scale (CFS) was significantly lower in the SAVR than TAVR group (3.6 vs. 4.4, respectively; P<0.001). The BI score was significantly higher in the SAVR than TAVR group (95.8 vs. 88.7, respectively; P<0.001).
Table 1.
Preoperative Characteristics
| |
TAVR group
(n=312) |
SAVR group
(n=293) |
P value |
| Demographic data |
| Age |
84.8±4.4 |
72.9±8.7 |
<0.001 |
| Female sex |
202 (64.7) |
123 (41.9) |
<0.001 |
| BMI (kg/m2) |
21.8±3.5 |
22.9±3.5 |
<0.001 |
| BSA (m2) |
1.45±0.1 |
1.57±0.1 |
<0.001 |
| Past medical history |
| Hypertension |
235 (75.3) |
265 (90.4) |
<0.001 |
| Diabetes |
84 (26.9) |
96 (32.7) |
0.13 |
| On insulin therapy |
15 (4.8) |
14 (4.7) |
1.0 |
| Malignancy |
59 (18.9) |
56 (19.1) |
1.0 |
| Peripheral vascular disease |
31 (9.9) |
17 (5.8) |
0.07 |
| Cerebral vascular disease |
54 (17.3) |
42 (14.3) |
0.37 |
| Coronary artery disease |
82 (26.2) |
93 (31.7) |
0.15 |
| AF or AFL |
36 (11.5) |
29 (9.8) |
0.6 |
| Laboratory data |
| Serum Cr (mg/dL) |
1.03±0.7 |
1.92±2.5 |
<0.001 |
| Hb (g/dL) |
11.5±1.6 |
12.2±1.9 |
<0.001 |
| Albumin (g/dL) |
3.8±2.3 |
3.7±0.5 |
0.48 |
| Hemodialysis |
1 (0.3) |
40 (13.6) |
<0.001 |
| Echocardiographic variables |
| AV peak velocity (m/s) |
4.6±0.6 |
4.2±0.8 |
<0.001 |
| AV mean PG (mmHg) |
51.1±15.3 |
44.3±18.7 |
<0.001 |
| LVDd (mm) |
47.5±5.3 |
52.5±8.0 |
<0.001 |
| LVDs (mm) |
30.6±6.5 |
34.3±8.1 |
<0.001 |
| LVEF (%) |
64.6±11.0 |
62.8±11.2 |
0.057 |
| LVMI (g/m2) |
156.5±30.6 |
165.7±47.4 |
0.004 |
| LAD (mm) |
43.5±6.2 |
43.5±7.05 |
0.94 |
| AR ≥ mild |
41 (13.1) |
104 (35.4) |
<0.001 |
| MR ≥ mild |
64 (20.5) |
61 (20.8) |
1.0 |
| TR ≥ mild |
33 (10.5) |
29 (9.8) |
0.79 |
| STS score |
5.5±3.2 |
3.8±3.5 |
<0.001 |
| EuroSCORE II |
3.9±2.9 |
5.2±5.4 |
<0.001 |
| Diagnosis of AV |
| AV stenosis |
307 (98.4) |
209 (71.3) |
<0.001 |
| AV regurgitation |
0 |
73 (24.9) |
<0.001 |
| SVD |
5 (1.6) |
11 (3.8) |
0.12 |
| Endocarditis |
0 |
17 (5.8) |
<0.001 |
| CFS |
4.4±1.2 |
3.6±1.1 |
<0.001 |
| BI |
88.7±18.0 |
95.8±12.3 |
<0.001 |
Unless indicated otherwise, data are given as the mean±SD or n (%). AF, atrial fibrilation; AFL, atrial flutter; AR, aortic valve regurgitation; AV, aortic valve; BI, Barthel Index; BMI, body mass index; BSA, body surface area; CFS, Clinical Frail Scale; Cr, creatinine; EuroSCORE, European System for Cardiac Operative Risk Evaluation; Hb, hemoglobin; LAD, left atrial dimension; LVDd, left ventricular end-diastolic diameter; LVDs, left ventricular end-systolic diameter; LVEF, left ventricular ejection fraction; LVMI, left ventricular mass index; MR, mitral valve regurgitation; PG, pressure gradient; SAVR, surgical aortic valve replacement; STS, Society of Thoracic Surgeons; SVD, structural valve deterioration; TAVR, transcatheter aortic valve replacement; TR, tricuspid valve regurgitation.
Intraoperative Outcomes
The intraoperative outcomes are summarized in Table 2. In the TAVR group, 247 (79.2%) patients underwent the procedure under local anesthesia, and the operative time was significantly shorter in the TAVR than SAVR group. More concomitant thoracic aortic procedures were performed in the SAVR group, and most patients in the SAVR group underwent biological prosthetic valve placement.
Table 2.
Intraoperative Outcomes
| |
TAVR group
(n=312) |
SAVR group
(n=293) |
P value |
| Procedural characteristics |
| Anesthesia |
| Local |
247 (79.2) |
0 |
<0.001 |
| General |
65 (20.8) |
293 (100) |
<0.001 |
| Approach |
| Transfemoral |
301 (96.4) |
|
|
| Transaortic |
5 (1.6) |
|
|
| Trans-subclavian |
4 (1.3) |
|
|
| Transapical |
1 (0.3) |
|
|
| Median sternotomy |
1 (0.3) |
293 (100) |
|
| Operation time (min) |
66.4±39.9 |
386.5±113.4 |
<0.001 |
| CPB time (min) |
|
227.8±78.7 |
|
| Concomitant procedures |
| PCI |
2 (0.6) |
|
|
| Endovascular treatment |
2 (0.6) |
|
|
| Ascending replacement |
|
47 (16.0) |
|
| Total arch replacement+FET |
|
2 (0.6) |
|
| Root replacement |
|
3 (1.0) |
|
| CABG |
|
62 (21.1) |
|
| Mitral valve repair |
|
32 (10.9) |
|
| Mitral valve replacement |
|
9 (3.0) |
|
| Tricuspid valve annuloplasty |
|
45 (15.3) |
|
| Left atrial appendage resection |
|
75 (25.5) |
|
| Pulmonary vein ablation |
|
27 (9.2) |
|
| Maze |
|
9 (3.0) |
|
| Transcatheter heart valve type |
| SAPIEN XT |
12 (3.8) |
|
|
| SAPIEN 3 |
199 (63.7) |
|
|
| CoreValve Evolut R |
18 (5.7) |
|
|
| CoreValve Evolut PRO |
37 (11.8) |
|
|
| CoreValve Evolut PRO+ |
46 (14.7) |
|
|
| Prosthetic valve type |
| Biological prosthetic valve |
|
273 (93.2) |
|
| CEP Magna |
|
5 (1.7) |
|
| CEP Magna Ease |
|
124 (42.3) |
|
| INSPIRIS RESILIA |
|
103 (35.1) |
|
| Trifecta |
|
28 (9.5) |
|
| Mitroflow |
|
13 (4.4) |
|
| Mechanical prosthetic valve |
|
20 (6.8) |
|
| SJM Regent |
|
11 (3.7) |
|
| Others |
|
9 (3.0) |
|
Unless indicated otherwise, data are given as the mean±SD or n (%). CABG, coronary artery bypass grafting; CEP, Carpentier Edwards PERIMOUT; CPB, cardiopulmonary bypass; FET, frozen elephant trunk; PCI, percutaneous coronary intervention; SJM, St. Jude Medical. Other abbreviations as in Table 1.
Postoperative Outcomes
The postoperative outcomes are summarized in Table 3. The rate of new pacemaker implantation differed significantly between the TAVR and SAVR groups (7.0% vs. 2.0%, respectively; P=0.003), as did the rate of cerebrovascular events (2.2% vs. 5.8%, respectively; P=0.03). The incidence of postoperative atrial fibrillation was significantly lower in the TAVR than SAVR group (4.4% vs. 34.1%, P<0.001). Both the length of intensive care unit stay (1.0 vs. 3.6 days; P<0.001) and the length of hospital stay (5.9 vs. 20.9 days; P<0.001) were significantly shorter in the TAVR than SAVR group. In-hospital deaths occurred in 1 (0.3%) patient in the TAVR group and in 11 (3.8%) patients in the SAVR group (P=0.002). Furthermore, the home discharge rate was significantly lower in the SAVR than TAVR group (82.9% vs. 91.0%; P=0.003). The CFS at discharge was significantly higher in the TAVR than SAVR group (4.9 vs. 4.4; P<0.001), whereas the BI score at discharge was significantly higher in the SAVR than TAVR group (86.2 vs. 80.2; P<0.001).
Table 3.
Postoperative Outcomes
| |
TAVR group
(n=312) |
SAVR group
(n=293) |
P value |
| Postoperatve complications |
| New pacemaker implantation |
22 (7.0) |
6 (2.0) |
0.003 |
| Cerebrovascular events |
7 (2.2) |
17 (5.8) |
0.03 |
| Delirium |
45 (14.4) |
59 (20.1) |
0.06 |
| POAF |
14 (4.4) |
100 (34.1) |
<0.001 |
| RRT |
0 |
10 (3.4) |
<0.001 |
| ICU length of stay (days) |
1.0±0.4 |
3.6±2.5 |
<0.001 |
| Hospital length of stay (days) |
5.9±4.6 |
20.9±16.7 |
<0.001 |
| Hospital death |
1 (0.3) |
11 (3.8) |
0.002 |
| Discharge to home |
284 (91.0) |
243 (82.9) |
0.003 |
| Echocardiographic variables |
| AV peak velocity (m/s) |
2.3±0.4 |
2.3±0.4 |
0.71 |
| AV mean PG (mmHg) |
11.5±4.34 |
11.7±4.2 |
0.46 |
| LVMI (g/m2) |
154.2±32.2 |
149.6±100.0 |
0.45 |
| PVL ≥ mild |
99 (31.7) |
10 (3.4) |
<0.001 |
| At discharge |
| CFS |
4.9±1.0 |
4.4±1.0 |
<0.001 |
| BI |
80.2±20.1 |
86.2±21.6 |
<0.001 |
Unless indicated otherwise, data are given as the mean±SD or n (%). ICU, intensive care unit; POAF, postoperative atrial fibrilation; PVL, paravalvular leak; RRT, renal replacement therapy. Other abbreviations as in Table 1.
BI Scores in the TAVR and SAVR Groups
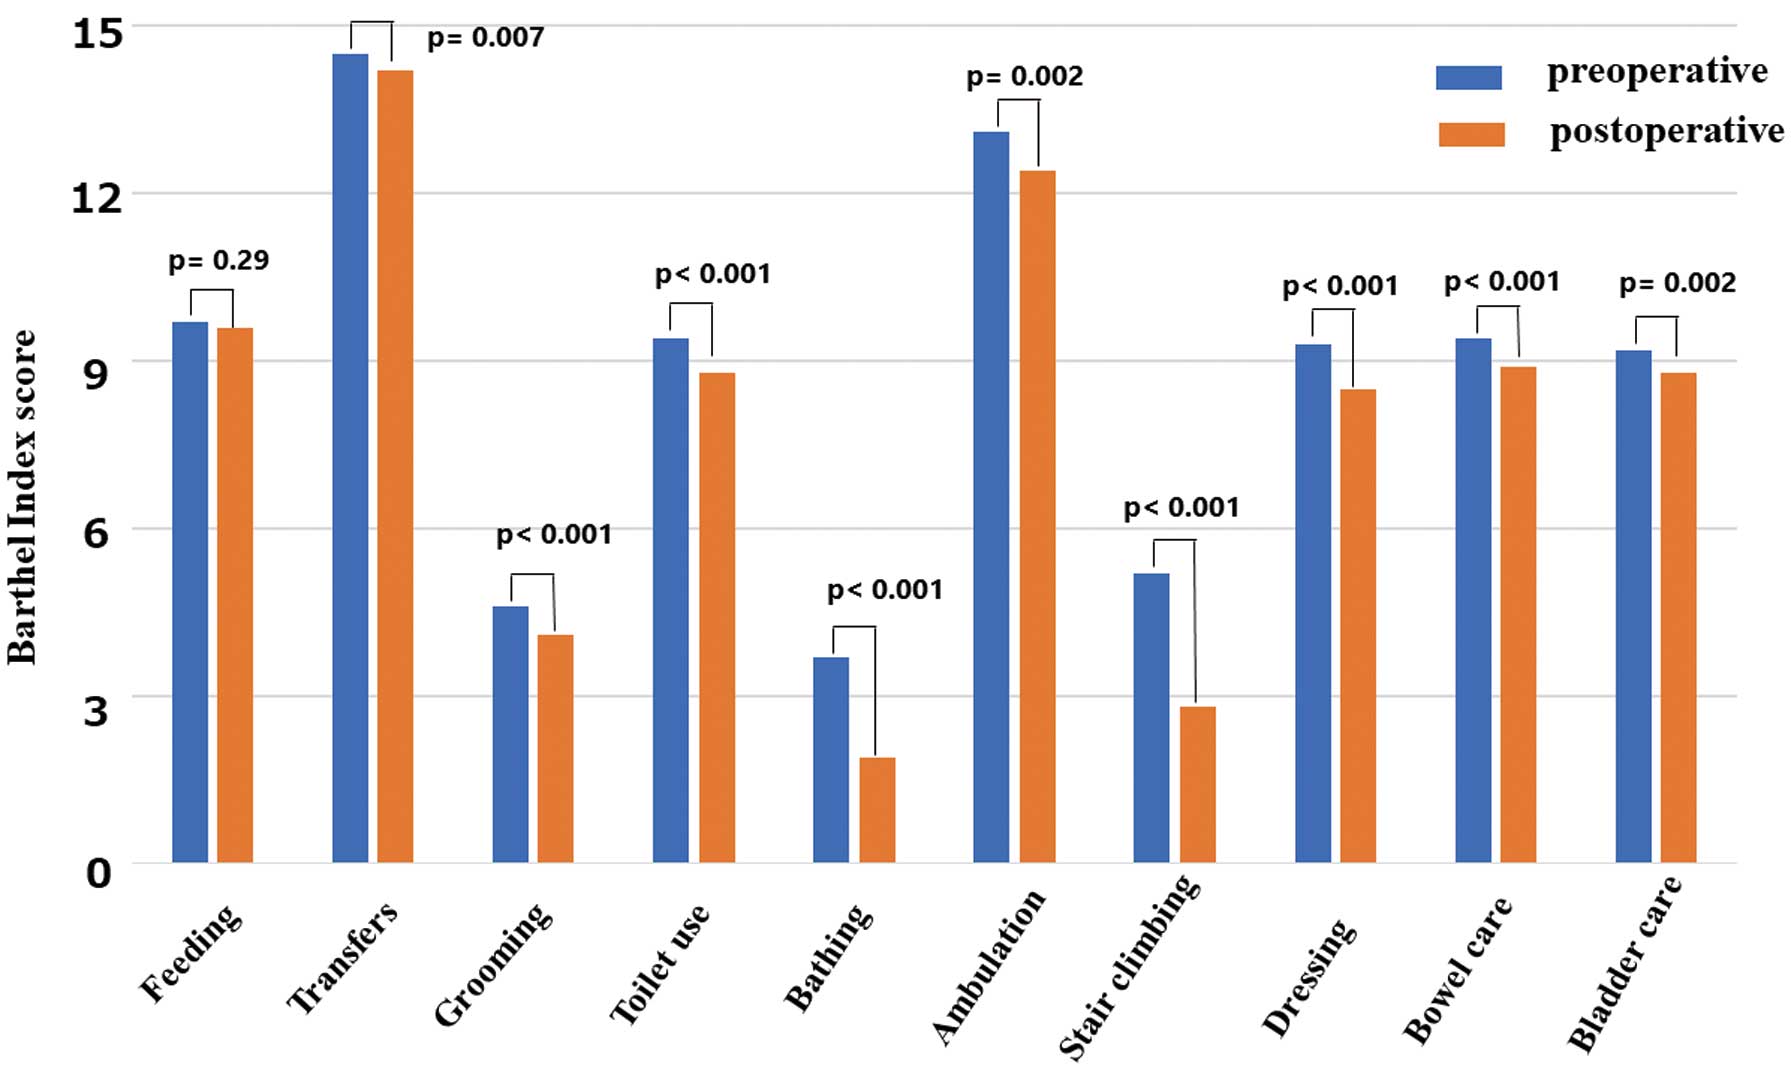
In the TAVR group, preoperative scores for each item in the BI were as follows: feeding, 9.7±1.2; transfers, 14.5±1.7; grooming, 4.6±1.3; toilet use, 9.4±2.0; bathing, 3.7±2.1; ambulation, 13.1±4.3; stair climbing, 5.2±4.5; dressing, 9.3±2.1; bowel control, 9.4±1.9; and bladder control, 9.2±2.1. Postoperative values for each of the BI items were as follows: feeding, 9.6±1.2; transfers, 14.2±2.1; grooming, 4.1±1.9; toilet use, 8.8±2.6; bathing, 1.9±2.4; ambulation, 12.4±4.2; stair climbing, 2.8±4.0; dressing, 8.5±2.8; bowel control, 8.9±2.5; and bladder control, 8.8±2.7.
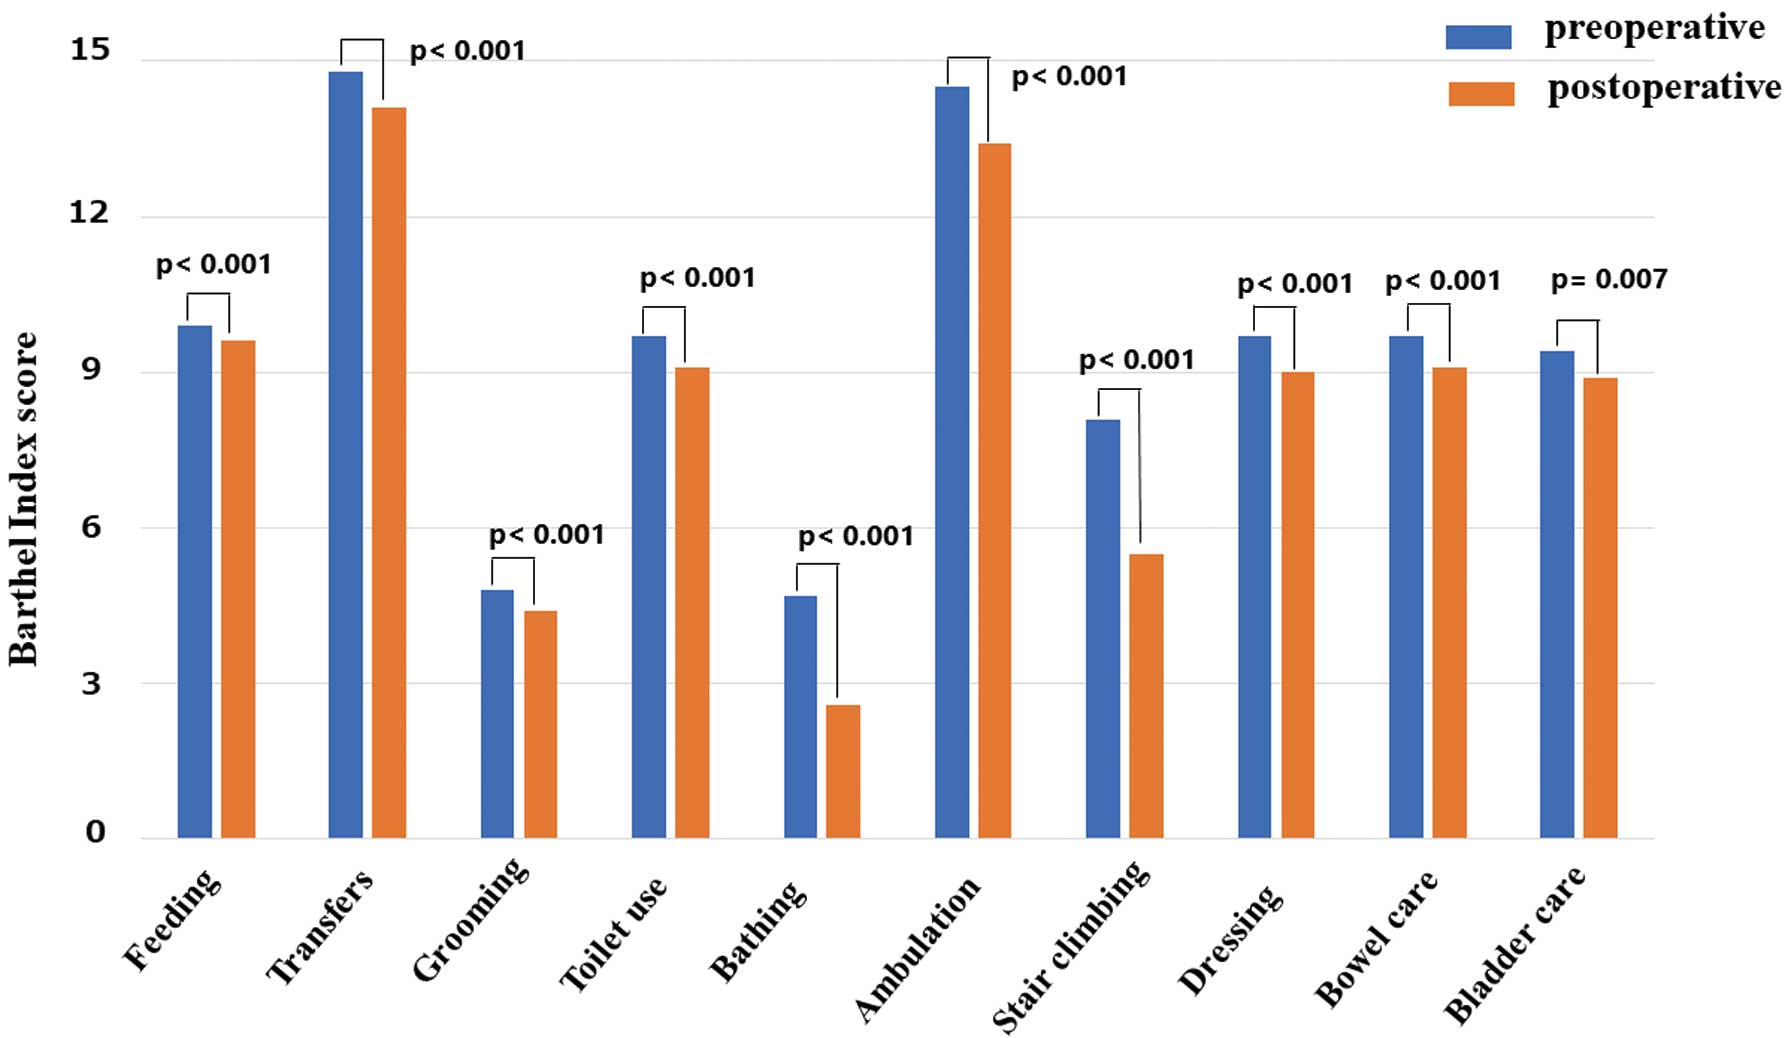
In the SAVR group, preoperative scores for each item in the BI were as follows: feeding, 9.9±0.5; transfers, 14.8±1.2; grooming, 4.8±0.7; toilet use, 9.7±1.4; bathing, 4.7±1.1; ambulation, 14.5±2.0; stair climbing, 8.1±3.5; dressing, 9.7±1.3; bowel control, 9.7±1.5; and bladder control, 9.4±2.1. Post//operative values for each of the BI items were as follows: feeding, 9.6±1.6; transfers, 14.1±2.9; grooming, 4.4±1.5; toilet use, 9.1±2.5; bathing, 2.6±2.5; ambulation, 13.4±3.7; stair climbing, 5.5±4.5; dressing, 9.0±2.6; bowel control, 9.1±2.4; and bladder control, 8.9±2.7.
Preoperative vs. Postoperative BI Scores
When comparing the total BI scores before and after surgery, the total BI score was significantly lower after surgery in both the TAVR group (88.7 vs. 80.2; P<0.001) and in the SAVR group (95.8 vs. 86.2; P<0.001). The preoperative and postoperative BI scores for the 2 groups are shown in Figures 1,2. In the TAVR group, the scores of all items, except feeding, were significantly lower after surgery (Figure 1); in the SAVR group, the scores of all items were significantly lower after surgery (Figure 2).
Long-Term Survival
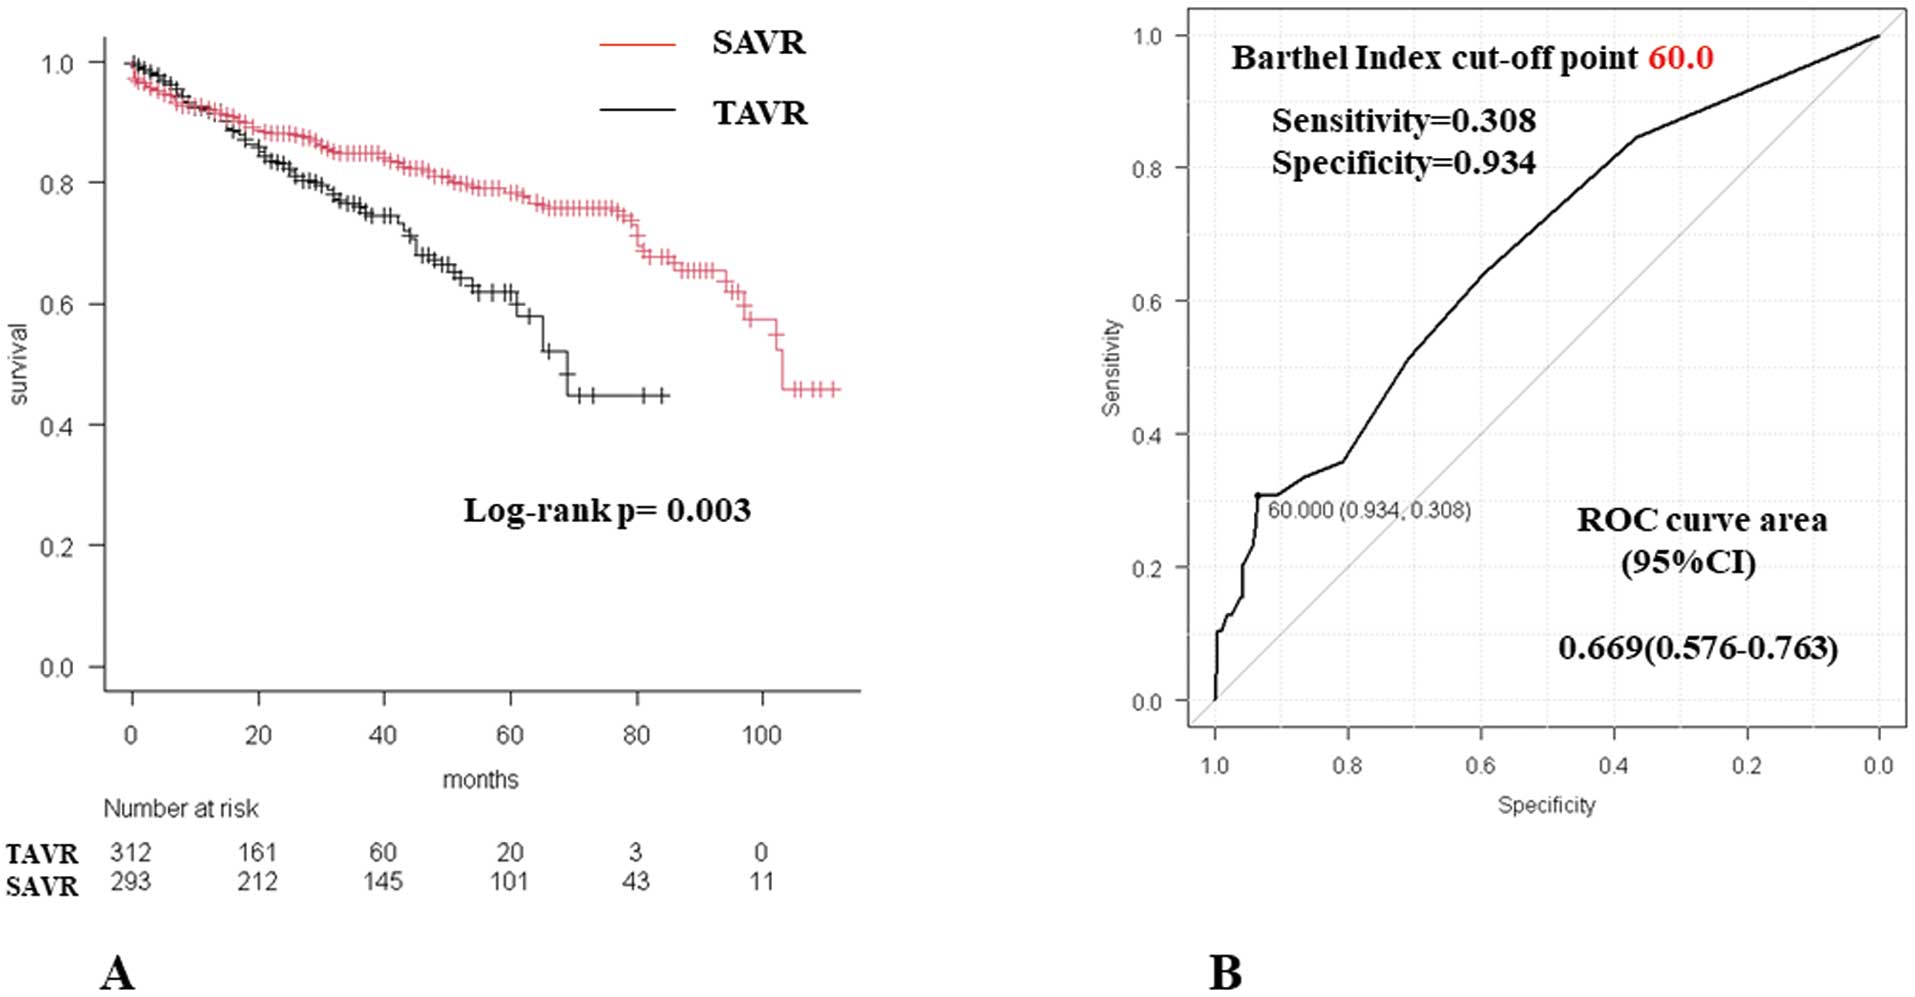
The mean follow-up period was 24.1±18.6 months (median 21 months; minimum-maximum 0.03–84 months) in the TAVR group and 43.9±30.5 months (median 38 months; minimum-maximum 0.1–111 months) in the SAVR group. The 5-year survival rates in the SAVR and TAVR groups were 78.3% and 61.8%, respectively (P=0.003; Figure 3A).
Risk Factors for Long-Term Mortality
Cox proportional hazards regression analysis identified sex (P<0.001) and preoperative hemoglobin level (P=0.008) as significant risk factors for long-term mortality in the TAVR group (Table 4). Preoperative and postoperative BI scores were not significant risk factors. Significant risk factors for long-term mortality in the SAVR group were the preoperative albumin concentration (P=0.04) and postoperative BI score (P=0.02; Table 5). The cut-off point for the postoperative BI score associated with long-term mortality, as determined by the ROC curve, was 60.0 (Figure 3B).
Table 4.
Cox Proportional Hazards Regression Analyses of Long-Term Mortality in the TAVR Group
| Variables |
Univariate analysis |
Multivariate analysis |
| HR |
95% CI |
P value |
HR |
95% CI |
P value |
| Preoperative factors |
| Age |
1.042 |
0.98–1.10 |
0.17 |
|
|
|
| Female sex |
0.521 |
0.31–0.86 |
0.01 |
0.318 |
0.17–0.56 |
<0.001 |
| Serum Cr |
1.036 |
0.78–1.36 |
0.80 |
|
|
|
| Albumin |
0.446 |
0.27–0.72 |
0.001 |
0.695 |
0.38–1.26 |
0.231 |
| Hb |
0.799 |
0.67–0.94 |
0.007 |
0.775 |
0.64–0.93 |
0.008 |
| LVMI |
1.005 |
0.99–1.01 |
0.26 |
|
|
|
| CFS |
1.376 |
1.12–1.68 |
0.002 |
|
|
|
| BI |
0.985 |
0.97–0.99 |
0.03 |
0.997 |
0.97–1.01 |
0.817 |
| EuroSCORE II |
1.023 |
0.94–1.10 |
0.57 |
|
|
|
| Postoperative factors |
| LVMI |
1.005 |
0.99–1.01 |
0.24 |
|
|
|
| New PM implantation |
1.603 |
0.63–4.02 |
0.31 |
|
|
|
| PVL ≥ mild |
0.781 |
0.44–1.38 |
0.39 |
|
|
|
| Delirium |
1.896 |
0.62–3.76 |
0.06 |
|
|
|
| CFS at discharge |
1.191 |
0.93–1.51 |
0.14 |
|
|
|
| BI at discharge |
0.984 |
0.97–0.99 |
0.01 |
0.991 |
0.97–1.00 |
0.313 |
| Discharge not to home |
2.095 |
0.94–4.63 |
0.06 |
1.42 |
0.48–4.21 |
0.519 |
CI, confidence interval; HR, hazard ratio; PM, pacemaker. Other abbreviations as in Tables 1,3.
Table 5.
Cox Proportional Hazards Regression Analyses of Long-Term Mortality in the SAVR Group
| Variables |
Univariate analysis |
Multivariate analysis |
| HR |
95% CI |
P value |
HR |
95% CI |
P value |
| Preoperative factors |
| Age |
1.052 |
1.01–1.08 |
0.002 |
1.032 |
0.98–1.08 |
0.173 |
| Female sex |
0.817 |
0.48–1.37 |
0.44 |
|
|
|
| Serum Cr |
1.145 |
1.06–1.23 |
<0.001 |
|
|
|
| Albumin |
0.395 |
0.27–0.56 |
<0.001 |
0.587 |
0.34–0.98 |
0.045 |
| Hb |
0.779 |
0.67–0.89 |
<0.001 |
|
|
|
| Hemodialysis |
2.983 |
1.67–5.32 |
<0.001 |
|
|
|
| LVMI |
1.000 |
0.99–1.00 |
0.94 |
|
|
|
| CFS |
1.598 |
1.26–2.01 |
<0.001 |
|
|
|
| BI |
0.980 |
0.96–0.99 |
0.003 |
0.997 |
0.97–1.01 |
0.782 |
| EuroSCORE II |
1.064 |
1.03–1.09 |
<0.001 |
|
|
|
| CPB time |
1.004 |
1.002–1.007 |
0.002 |
1.001 |
0.99–1.00 |
0.53 |
| Postoperative factors |
| LVMI |
1.003 |
1.001–1.005 |
<0.001 |
|
|
|
| New PM implantation |
0.685 |
0.09–5.00 |
0.70 |
|
|
|
| PVL ≥ mild |
1.308 |
0.40–4.22 |
0.65 |
|
|
|
| CVA |
1.88 |
0.74–4.73 |
0.17 |
|
|
|
| Delirium |
2.23 |
1.18–4.24 |
0.01 |
|
|
|
| CFS at discharge |
1.941 |
1.48–2.53 |
<0.001 |
|
|
|
| BI at discharge |
0.969 |
0.95–0.97 |
<0.001 |
0.972 |
0.94–0.99 |
0.028 |
| Discharge not to home |
3.471 |
1.78–6.74 |
<0.001 |
0.64 |
0.13–3.21 |
0.595 |
CVA, cerebrovascular accident. Other abbreviations as in Tables 1–4.
Discussion
In our study, the BI score at discharge was a significant risk factor for long-term mortality in the SAVR group, with a cut-off value of 60.0. This indicated that a BI score <60.0 at discharge was associated with a poor prognosis in the SAVR group. In contrast, preoperative and postoperative BI scores were not significant risk factors for long-term prognosis in the TAVR group.
Sato et al6 reported that a BI score <85 at discharge was a predictor of all-cause mortality and unplanned readmission in older patients undergoing cardiac or aortic surgery. Uemura et al5 reported that a BI score <60 at discharge and a decreased BI score during hospitalization were predictors of poor outcomes in patients with acute heart failure. Higuchi et al15 reported that the BI score at discharge may be a useful predictor of 1-year mortality in older patients undergoing percutaneous coronary intervention for acute coronary syndrome. Garhy et al9 reported that a preoperative BI score of <80 was associated with increased mortality and risk of neurological events and cardiac decompensation after TAVR. In addition, previous studies have reported that the BI score is correlated with prognosis in cardiac and aortic diseases.6,15 However, few studies have investigated the correlation between the BI score and prognosis following TAVR and SAVR. To the best of our knowledge, this is the first study to specifically calculate cut-off values for the BI score using ROC curves.
In this study, the BI score was significantly lower postoperatively than preoperatively in the TAVR and SAVR groups. However, the BI score at discharge was the only significant long-term risk factor for poor prognosis in the SAVR group. Preoperative and postoperative BI scores in the TAVR group and the preoperative BI score in the SAVR group were not significant risk factors for poor long-term prognosis (Tables 4,5). In this study, for patients who died within 2 years in the SAVR group, the preoperative and discharge BI scores were 93.2±19.1 and 61.6±39.2, respectively. For patients who died within 2 years in the TAVR group, the preoperative and discharge BI scores were 85.2±18.8 and 72.8±21.2, respectively. Postoperative decline in ADL is more evident after SAVR than TAVR, because SAVR is more invasive than TAVR. In some cases, patients may become bedridden or develop disuse syndrome.6 They can easily develop decubitus ulcers and infections, including pneumonia and urinary tract infections.15 In the present study, the 1-year survival rates in the SAVR and TAVR groups were 91.9% and 91.6%, respectively; the 2-year survival rates were 88.2% and 83.1%, respectively. The cause of death within 2 years after surgery in the SAVR group was malignancy in 3 (10.7%) patients, heart failure in 7 (25.0%), infectious disease in 8 (28.5%), unknown in 7 (25.0%), and “other” in 3 (10.7%). The cause of death within 2 years after surgery in the TAVR group was malignancy in 10 (25.6%) patients, heart failure in 6 (15.3%), infectious disease in 10 (25.6%), stroke in 3 (7.6%), senility in 3 (7.6%), unknown in 2 (5.1%), and “other” in 5 (12.8%). Although the cause of short-term postoperative deaths in the present study was not clear, the improvement in postoperative ADL may take longer in patients after SAVR than TAVR. The decline in ADL (decrease in the BI score) during hospitalization may have an impact on mortality, but this needs to be verified in the future.
Based on the results of this study, a BI score ≥60 at discharge should be targeted after SAVR. Early rehabilitation after cardiovascular surgery contributes to reductions in mortality and medical costs.4,8,16 Moreover, Han et al8 concluded that early rehabilitation leads to a better BI score at discharge; thus, early rehabilitation is important to increase the BI score postoperatively. We prepare rehabilitation plans for each patient before surgery, sharing information about patients’ conditions with a physical therapist, so that we can provide a comprehensive postoperative rehabilitation program. Thus, improvement in ADL (increase in the BI score) can be expected, even in the period shortly after the operation. However, some older patients may experience a decline in ADL and require prolonged hospitalization or rehabilitative transfers, even in the absence of major postoperative complications.
The BI score increases with more time spent in postoperative rehabilitation, resulting in longer hospital stays and higher hospitalization costs. Ideally, patients should be discharged home with a BI score ≥60; however, this is not always possible. In some cases, patients are transferred to a long-term care facility for rehabilitation because of a decline in ADL after surgery. In the present study, 13 (4.2%) patients in the TAVR group and 34 (11.6%) patients in the SAVR group were transferred to a long-term care hospital for postoperative rehabilitation (P<0.001). In such cases, a close collaboration between social workers and receiving institutions is necessary. In the case of patients who are discharged home despite impaired ADL, family support and close cooperation with physicians are critical. Outpatient rehabilitation after hospital discharge is also important, but the participation rates in outpatient CR services are low.17
Ideally, ADL should be improved in SAVR patients with a target BI score ≥60 at discharge; however, this is not always feasible. The decision regarding discharge to home or transfer to a long-term care hospital for rehabilitation should be based on improvement in ADL and taking into consideration hospitalization costs. This requires collaboration among cardiovascular surgeons and other multidisciplinary professionals, including nurses, pharmacists, nutritionists, physical therapists, social workers, and family physicians.
Study Limitations
This study had some limitations. First, this was a retrospective single-center study. Second, because Ise Red Cross Hospital only started performing TAVR procedures in 2016, there may have been a bias in that patients in the SAVR group from 2014 to 2015 were not considered for TAVR. Third, some may argue that the use of the CFS is more appropriate to assess postoperative ADL, because several studies have reported its use.18 We adopted the more objective BI score to assess ADL because the CFS may be subjective to the observer. Fourth, the follow-up period was shorter in the TAVR than SAVR group because TAVR was only initiated at Ise Red Cross Hospital in 2016. More cases need to be included in future studies to confirm the validity of our findings.
Conclusions
The BI score at discharge was a significant risk factor for long-term mortality in the SAVR group, with a cut-off value of 60.0. Preoperative and postoperative BI scores in the TAVR group and the preoperative BI score in the SAVR group were not significant long-term prognostic risk factors.
Sources of Funding
This study did not receive any funding.
Disclosures
The authors declare that there are no conflicts of interest.
IRB Information
This study was approved by the Institutional Review Board of Ise Red Cross Hospital (October 5, 2022; Approval no. ER2022-49).
Data Availability
The deidentified participant data will not be shared.
References
- 1.
Abe T, Nakano K, Hirahara N, Motomura N, Miyata H, Takamoto S. Current status of cardiovascular surgery in Japan, 2015 and 2016, a report based on the Japan cardiovascular surgery database: 3-Valvular heart surgery. Gen Thorac Cardiovasc Surg 2019; 67: 742–749.
- 2.
Itagaki A, Saitoh M, Okamura D, Kawamura T, Otsuka S, Tahara M, et al. Factors related to physical functioning decline after cardiac surgery in older patients: A multicenter retrospective study. J Cardiol 2019; 74: 279–283.
- 3.
Sezai A, Shimokawa T, Kanaoka K, Fukuma N, Sekino H, Shiraishi H, et al. Efficacy of early cardiac rehabilitation after cardiac surgery: Verification using Japanese diagnosis procedure combination data. Circ Rep 2022; 4: 505–516.
- 4.
Ohbe H, Nakamura K, Uda K, Matsui H, Yasunaga H. Effect of early rehabilitation on physical function in patients undergoing coronary artery bypass grafting: A nationwide inpatient database study. J Clin Med 2021; 10: 618–627.
- 5.
Uemura Y, Shibata R, Takemoto K, Koyasu M, Ishikawa S, Murohara T, et al. Prognostic impact of the preservation of activities of daily living on post-discharge outcomes in patients with acute heart failure. Circ J 2018; 82: 2793–2799.
- 6.
Sato M, Mutai H, Yamamoto S, Tsukakoshi D, Takeda S, Oguchi N, et al. Decreased activities of daily living at discharge predict mortality and readmission in elderly patients after cardiac and aortic surgery. Medicine 2021; 100: 31–38.
- 7.
Mahoney FI, Barthel DW. Functional evaluation: The Barthel Index. Md State Med J 1965; 14: 61–65.
- 8.
Han P, Yu H, Xie F, Li M, Chen X, Yu X, et al. Effects of early rehabilitation on functional outcomes in patients after coronary artery bypass graft surgery: A randomized controlled trial. J Int Med Res 2022; 50: 3000605221087031, doi:10.1177/03000605221087031.
- 9.
Garhy MEI, Owais T, Abdulrahman M, Schreiber T, Schulze C, Lauer B, et al. Functional impairment assessed by the Barthel Index influenced outcomes after transcatheter aortic valve implantation. Scand Cardiovasc J 2020; 54: 54–58.
- 10.
Makita S, Yasu T, Akashi YJ, Adachi H, Izawa H, Ishihara S, et al. JCS/JACR 2021 guideline on rehabilitation in patients with cardiovascular disease. Circ J 2023; 87: 155–235.
- 11.
Kanda Y. Investigation of the freely available easy-to-use software ‘EZR’ for medical statistics. Bone Marrow Transpl 2013; 48: 452–458.
- 12.
Muto Y, Higuchi R, Yoshihisa A, Hagiya K, Saji M, Takamisawa I, et al. Prevalence, predictors, and mid-term outcomes of non-home discharge after transcatheter aortic valve replacement. Circ Rep 2020; 2: 617–624.
- 13.
Saji M, Higuchi R, Tobaru T, Iguchi N, Takanashi S, Takayama M, et al. Impact of frailty markers for unplanned hospital readmission following transcatheter aortic valve implantation. Circ J 2018; 82: 2191–2198.
- 14.
Shimura T, Yamamoto M, Kano S, Kagase A, Kodama A, Koyama Y, et al. Impact of frailty markers on outcomes after transcatheter aortic valve replacement: Insights from a Japanese multicenter registry. Ann Cardiothorac Surg 2017; 6: 532–537.
- 15.
Higuchi S, Kabeya Y, Matsushita K, Taguchi H, Ishiguro H, Kohshoh H, et al. Barthel Index as a predictor of 1-year mortality in very elderly patients who underwent percutaneous coronary intervention for acute coronary syndrome: Better activities of daily living, longer life. Clin Cardiol 2016; 39: 83–89.
- 16.
Ribeiro GS, Melo RD, Deresz LF, Lago PD, Pontes MRN, Karsten M. Cardiac rehabilitation programme after transcatheter aortic valve implantation versus surgical aortic valve replacement: Systematic review and meta-analysis. Eur J Prev Cardiol 2017; 24: 688–697.
- 17.
Kanaoka K, Iwanaga Y, Fukuma N, Nakai M, Sumita Y, Nishioka Y, et al. Trend and factors associated with cardiac rehabilitation participation. Circ J 2022; 86: 1998–2007.
- 18.
Shimura T, Yamamoto M, Kano S, Kagase A, Kodama A, Koyama Y, et al. Impact of the clinical frailty scale on outcomes after transcatheter aortic valve replacement. Circulation 2017; 135: 2013–2024.