Abstract
Background: Atrial tachyarrhythmias (ATAs) are reportedly associated with ventricular arrhythmias (VAs). However, little is known about the association between ATA duration and the risk of VA. We investigated the relationship between ATA duration and subsequent VA in patients with a cardiac resynchronization therapy defibrillator (CRT-D).
Methods and Results: We investigated associations between the longest ATA duration during the first year after cardiac resynchronization therapy (CRT) implantation and VA and VA relevant to ATA (VAATA) in 160 CRT-D patients. ATAs occurred in 63 patients in the first year. During a median follow-up of 925 days from 1 year after CRT implantation, 40 patients experienced 483 VAs. Kaplan-Meier analysis showed a significantly higher risk of VA in patients with than without ATA in the first year (log rank P=0.0057). Hazard ratios (HR) of VA (HR 2.36, 2.10, and 3.04 for ATA >30s, >6 min and >24 h, respectively) and only VAATA (HR 4.50, 5.59, and 11.79 for ATA >30s, >6 min and >24 h, respectively) increased according to the duration of ATA. In multivariate analysis, ATA >24 h was an independent predictor of subsequent VA (HR 2.42; P=0.02).
Conclusions: Patients with ATA >24 h in the first year after CRT had a higher risk of subsequent VA and VAATA. The risk of VA, including VAATA, increased with the longest ATA duration.
Sudden cardiac death from lethal ventricular arrhythmia (VA) is common in patients with systolic heart failure (HF).1 Transient atrial tachyarrhythmia (ATA) including atrial fibrillation (AF) was reported to be associated with recurrent VAs in patients with left ventricular (LV) dysfunction and an implantable cardioverter defibrillator (ICD).2 Permanent AF was associated with a risk of subsequent VA3 and appropriate device shocks.4 In addition, new-onset ATA including AF was related to any ICD shock in patients with ICD.5 Thus, any type of AF was reported to be associated with VAs.
ATA deteriorates biventricular pacing rates and could aggravate HF symptoms in patients with cardiac resynchronization therapy (CRT). CRT patients with transient AF attacks also had a higher risk of appropriate and inappropriate shocks.6 Although ATA including AF is associated with VAs in patients with LV dysfunction and ICD/CRT devices, the association between ATA duration and subsequent VA remains uncertain. Some mechanisms, such as the induction of short-long-short sequences7 or reduced ventricular refractoriness,8 have been postulated. Although a temporal connection between ATAs and VAs was a marker of increased risk of VA recurrence,9 little is known about the relationship between ATA duration, the risk of VAs, and the incidence of VA relevant to ATA (VAATA).
The purpose of this study was to investigate the clinical significance of transient ATA attacks for the occurrence of VA and to assess the relationship between the longest ATA duration and subsequent VA, including VAATA, in CRT patients.
Methods
Study Population
Among our cohort of 320 CRT patients, we excluded those with a CRT pacemaker, permanent AF, and a lack of follow-up data 1 year after implantation, as well as those undergoing hemodialysis and who died during the first year after implantation (Supplementary Figure 1). Thus, the present study included 160 patients with congestive HF (New York Heart Association [NYHA] functional class II, III, or IV) despite medical therapy and who received a CRT defibrillator (CRT-D) between 2012 and 2019. Inclusion criteria were based on JCS/JHRS guideline,10 and most patients had a QRS width ≥120 ms and an LV ejection fraction (LVEF) ≤35%. Patients were hemodynamically stable and received a CRT-D as an elective procedure.
This study was approved by the Institutional Research Board of the National Cerebral and Cardiovascular Center, Suita, Japan (M26-150-10) and was conducted in accordance with the Declaration of Helsinki.
Clinical data at baseline were collected from all patients and included: age; gender; underlying heart disease; medical history, including diabetes, chronic kidney disease (CKD), and ATA; medication; echocardiographic parameters; and 12-lead electrocardiogram (ECG) data. Diabetes was defined according to the American Diabetes Association guidelines,11 and CKD was defined according to the Kidney Disease: Improving Global Outcomes (KDIGO) guidelines.12
CRT Implantation and Programming
A CRT-D was implanted transvenously using standard procedures after obtaining written informed consent from all patients. A right ventricular (RV) lead was positioned at the RV septal apex, and an LV lead was then implanted in a suitable branch of the coronary vein at a site that produced an acceptable pacing threshold without diaphragmatic pacing. The veins from the lateral wall, which are defined as LV myocardial segments by the European Heart Rhythm Association/Heart Rhythm Society expert consensus,13 were the first choice for the LV lead position at the discretion of the implanting physician without guidance by RV-LV timing. Atrioventricular delay was optimized using Doppler echocardiography to provide the maximum LV filling time without interference from the atrial wave and diastolic mitral regurgitation; interventricular delay was then adjusted based on the pulsed-wave LV outflow tract velocity.
This study included 99 (62%) patients with a CRT device capable of atrial antitachycardia pacing (ATP), and ATP was programmed in 74 patients (46%).
Detection of ATA and VAs
We analyzed the data of continuous monitoring using an ATA detection algorithm via implantable devices and confirmed true ATA episodes.14 An ATA episode was defined as a high-rate atrial episode (≥180 beats/min) that lasted for at least 30 s.15 We evaluated the longest ATA duration during the first year after CRT implantation and classified patients according to the longest ATA duration into 2 groups: (1) ATA(−) group, patients without ATAs; and (2) ATA(+) group, patients with ATAs (30 s<ATA≤6 min; 6 min<ATA≤24 h; and ATA >24 h).
VAs were evaluated by an intracardiac electrogram (EGM), which included pre-episode, detection, and post-therapy sections with 3-channel signals from the atrial, RV, and LV electrodes, or the RV far-field signal. VA was defined as lasting >30 s or treated by CRT-D including both ATP and shock. We distinguished between VAs and supraventricular tachyarrhythmias based on morphology of the tachycardia compared with the baseline rhythm and tachycardia onset and stability, the atrial and ventricular cycle length, and atrioventricular decoupling.
Each arrhythmic episode was obtained from ICD follow-up charts including remote telemetry and in-person evaluation, hospital records, and outpatient evaluation during the follow-up period. VA episodes were not counted during the first year after CRT implantation.
Definition of VA Relevant to ATA
We categorized VAs into 2 groups based on the relationship between ATAs and VAs, VAATA, and VA unrelated to ATA (non-VAATA). VAATA was defined as a VA that was preceded by an ATA attack within 24 h before the VA occurred; non-VAATA was defined as a VA that was not preceded by an ATA within 24 h before the VA episode. VAATA included VA within 24 h from the onset of ATA (VAATA Type 1), VA after more than 24 h from the onset of ATA (VAATA Type 2), and VA within 24 h after the termination of ATA (VAATA Type 3; Supplementary Figure 2).
Follow-up
Patients were followed-up at our hospital (National Cerebral and Cardiovascular Center), and follow-up information was obtained from CRT-D follow-up charts, hospital records, and outpatient evaluation.
Statistical Analysis
The results are summarized as the mean±SD or as the median and interquartile range (IQR) for continuous data, as appropriate. Categorical data are expressed as counts and percentages. For categorical variables, the significance of differences between groups was evaluated using the χ2
test or Fisher’s exact test, as appropriate. Continuous variables were compared using the Wilcoxon rank-sum test or the Kruskal-Wallis test. Survival curves were determined by the Kaplan-Meier method and analyzed using the log-rank test. Kaplan-Meier analysis was used to assess the relationship between longest ATA duration and subsequent VA occurrence 1 year after CRT implantation. The effects of covariates on the time to endpoint were investigated using a Cox proportional hazards model. P<0.05 was set as the threshold for statistical significance. All analyses were performed using JMP 14 software (SAS Institute Inc., Cary, NC, USA).
Results
Baseline Clinical Characteristics
Baseline characteristics for the 160 study subjects during the first year after CRT implantation are presented in Table 1. At the time of CRT implantation, the mean age of the patients was 63±13 years, and 122 (76%) patients were male. Forty-four (28%) patients with ischemic heart disease were included in the study. The mean LVEF was 25.4±11.5% and the mean QRS duration was 158±33 ms. Sixty-six (41%) patients had a history of ATAs.
Table 1.
Clinical Characteristics of Patients With and Without ATA During the First Year After CRT Implantation
| |
All
(n=160) |
ATA(+)
(n=63) |
ATA(−)
(n=97) |
P value |
| Age (years) |
63±13 |
63±13 |
64±13 |
0.59 |
| Male sex |
122 (76) |
48 (76) |
74 (76) |
0.99 |
| Secondary prevention |
37 (23) |
13 (21) |
24 (25) |
0.55 |
| Medical history |
| ICM/NICM |
44 (28)/116 (72) |
20 (32)/43 (68) |
24 (25)/73 (75) |
0.33 |
| Diabetes |
49 (31) |
21 (33) |
28 (29) |
0.55 |
| CKD |
64 (40) |
23 (37) |
41 (42) |
0.47 |
| History of ATA |
66 (41) |
40 (63) |
26 (27) |
<0.01 |
| NYHA Class II/III/IV |
59 (37)/54 (34)/47 (29) |
25 (40)/25 (40)/13 (20) |
34 (35)/29 (30)/34 (35) |
0.13 |
| Medication |
| β-blockers |
137 (86) |
53 (84) |
84 (87) |
0.66 |
| Amiodarone |
64 (40) |
23 (37) |
41 (42) |
0.47 |
| Sotalol |
8 (5) |
2 (3) |
6 (6) |
0.38 |
| LVEF (%) |
25.4±11.5 |
26.6±12.2 |
24.7±11.1 |
0.32 |
| LVESV (mL) |
173±92 |
162±102 |
174±85 |
0.88 |
| QRS morphology |
| LBBB |
44 (28) |
12 (19) |
32 (33) |
0.05 |
| RBBB |
32 (20) |
18 (29) |
14 (14) |
0.03 |
| IVCD |
59 (37) |
24 (38) |
35 (36) |
0.80 |
| RV pacing |
25 (16) |
9 (14) |
16 (16) |
0.71 |
| QRS duration (ms) |
158±33 |
157±39 |
158±29 |
0.80 |
| Paced QRS duration (ms) |
160±21 |
166±18 |
156±23 |
<0.01 |
| First-degree AVB |
54 (34) |
21 (33) |
33 (34) |
0.93 |
Unless indicated otherwise, data are given as the mean±SD or n (%). ATA, atrial tachyarrhythmia; AVB, atrioventricular block; CKD, chronic kidney disease; CRT, cardiac resynchronization therapy; ICM, ischemic cardiomyopathy; IVCD, intraventricular conduction disturbance; LBBB, left bundle branch block; LVEF, left ventricular ejection fraction; LVESV, left ventricular end systolic volume; NICM, non-ischemic cardiomyopathy; NYHA, New York Heart Association; RBBB, right bundle branch block; RV, right ventricular.
ATAs in the First Year and Subsequent VAs
Sixty-three (39%) patients had ATAs in the first year after CRT implantation (ATA(+) group). A history of ATA and complete right bundle branch block on the baseline 12-lead ECG were significantly more prevalent in the ATA(+) group than in ATA(−) group (i.e., patients without ATAs within the first year; n=105; P<0.01 and P=0.03, respectively). Paced QRS was longer for patients with than without ATA (166±18 vs. 156±23 ms; P<0.01). The prevalence of patients with QRS narrowing after CRT implantation was lower among patients with than without ATA (20 [33%] vs. 51 [52%]; P=0.02). There were 21 (13%), 19 (12%), and 22 (14%) patients with the longest ATA duration 30s<ATA≤6 min, 6 min<ATA≤24 h, and >24 h, respectively.
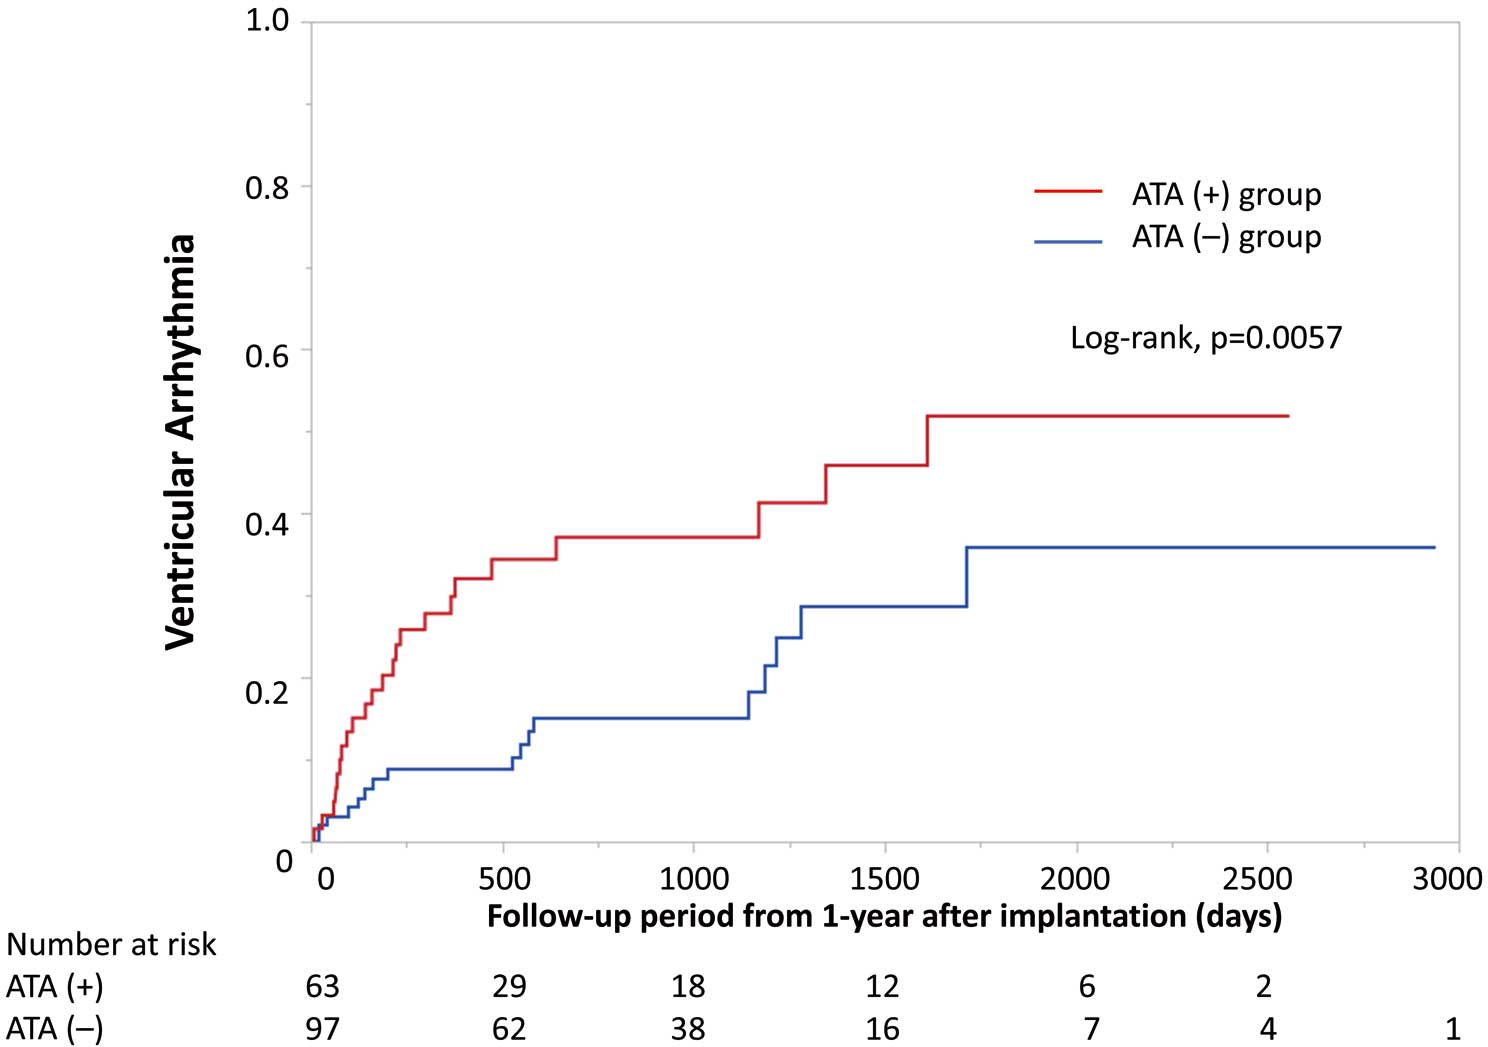
During a median follow-up of 925 days after the first year after CRT-D implantation (IQR 587–1,530 days), there were 483 VA episodes in 40 patients, with 23 (33%) patients in the ATA(+) and 17 (16%) patients in the ATA(−) group experiencing VA (P=0.011). The median VA tachy cycle length was 175 beats/min (IQR 158–212 beats/min), and 30 episodes were terminated by ATP, 8 were terminated by shock, and 2 were self-terminated due to monitor zone. In one case, the VT cycle length was 160 beats/min, and the VT was sustained for 1 min and 30 s. In this patient, VT induced syncope, and then the VT self-terminated. In another case, the patient had slow VT (cycle length 136 beats/min) and the VT was sustained for 16 min and 57 s, and the patient only experienced palpitations. A Kaplan-Meier analysis indicated that there was a significantly higher risk of VA in the ATA(+) than ATA(−) group (log rank P=0.0057; Figure 1).
Frequency of VAATA and Non-VAATA
Among 483 VA episodes, 152 (31%) VA episodes were classified as VAATA. Eight (20%) of 40 patients with VA experienced at least 1 VAATA episode. In the ATA(+) group with VA (n=23), 143 (55%) VA episodes were classified as VAATA and occurred in 6 patients, whereas in the ATA(−) group with VA (n=17) only 9 (4%) VA episodes were classified as VAATA and occurred in 2 patients (Figure 2). With regard to VAATA episodes, the incidence of VAATA episodes was higher in the ATA(+) group than in the ATA(−) group (Figure 2A).
Relationship Between the Longest ATA Duration and VA
The prevalence of VA, VAATA, and non-VAATA according to the longest ATA duration for each is shown in Figure 3. The prevalence of VAATA increased according to the longest ATA duration: 2 (2%) in the ATA(−) group; 6 (10%) in the 30 s<ATA≤24 h group; and 5 (23%) in the ATA >24 h group (P<0.01). However, the prevalence of non-VAATA did not increase with the longest ATA duration: 15 (15%) in the ATA(−) group; 12 (29%) in the 30 s<ATA≤24 h group; and 5 (23%) in the ATA >24 group (P=0.18). The hazard ratios (HRs) for the prevalence of VAATA (ATA>30 s: HR 4.50, P=0.066, ATA>6 min: HR 5.59, P=0.040, ATA>24 h: HR 11.79, P=0.003) and VA (ATA>30 s: HR 2.36, P=0.007, ATA>6 min: HR 2.10, P=0.040, ATA>24 h: HR 3.04, P=0.006) also increased according to the longest ATA duration compared with the ATA(−) group (Figure 4).
Longest ATA Duration >24 h and VA Risk
During the first year after CRT implantation, 22 (14%) patients had episodes of the longest ATA duration >24 h, and 138 (86%) patients had no ATA episodes (ATA(−) group; n=97) or a longest ATA duration ≤24 h (n=41). There were no significant differences in the baseline characteristics between patients with and without a longest ATA duration >24 h, except for the distribution of ATA history (P<0.01), NYHA class (P=0.02), and the prevalence of left bundle branch block (P<0.01; Table 2). During the follow-up period, patients with a longest ATA >24 h had a significantly higher incidence of VAATA (5/22 [23%] vs. 3/138 [2%]; P<0.01) and VA (10/22 [45%] vs. 30/138 [22%]; P=0.024) compared with those without ATAs >24 h. Kaplan-Meier analysis indicated that there was a significantly higher risk of VA in patients with ATA than in those without ATA in the first year (log rank P=0.022; Figure 5). Univariate and multivariate analysis showed that ATA >24 h was an independent predictor of subsequent VAs (HR 2.42; 95% confidence interval 1.16–5.07; P=0.02; Table 3).
Table 2.
Clinical Characteristics of Patients With the Longest ATA Duration >24 h Compared With Those Without ATAs >24 h (ATAs(−) or ATAs ≤24 h) During the First Year After CRT Implantation
| |
ATAs >24 h
(n=22) |
ATAs(−) or ATAs ≤24 h
(n=138) |
P value |
| Age (years) |
67.2±12.4 |
62.7±13.0 |
0.13 |
| Male sex |
18 (82) |
104 (75) |
0.50 |
| Secondary prevention |
6 (27) |
31 (22) |
0.62 |
| Medical history |
| ICM/NICM |
9 (41)/13 (59) |
35 (25)/103 (75) |
0.14 |
| Diabetes |
7 (32) |
42 (30) |
0.90 |
| CKD |
9 (41) |
55 (40) |
0.93 |
| History of ATA |
19 (86) |
47 (34) |
<0.01 |
| NYHA Class II/III/IV |
4 (18)/13 (59)/5 (23) |
55 (40)/41 (30)/42 (30) |
0.02 |
| Medication |
| β-blockers |
20 (91) |
117 (85) |
0.42 |
| Amiodarone |
10 (45) |
54 (39) |
0.58 |
| Sotalol |
0 (0) |
8 (6) |
0.12 |
| LVEF (%) |
28.5±15.3 |
25.0±10.8 |
0.18 |
| LVESV (mL) |
180±98 |
172±91 |
0.73 |
| QRS morphology |
| LBBB |
1 (5) |
43 (31) |
<0.01 |
| RBBB |
5 (23) |
27 (20) |
0.73 |
| IVCD |
11 (50) |
48 (35) |
0.18 |
| RV pacing |
5 (23) |
20 (14) |
0.34 |
| QRS duration (ms) |
163±47 |
157±31 |
0.43 |
| First-degree AVB |
9 (41) |
45 (33) |
0.45 |
Unless indicated otherwise, data are given as the mean±SD or n (%). Abbreviations as in Table 1.

Table 3.
Univariate and Multivariate Analysis to Predict Ventricular Arrhythmias
| |
Univariate analysis |
Multivariate analysis |
| HR |
95% CI |
P value |
HR |
95% CI |
P value |
| Age |
0.99 |
0.96–1.01 |
0.28 |
|
|
|
| Male sex |
2.42 |
1.01–5.78 |
0.05 |
1.66 |
0.68–4.06 |
0.27 |
| ICM |
1.77 |
0.94–3.35 |
0.08 |
|
|
|
| Diabetes |
1.31 |
0.69–2.48 |
0.42 |
|
|
|
| CKD |
0.93 |
0.49–1.76 |
0.81 |
|
|
|
| Secondary prevention |
2.47 |
1.30–4.69 |
<0.01 |
2.82 |
1.47–5.43 |
<0.01 |
| NYHA Class III or IV |
1.85 |
0.90–3.79 |
0.09 |
|
|
|
| History of ATA |
1.43 |
0.77–2.66 |
0.26 |
|
|
|
| β-blocker |
1.55 |
0.55–4.35 |
0.41 |
|
|
|
| Amiodarone |
1.79 |
0.96–3.36 |
0.07 |
|
|
|
| Sotalol |
2.62 |
0.93–7.40 |
0.07 |
|
|
|
| LVEF (per 1% increase) |
0.97 |
0.94–0.99 |
0.04 |
0.96 |
0.93–0.99 |
0.02 |
| LBBB |
0.38 |
0.16–0.91 |
0.03 |
0.40 |
0.16–0.98 |
0.04 |
| QRS duration (per 1-ms increase) |
0.99 |
0.98–1.00 |
0.28 |
|
|
|
| First-degree AVB |
1.58 |
0.84–2.99 |
0.15 |
|
|
|
ATAs >24 h during the first year after
CRT implantation |
2.26 |
1.11–4.64 |
0.03 |
2.42 |
1.16–5.07 |
0.02 |
CI, confidence interval; HR, hazard ratio. Other abbreviations as in Table 1.
Discussion
Main Findings
The main findings of the present study are that: (1) patients with ATA in the first year after CRT implantation had a higher risk of VA events; (2) VAATA and VA risks increased according to the longest ATA duration; and (3) a longest ATA duration >24 h in the first year after a CRT-D implantation was an independent predictor of subsequent VAs.
Possible Mechanisms of VAATA
There are possible direct or indirect mechanisms by which VA is induced by ATA. As a direct mechanism, several electrophysiological explanations have been proposed, such as a rapid ventricular rate and a short-long-short sequence. Roy et al performed an electrophysiological study that showed that an ATA facilitated the initiation of VA.16 Suzuki et al reported that paroxysmal AF was a potential cause of VA with myocardial ischemia in hypertrophic cardiomyopathy.17 Thus, VAs are reported to be caused more easily by uncontrolled AV conduction of ATAs, which leads to rapid ventricular activation in structural heart disease. In addition, several studies described that the irregular rhythm of ATAs including AF leads to a short-long-short sequence that may be an intrinsically proarrhythmic mechanism of VAs.7,18,19 In ICD recipients with ATAs, the underlying electrophysiological mechanism of ventricular electrical instability was associated with a higher vulnerability that predisposed patients to VAs.7
However, neurohormonal changes, mechanoelectrical coupling,20 increased sympathetic tone,21 ischemia, and HF exacerbation have been proposed as indirect mechanisms of ATA-induced VAs. Atrial arrhythmia decreases cardiac output through shortening of the diastolic filling time, loss of atrial function, and an irregular rhythm. This hemodynamic impairment of ATAs may also cause a reflex increase in sympathetic tone and a decrease in parasympathetic tone, which favors the development of VAs. ATAs cause a loss of atrial systole and AV synchrony, inadequate biventricular capture, and a reduction of biventricular pacing percentage in patients with CRT.6 Nakajima et al showed that transient ATA attacks were directly associated with worsening of HF in CRT patients with a lower biventricular pacing percentage during temporal ATAs. HF that is induced by ATAs with a reflex increase in sympathetic tone may cause VAs within a short duration. In the present study, patients with a longer ATA had a higher prevalence of subsequent VAATA and VA. Paced QRS was longer, and the prevalence of patients with QRS narrowing after CRT implantation was lower among patients with than without ATA. QRS narrowing is reported to be associated with favorable outcomes,22,23 including a decreased risk of VAs. Therefore, VA and ATA are simply the results of a wide paced QRS. Whereas in the present study we evaluated the chronological and direct relationship between ATAs and VAs, and defined VAATA based on them (Supplementary Figure 2). Some patients showed VA at the time of only ATA attacks. Moreover, the incidence of VAATA became larger according to the duration of ATA, which indicated that the ATA attack itself, especially with a long duration (≥24 h), as well as a wide paced QRS, induced VA.
Association Between ATA Duration and VAs
Longer episodes of subclinical AF were associated with a higher risk of stroke24 and a higher burden of atrial high-rate episodes (AHRE) was related to worsening HF.25 However, little is known about the association between AF duration and VA. Borleffs et al showed that patients with permanent AF had a more than double risk of VAs that triggered a device discharge compared to patients without AF.4 In addition, permanent AF was an independent predictor of VAs in predominantly secondary prophylactic ICD patients.3 Stein et al showed that the next VA episode was significantly delayed when ATA was terminated based on the assessment of dual tachycardia episodes.26 Thus, persistence and a longer AF duration could increase the risk of VA. In the present study, the prevalence and HRs of VAATA and VA increased according to the ATA duration, and patients with ATA >24 h had a higher risk of subsequent overall VAs. Vergara et al indicated that even a short ATA duration induced VAATA.9 Some patients had a higher risk of subsequent VA even if the ATA duration was short, which seems to be the opposite of the findings of the present study. In fact, there were some patients with Type 1 VAATA (Supplementary Figure 2); other patients only experienced VA events only after long ATA episode (Type 2VAATA). The study by Vergara et al included only so-called VAATA, the definition of which was entirely different to that used in the present study. In addition, our study reported the relationship between the longest ATA duration and the risk of VA, including both VAATA and non-VAATA, and more than half the ATA episodes were unrelated to VA in our study (Figure 2). Because both a short ATA duration and a long ATA duration can induce VA, the underlying mechanisms and physiology are likely to be different. Thus, a higher burden and long duration of ATAs can cause subsequent VA. The present study evaluated the longest ATA duration instead of the AHRE burden because the AHRE burden depends on the evaluation period, which means that the AHRE burden becomes smaller as the observation period increases even though the longest AHRE duration does not change. In addition, because there are a certain number of VAATA following a long ATA (Type 2: 81/167 [48%] episodes), we used ATA duration instead of the AHRE burden although some VAATA occurred following a short ATA. We believe that the longest ATA duration is more valuable than the AHRE burden in the clinical setting to predict the risk of VAs.
Clinical Implications
Our results indicated that the longer ATA duration was frequently associated with VA occurrence, which means that shortening the long duration of ATA could be a requirement for management of VAs in patients with ATA. Catheter ablation, such as pulmonary vein isolation,15 could be suitable for the control of ATA episodes leading to VAs. The Catheter Ablation versus Standard Conventional Therapy in Patients with Left Ventricular Dysfunction and Atrial Fibrillation (CASTLE-AF) trial15 showed that catheter ablation reduced the burden of AF, and 63% of patients in the ablation group maintained a sinus rhythm during the 60-month follow-up of patients with severe LV dysfunction and an ICD/CRT-D. It is important to terminate ATAs within a short period because some VAATA episodes may primarily have indirect effects, including HF exacerbation. In the CASTLE-AF trial, catheter ablation was also associated with a significantly lower rate of HF hospitalizations, which may lead to a better effect of suppressing VAs. In addition, Crossley et al reported that the risk of developing ≥7 days of ATAs was significantly lower in CRT patients who used new-generation atrial ATP (A-ATP).27 The use of A-ATP could be an option to shorten AF duration. Patients who experience ATA >24 h during the first year after device implantation should be treated with interventions such as catheter ablation and A-ATP to manage VAs.
Study Limitations
This was a single-center retrospective study, and the main limitation is the relatively small number of patients. However, there have been no other studies that evaluated the direct relationship between ATA duration and VA. Further prospective multicenter studies are warranted to confirm these findings and the effects of interventions, including catheter ablation and A-ATP, on suppressing the incidence of VAs.
Conclusions
In CRT-D patients, those with ATA in the first year after CRT implantation had a higher risk of subsequent VA. The VAATA and VA risk increased depending on the longest ATA duration. CRT-D patients with ATAs >24 h in the first year had a higher risk of VA, and thus rhythm control of ATAs, especially to suppress a long ATA, could be a requirement for treatment to manage subsequent VA.
Sources of Funding
This study was supported by the Intramural Research Fund (25-4-7; to K. Kusano) for Cardiovascular Diseases of the National Cerebral and Cardiovascular Center. N.U., K.I., T. Noda, and K.N. were supported, in part, by JSPS KAKENHI grant 23K15177, 23K15147, 22K08092, and 23K15145 to conduct this study. This study was supported by the National Center Consortium in Implementation Science for Health Equity (N-EQUITY) and funded by the Japan Health Research Promotion Bureau (JH) Research Fund (No. 2019-(1)-4).
Disclosures
N.U. has received honoraria from Medtronic Japan Co., Ltd. for providing lectures. K.I. has received honoraria for teaching lectures from BIOTRONIK Japan and Medtronic Japan Co., Ltd. T. Noda has received honoraria for lectures from Medtronic Japan Co., Ltd. and BIOTRONIK Japan, Inc., and is affiliated with a department endowed by BIOTRONIK Japan. S.N. is affiliated with a department endowed by Japan Medtronic Inc. S.Y. reports grants from Abbott and Boston Scientific, and is affiliated with a department endowed by BIOTRONIK Japan. K. Kusano has received honoraria from BIOTRONIK Japan and Medtronic Japan, and research grants from Medtronic Japan. C.I. and T. Noguchi are Associate Editors of Circulation Journal. S.Y. is a member of the Editorial Board of Circulation Journal.
IRB Information
This study was approved by the Institutional Research Board of the National Cerebral and Cardiovascular Center, Suita, Japan (M26-150-10).
Supplementary Files
Please find supplementary file(s);
https://doi.org/10.1253/circj.CJ-23-0547
References
- 1.
Thijssen J, van Rees JB, Venlet J, Borleffs CJ, Hoke U, Putter H, et al. The mode of death in implantable cardioverter-defibrillator and cardiac resynchronization therapy with defibrillator patients: Results from routine clinical practice. Heart Rhythm 2012; 9: 1605–1612, doi:10.1016/j.hrthm.2012.04.021.
- 2.
Takigawa M, Noda T, Kurita T, Aihara N, Yamada Y, Okamura H, et al. Predictors of electrical storm in patients with idiopathic dilated cardiomyopathy: How to stratify the risk of electrical storm. Circ J 2010; 74: 1822–1829, doi:10.1253/circj.CJ-10-0092.
- 3.
Klein G, Lissel C, Fuchs AC, Gardiwal A, Oswald H, Desousa M, et al. Predictors of VT/VF-occurrence in ICD patients: Results from the PROFIT-Study. Europace 2006; 8: 618–624, doi:10.1093/europace/eul082.
- 4.
Borleffs CJ, van Rees JB, van Welsenes GH, van der Velde ET, van Erven L, Bax JJ, et al. Prognostic importance of atrial fibrillation in implantable cardioverter-defibrillator patients. J Am Coll Cardiol 2010; 55: 879–885, doi:10.1016/j.jacc.2009.09.053.
- 5.
Younis A, Heist EK, McNitt S, Aktas MK, Rosero S, Goldenberg I, et al. Predictors and outcomes of atrial tachyarrhythmia among patients with implantable defibrillators. Heart Rhythm 2020; 17: 553–559, doi:10.1016/j.hrthm.2019.11.024.
- 6.
Nakajima I, Noda T, Kanzaski H, Kamakura T, Wada M, Ishibashi K, et al. Development of heart failure from transient atrial fibrillation attacks in responders to cardiac resynchronization therapy. JACC Clin Electrophysiol 2018; 4: 1227–1234, doi:10.1016/j.jacep.2018.06.010.
- 7.
Gronefeld GC, Mauss O, Li YG, Klingenheben T, Hohnloser SH. Association between atrial fibrillation and appropriate implantable cardioverter defibrillator therapy: Results from a prospective study. J Cardiovasc Electrophysiol 2000; 11: 1208–1214, doi:10.1046/j.1540-8167.2000.01208.x.
- 8.
Somberg JC, Torres V, Keren G, Butler B, Tepper D, Kleinbaum H, et al. Enhancement of myocardial vulnerability by atrial fibrillation. Am J Ther 2004; 11: 33–43, doi:10.1097/00045391-200401000-00009.
- 9.
Vergara P, Solimene F, D’Onofrio A, Pisano EC, Zanotto G, Pignalberi C, et al. Are atrial high-rate episodes associated with increased risk of ventricular arrhythmias and mortality? JACC Clin Electrophysiol 2019; 5: 1197–1208, doi:10.1016/j.jacep.2019.06.018.
- 10.
Nogami A, Kurita T, Abe H, Ando K, Ishikawa T, Imai K, et al. JCS/JHRS 2019 Guideline on non-pharmacotherapy of cardiac arrhythmias. Circ J 2021; 85: 1104–1244, doi:10.1253/circj.CJ-20-0637.
- 11.
American Diabetes Association. Diagnosis and classification of diabetes mellitus. Diabetes Care 2011; 34(Suppl 1): S62–S69, doi:10.2337/dc11-S062.
- 12.
Stevens PE, Levin A, Kidney Disease: Improving Global Outcomes Chronic Kidney Disease Guideline Development Work Group Members. Evaluation and management of chronic kidney disease: Synopsis of the kidney disease: Improving global outcomes 2012 clinical practice guideline. Ann Intern Med 2013; 158: 825–830, doi:10.7326/0003-4819-158-11-201306040-00007.
- 13.
Daubert JC, Saxon L, Adamson PB, Auricchio A, Berger RD, Beshai JF, et al. 2012 EHRA/HRS expert consensus statement on cardiac resynchronization therapy in heart failure: Implant and follow-up recommendations and management. Heart Rhythm 2012; 9: 1524–1576, doi:10.1016/j.hrthm.2012.07.025.
- 14.
Kaufman ES, Israel CW, Nair GM, Armaganijan L, Divakaramenon S, Mairesse GH, et al. Positive predictive value of device-detected atrial high-rate episodes at different rates and durations: An analysis from ASSERT. Heart Rhythm 2012; 9: 1241–1246, doi:10.1016/j.hrthm.2012.03.017.
- 15.
Marrouche NF, Brachmann J, Andresen D, Siebels J, Boersma L, Jordaens L, et al. Catheter ablation for atrial fibrillation with heart failure. N Engl J Med 2018; 378: 417–427, doi:10.1056/NEJMoa1707855.
- 16.
Roy D, Brugada P, Wellens HJ. Atrial tachycardia facilitating initiation of ventricular tachycardia. Pacing Clin Electrophysiol 1983; 6: 47–52, doi:10.1111/j.1540-8159.1983.tb06581.x.
- 17.
Suzuki M, Hirayama T, Marumoto K, Okayama H, Iwata T. Paroxysmal atrial fibrillation as a cause of potentially lethal ventricular arrhythmia with myocardial ischemia in hypertrophic cardiomyopathy: A case report. Angiology 1998; 49: 653–657, doi:10.1177/000331979804900811.
- 18.
Berger MD, Waxman HL, Buxton AE, Marchlinski FE, Josephson ME. Spontaneous compared with induced onset of sustained ventricular tachycardia. Circulation 1988; 78: 885–892, doi:10.1161/01.cir.78.4.885.
- 19.
Cranefield PF, Aronson RS. Torsade de pointes and other pause-induced ventricular tachycardias: The short-long-short sequence and early afterdepolarizations. Pacing Clin Electrophysiol 1988; 11: 670–678, doi:10.1111/j.1540-8159.1988.tb06016.x.
- 20.
Lerman BB. Mechanoelectrical feedback: Maturation of a concept. J Cardiovasc Electrophysiol 1996; 7: 17–19, doi:10.1111/j.1540-8167.1996.tb00456.x.
- 21.
Lown B, Verrier RL. Neural activity and ventricular fibrillation. N Engl J Med 1976; 294: 1165–1170, doi:10.1056/NEJM197605202942107.
- 22.
Lapidot D, Rav-Acha M, Bdolah-Abram T, Farkash R, Glikson M, Hasin T. QRS narrowing following CRT implantation: Predictors, dynamics, and association with improved long-term outcome. J Clin Med 2022; 11: 1279, doi:10.3390/jcm11051279.
- 23.
Jastrzebski M, Baranchuk A, Fijorek K, Kisiel R, Kukla P, Sondej T, et al. Cardiac resynchronization therapy-induced acute shortening of QRS duration predicts long-term mortality only in patients with left bundle branch block. Europace 2019; 21: 281–289, doi:10.1093/europace/euy254.
- 24.
Van Gelder IC, Healey JS, Crijns H, Wang J, Hohnloser SH, Gold MR, et al. Duration of device-detected subclinical atrial fibrillation and occurrence of stroke in ASSERT. Eur Heart J 2017; 38: 1339–1344, doi:10.1093/eurheartj/ehx042
- 25.
Sarkar S, Koehler J, Crossley GH, Tang WH, Abraham WT, Warman EN, et al. Burden of atrial fibrillation and poor rate control detected by continuous monitoring and the risk for heart failure hospitalization. Am Heart J 2012; 164: 616–624, doi:10.1016/j.ahj.2012.06.020.
- 26.
Stein KM, Euler DE, Mehra R, Seidl K, Slotwiner DJ, Mittal S, et al. Do atrial tachyarrhythmias beget ventricular tachyarrhythmias in defibrillator recipients? J Am Coll Cardiol 2002; 40: 335–340, doi:10.1016/s0735-1097(02)01957-5.
- 27.
Crossley GH, Padeletti L, Zweibel S, Hudnall JH, Zhang Y, Boriani G. Reactive atrial-based antitachycardia pacing therapy reduces atrial tachyarrhythmias. Pacing Clin Electrophysiol 2019; 42: 970–979, doi:10.1111/pace.13696.