Low Expression Levels of Sodium Channels in the Right Ventricular Outflow Tract Underly the Genesis of the Characteristic Electrocardiogram Waveform in Brugada Syndrome
論文ID: CJ-24-0814
詳細
論文ID: CJ-24-0814
Background: Despite active research into the pathophysiology of Brugada syndrome (BrS), the mechanisms of the genesis of changes in the characteristic electrocardiogram (ECG) are still controversial.
Methods and Results: Using multiscale computer simulation of ECGs, we compared 3 hypotheses to identify the mechanisms of the BrS-type ECG caused by a mutation in cardiac sodium channels. In addition to the dominant repolarization disorder and depolarization disorder hypotheses, we tested a new hypothesis assuming the combination of a slow conduction property, upregulation of transient outward potassium current channels, and reduced expression levels of sodium channels in the right ventricular outflow tract (embryonic phenotype model). We found that only the embryonic phenotype model reproduced the clinically observed BrS-type ECG by strongly inhibiting sodium current selectively in the right ventricular outflow tract. We also simulated a ventricular wedge experiment and confirmed that strong inhibition of the sodium current was the prerequisite for a change in the ECG.
Conclusions: Strong selective inhibition of the sodium current in the right ventricular outflow tract generates the characteristic BrS-type ECG in the precordial leads without affecting the waveforms in other lead positions. This change can only be achieved using the embryonic phenotype model in which reduced expression levels of sodium channels play an essential role.
In 1992, Brugada and Brugada reported a clinical entity, named “Brugada syndrome”, characterized by right bundle branch block, persistent ST-segment elevation, and sudden cardiac death.1 Patients with Brugada syndrome (BrS) present with a coved- or saddle back-type of ST-T configuration followed by a positive or negative T wave in the right precordial leads of an electrocardiogram (ECG). Importantly, these morphologies are dynamically changed by pharmacologic interventions or the physical conditions.2–4 Understanding the mechanisms of such ECG changes could lead to accurate prediction of the risks of arrhythmia and/or effective treatments. Therefore, researchers have attempted to determine whether an imbalance of the depolarizing and repolarizing currents during phases 0–II of the action potential is responsible for the genesis of the BrS ECG morphology.5
Despite such research, there is controversy regarding the detailed mechanisms of the BrS-type ECG. Antzelevitch et al.6 proposed the repolarization disorder hypothesis based on experimental results using right ventricular (RV) wedge preparations. They hypothesized that pharmacologic or genetic inhibition of the sodium (Na) current (INa) accentuates the phase I notch of the action potential in epicardial tissue where the transient outward potassium current (Ito) is abundant, and this creates a transmural voltage gradient, thus leading to the coved-type ST-segment elevation. If the epicardial action potential duration is prolonged, a negative T wave is observed.7 However, clinical studies have suggested a major role of conduction delay in the pathogenesis of BrS, which is substantiated by the observations of structural abnormalities (fibrosis, myocarditis, and apoptosis) in RV tissue (depolarization disorder hypothesis).8 Although evidence exists to support both hypotheses, Wilde et al. raised the absence of animal models as a limitation to the depolarization hypothesis.9 Indeed, their experimental study using a canine whole-heart preparation demonstrated a typical type-1 ECG in the V1 lead under the administration of an Ito agonist; thus supporting the repolarization hypothesis.10
An alternative approach to studying the pathophysiology of BrS is computer simulation of cardiac electrophysiology, which could replace animal models. Bébarová et al. showed that INa inhibition induced a conduction delay, leading to ST-T elevation and T-wave inversion, but the pseudo-ECG derived from the 1-dimensional tissue model did not accurately represent reality.11 Hoogendijk et al. identified the importance of structural heterogeneity for excitation failure and showed a change in the ECG in a 3-dimensional heart model, but the ECG did not represent the typical BrS pattern.12,13 Overall, to date simulation studies have been successful in visualizing the mechanistic concept but do not provide convincing evidence for either of the opposing hypotheses.
We have developed a multiscale, multi-physics heart simulator in which molecular models of the cardiac excitation–contraction coupling process is implemented in a realistic morphology of the human heart.14,15 Furthermore, bidomain solutions of excitation propagation with the torso model have enabled us to reproduce patient-specific 12-lead ECGs.16,17
In this study, we used this simulator to compare the 12-lead ECGs of models based on the various mechanistic hypotheses of depolarization and repolarization disorders. Furthermore, we modeled the embryonic phenotype of the RV outflow tract (RVOT), which shows low expression levels of Na channels.18 We also investigated the usefulness of whole-heart simulation by comparing it with the simulation of a wedge preparation, which has been used for studying BrS.
The same finite element method models of human ventricles and the torso used in a previous study19 were used in this study with some modifications. Briefly, multidetector computed tomography images of healthy volunteer were reconstructed as a 3D model and subdivided into 142,467,072 (size: 0.2 mm) and 72,339,456 (size: 1.6 mm) voxels for the ventricles and torso, respectively. In the torso model, major organs in the thorax were included (Figure 1A). In the ventricular model, we mapped the fiber orientation using the rule-based method so that the fiber orientation gradually changed from −90° on the endocardial surface to 60° on the epicardial surface of the left ventricular free wall, from −90° to 70° in the interventricular septum, and from −60° to 60° in the right ventricle. We also modeled the conduction system as a 1D network connecting the atrioventricular node to the sites of earliest activation on the endocardial surface.

Description of the models. (A) Finite element model of the heart and torso. Red dots indicate the position of ECG leads. (B). Models of the ventricles showing the region of severe abnormality (red) and the border zone (pink) in the RVOT, with interventions applied to each region in the RVOT and the entire ventricles. The region of severe abnormality is facing the sternum (model 1) or shifted to the right (model 2). (C) Model of the wedge preparation. A portion of the right ventricular wall (pink cube) is immersed in the blood pool. Blue dots represent ECG electrodes. Numbers are in centimeters. RVOT, right ventricular outlet tract.
Electrophysiological Simulation
The details of electrophysiological simulation have been described in our previous studies.14,15,20,21 Briefly, we implemented the human ventricular myocyte model of electrophysiology to the ventricular wall.22 This model formulates 3 types of myocytes with distinct properties, comprising endocardial, midmyocardial, and epicardial cells. These cells were transmurally arranged to reproduce physiological T waves of a surface ECG (from the endocardial side: endocardial cells, 0–20%; midmyocardial cells, 20–65%, and epicardial cells, 65–100%).15 The electrophysiological properties of the conduction system were reproduced by the model of Stewart et al.23 The propagation of excitation was formulated by the bidomain model and solved using the parallel multilevel technique.14 Conductivities of organs used in the simulation are listed in Supplementary Table.
Modeling BrS PathologyMapping studies reported that abnormal substrates in BrS patients were located in the RVOT, but the severe abnormality was found in a focal, limited area.24,25 Accordingly, we defined the region of abnormal substrate as follows. First, we defined the RVOT in accordance with the method reported by Nagase et al.26 to encompass the region below the pulmonary valve and above the anterior border of the tricuspid valve. Next, in the core region occupying approximately 20% of the RVOT area (red region in Figure 1B), we changed the electrophysiological properties on the basis of the 3 hypothetical models to identify which was the most likely mechanism underlying the BrS-type ECG. In the remainder of the RVOT (border zone between abnormal and normal areas, pink region in Figure 1B), the parameters were changed to 40% of those applied to the core (red) region.
The locations of the precordial leads relative to the position of the abnormal substrate in the RVOT greatly affect the diagnosis of BrS.27,28 After identifying the most likely hypothesis, we examined the effect of the location of the core region under those conditions. We created a model in which the region of abnormal substrate in the RVOT was shifted to the right (model 2, Figure 1B, Bottom) and compared the simulated ECG waveforms with those of model 1.
Repolarization Disorder ModelThe repolarization disorder hypothesis relies on the abundance of Ito in the RV epicardium. Di Diego et al. reported an approximately 3-fold larger Ito in RV epicardial tissue than in the left ventricle.29 However, because of the paucity of data for the human myocardium, we increased Ito to 500% of the normal value in the epicardium of the RVOT on the basis of preliminary simulation results, while tissue conductivity was unchanged. Mutation of the Na channels was simulated by varying the conductance of INa between 100% and 50% in the entire ventricular myocardium.
Depolarization Disorder ModelThe major pathophysiological mechanism of the depolarization hypothesis is a conduction delay in the RVOT induced by minor structural abnormalities, such as fibrosis, myocarditis, and decreased connexin expression.9 We modeled this property by decreasing the intracellular conductivity (G) to 30% of the normal value. To construct this model, mutations of the Na channels were introduced as described for the repolarization disorder hypothesis model.
Embryonic Phenotype ModelThe RVOT displays the characteristic electrophysiological property of slow conduction because of its unique embryonic origin.30 The slow conduction property originates from reduced expression levels of Na channels and connexin 43 and, in the mouse model, expression levels of Na channels in the RVOT are approximately 40% of left ventricular tissue.18 Additionally, in human myocardial tissue, transcription levels of Nav1.5 coding the α-subunit of the Na channel are strongly inhibited in the RV epicardium.31 We modeled this property by reducing the density of Na channels in the RVOT to 45% of the normal level. As a result, even a small reduction (e.g., 90% of normal) in Na channel conductance by mutation applied to the entire ventricles decreased the INa to 40.5% (=0.45×0.9×100) of normal in the RVOT.
In all of these hypotheses, we hypothesized that the mutant channel was expressed homogeneously in the entire ventricles.
Simulation of RV Wedge PreparationTo mimic an experiment using the wedge preparation,29 we segmented a portion of the RV free wall of the model (size: 0.5×1.0×1.0 cm). The distribution of endocardial, midmyocardial, and epicardial cells along the depth of the wall and the fiber orientation were identical to those in the RV wall in the ventricular model. This model of a ventricular wedge was immersed in the cubic blood pool (8.0×8.0×8.0 cm). We paced this model from the endocardial surface and recorded the pseudo-ECG using a pair of electrodes placed at 1.34 cm from the endocardial and epicardial surfaces (Figure 1C). Current densities and conductance were adjusted to match the conditions in the repolarization disorder hypothesis model.
ComputationComputation was performed using the Fugaku supercomputer at the RIKEN Center for Computational Science (Armv8.2-A SVE [2.0 GHz], 158,976 nodes). The computational time for a single beat using 2,354 cores was 70 min. All program codes were written inhouse and validated in our previous studies.14,20,21 These codes have been registered as intellectual property at The University of Tokyo and are thus not publicly available.
When INa was downregulated under the conditions of upregulated Ito (500%) and normal conduction velocity in the RVOT, the duration of the QRS complex became longer (173 ms at INa=50%) with a reduction in its amplitude, but the ECG waveforms of the right precordial leads (V1 and V2) never displayed BrS-type waveforms (Figure 2A). To gain insight into the mechanisms involved, we compared epicardial, midmyocardial, and endocardial action potentials in the RVOT under inhibition of INa (Figure 2A). The accentuated phase I notch reported by Fish and Antzelevitch in support of the repolarization disorder hypothesis32 was absent in these action potentials. Furthermore, the 2 action potential waveforms were almost superimposable, which suggested that INa inhibition did not cause a major delay in activation in the thin wall of the RVOT. However, in the long distance covering the entire ventricle, INa inhibition caused severe distortion of ECG waveforms at a high level of inhibition (INa=50%) (Figure 2B).

ECGs from the repolarization disorder model. (A) ECG waveforms of precordial (V1, V2) and limb (I) leads (Left), and action potentials sampled on the endocardial (black), midmyocardial (blue), and epicardial (red) surfaces of the RVOT. (B) 12-lead ECGs under the strongest inhibition of INa (Nav1.5: 100%, G: 100%, Ito: 500%, and INa: 50%). RVOT, right ventricular outlet tract.
Depolarization Disorder Model
With the introduction of a conduction delay in the RVOT (G=30%), characteristic waveforms indicating right bundle branch block appeared, but even with strong inhibition of INa, the BrS-type ECG was not observed (Figure 3A). We tested this condition with and without upregulation of Ito, but no appreciable difference was observed (Figure 3A). A conduction delay across the wall of the RVOT was confirmed by action potential tracings (Figure 3A), but a phase I notch was not observed. Additionally, under these conditions (Nav1.5: 100%, Ito: 500%, INa: 70%), strong inhibition of INa heavily distorted the ECG waveforms (Figure 3B).

ECGs of the depolarization disorder model. (A) ECG waveforms of precordial (V1, V2) and limb (I) leads (Left), and action potentials sampled on the endocardial (black), midmyocardial (blue), and epicardial (red) surfaces of the RVOT. (B) 12-lead ECGs with depolarization disorder and inhibition of INa (Nav1.5: 100%, G: 30%, Ito: 500%, and INa: 70%). RVOT, right ventricular outlet tract.
Embryonic Phenotype Model
The embryonic phenotype model consisted of reduced basal expression levels of Na channels, slow conduction, and epicardial upregulation of Ito in the RVOT. Data on the action potentials of human embryonic cardiomyocytes are unavailable, but a developmental increase in INa has been reported in the mouse embryonic heart.33 A high current density of Ito in human embryonic stem cell-derived cardiomyocytes has also been reported.34 With these considerations, the current modeling of the RVOT effectively reproduced the embryonic phenotype of cardiac tissue. When conduction delay was omitted from these conditions, inhibition of INa caused a right branch block pattern of the ECG with a delay in the propagation of activation across the wall of the RVOT (Figure 4A). These conditions were similar to those of the repolarization disorder model (G=100% and Ito=500%), but the observed changes in the ECG resembled those obtained with the depolarization disorder model. Even if a similar magnitude of INa inhibition was applied to the entire ventricular tissue in the repolarization disorder and embryonic phenotype models, severe attenuation of current only occurred in the RVOT of the latter model in which basal levels of the current were low owing to reduced expression of Na channels. An example of this finding is that when 10% inhibition was applied to the entire ventricle, it resulted in a 59.5% (= [1 − 0.9 × 0.45] × 100%) reduction in INa locally in the RVOT, leading to a severe conduction delay in this region.

ECGs of the embryonic phenotype model without a conduction disorder. (A) ECG waveforms of precordial (V1, V2) and limb (I) leads (Left), and action potentials sampled on the endocardial (black), midmyocardial (blue), and epicardial (red) surfaces of the RVOT. (B) 12-lead ECGs of the embryonic phenotype model without a conduction disorder (Nav1.5: 45%, G: 100%, Ito: 500%, and INa: 75%). RVOT, right ventricular outlet tract.
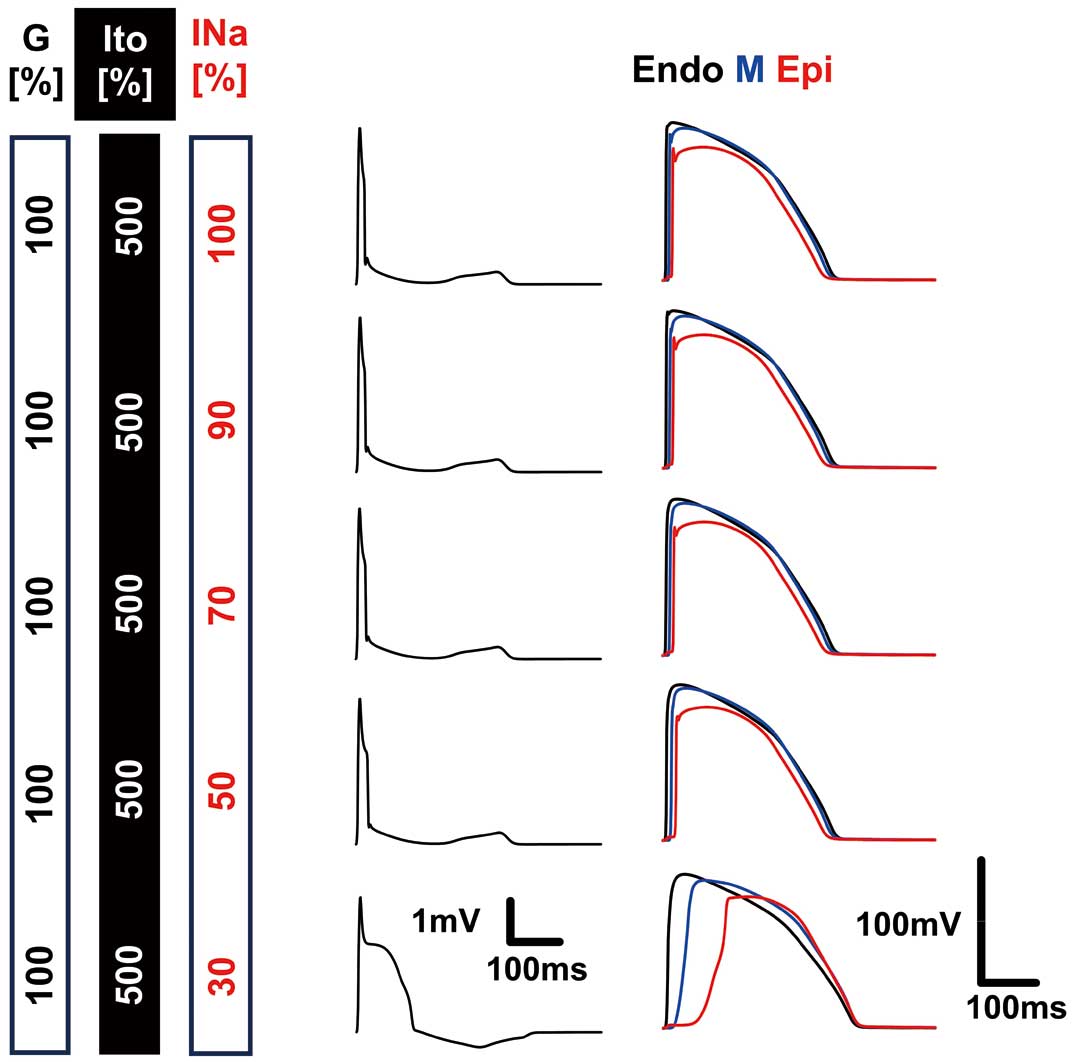
With the additional introduction of a conduction delay to the conditions shown in Figure 4, we successfully reproduced the BrS-type ECG (Figure 5A,B). A long delay in the epicardial action potential peak mimicked the findings in wedge preparations,32 but the first peak was missing in this simulation (Figure 5A). Notably, although typical BrS waveforms appeared in the right precordial leads, waveforms in the other leads were minimally affected in this model, and thus closely reproduced the clinically observed ECG of BrS. Furthermore, we observed a transition from type 2 (saddle back) to type 1 (coved) waveforms in the V1 and V2 leads as INa inhibition was augmented.

ECGs of the embryonic phenotype model. (A) ECG waveforms of precordial (V1, V2) and limb (I) leads (Left), and action potentials sampled on the endocardial (black), midmyocardial (blue), and epicardial (red) surfaces of the RVOT. (B) 12-lead ECGs of the embryonic phenotype model (Nav1.5: 45%, G: 30%, Ito: 500%, and INa: 75%). RVOT, right ventricular outlet tract.
Orientation of the RVOT
We applied the conditions determined in model 1 (Figure 5) to model 2 in which the position of the RVOT was shifted to the right side. A transition from the saddle back-type to the coved-type ST-segment elevation was observed as the inhibition of INa was increased, but the magnitude of ST-segment elevation was more obvious in model 2 (Figure 6). In the 12-lead ECG obtained with 75% INa (Figure 6B), we observed ST-segment depression in the inferior leads as reported previously.35 The relationship between the orientation of the RVOT and the precordial leads is shown in Figure 7, in which the distribution of body surface potentials at the time of peak ST elevation are overlayed. In model 1 (Figure 7A, Supplementary Movie 1) prominent coved-type ST-segment elevation was observed in the sternum to the V2 area of the third intercostal space. In model 2 (Figure 7B, Supplementary Movie 2), the RVOT was facing towards the right, differing from model 1. As a result, the region of high body surface potential that showed a typical BrS-type ECG waveform also shifted to the midline of the body. In both models, coved-type ST-segment elevation was more obvious in the third intercostal space compared with the fourth intercostal space. These observations are consistent with previous simulation and clinical studies.27,28

ECGs of the embryonic phenotype model with a shifted orientation of the RVOT. (A) ECG waveforms of precordial (V1, V2) and limb (I) leads (Left), and action potentials sampled on the endocardial (black), midmyocardial (blue), and epicardial (red) surfaces of the RVOT. (B) 12-lead ECGs of the embryonic phenotype model (Nav1.5: 45%, G: 30%, Ito: 500%, and INa: 75%). RVOT, right ventricular outlet tract.

Effect of RVOT localization on the Brugada-type ECG. The location of the RVOT (red area) relative to the precordial leads in the third and fourth intercostal spaces (green spheres) is viewed from the top (Top left), lateral (Top right), and front (Bottom row) in model 1 (A) and in model 2 (B). In all panels, the body surface potential distribution at the time of peak ST elevation is overlayed. In the bottom row, ECG waveforms recorded at corresponding lead positions are shown. Black arrows indicate the direction perpendicular to the RVOT surface at the center. ICS, intercostal space; RVOT, right ventricular outlet tract.
Simulation of RV Wedge Preparation
As the magnitude of INa inhibition gradually increased under upregulation of Ito, the width of the QRS complex increased with a concomitant decrease in its amplitude. However, the duration of the QRS was much shorter than on clinically observed ECGs. Finally, under strong inhibition of INa (30%), ST-segment elevation and T-wave inversion appeared, which qualitatively resembled an observation by Di Diego et al.29 (Figure 8). A long delay in the epicardial action potential peak was also similar to findings from wedge preparations, but the first peak was missing.
Simulation of the wedge preparation experiment. Pseudo-ECGs (Left) and action potentials recorded on the endocardial (black), midmyocardial (blue), and epicardial (red) surfaces are shown for the condition indicated in the left columns.
In this study, we investigated the mechanisms underlying the genesis of the ECG waveform in BrS by comparing 3 hypotheses. To generate clinically observed BrS-type ECG waveforms, strong inhibition of INa exclusively in the RVOT is required. To achieve such a condition, it is important to understand the unique electrophysiological properties of the RVOT.
Repolarization Disorder HypothesisMyocardial tissue obtained from the canine RV epicardium showed a larger phase I notch of the action potential with an abundance of Ito compared with the left ventricular epicardium.7,29 The accentuation of this notch by INa inhibition forms the basis of the repolarization disorder hypothesis, and this phenomenon can be reproduced in simulations using a model of guinea pig myocyte electrophysiology.11 Based on those observations, we introduced high Ito in the RVOT of our simulation model and modified the INa to test the repolarization disorder hypothesis. The inhibition of INa increased the width of the QRS complex and decreased its amplitude, but the BrS-type waveform was never observed (Figure 2). We found that the prominent phase I notch in the epicardial action potential reported with the canine RV wedge preparation32 was absent in the human myocyte model used in this study (Figure 2A). The model of human ventricular myocytes proposed by ten Tusscher et al.36 showed a prominent phase I notch and the use of that model might have generated different results from those in the current simulation. However, a ECG simulation using the ten Tusscher model failed to show typical waveforms of BrS.13 Furthermore, the epicardial action potentials recorded in the RV tissue obtained from the heart of a sudden cardiac death case of a patient carrying an SCN5A variant did not show a large phase I notch.37
Depolarization Disorder HypothesisThe slow conduction in the RVOT as the basis of the depolarization disorder hypothesis can be caused by fibrosis, decreased tissue conductivity, or low INa density, or a combination of these factors. We modeled such properties by reducing tissue conductivity and examined the effect of a reduction in INa. These interventions introduced the characteristics of right bundle branch block but failed to produce the BrS-type ECG. Hoogendijk et al. proposed a role of current-to-load mismatch in conduction delay,13 but their simulation implementing this property did not produce the typical ECG waveforms of BrS. Taken together, the findings suggest that regional conduction delay alone cannot account for genesis of the BrS-type ECG.
Embryonic Phenotype of the RVOTRVOT tissue possesses heterogenous electrophysiological properties because of its developmental origin.30 Among these, heterogenous expression of Ito channels and connexins, and increased tissue fibrosis have been implicated in the pathogenesis of BrS.38 In this study, we focused on reduced expression of Na channels in the epicardial tissue of the RVOT18,31 for the following reason. As shown in Figures 2,3, the strong inhibition of INa required to obtain BrS-type ECG in the models based on the repolarization and depolarization hypotheses severely distorted the ECG waveforms by widening the QRS complex with a decrease in its amplitude. Although prolongation of the QRS was reported in a study on 117 patients with BrS, the average duration slightly exceeded the normal range, even in the subgroup of patients who suffered from arrhythmic events (124±18 ms).39 Those results suggested that, although the genetic impairment of Na channel function in the entire heart is modest, a strong effect must be exerted selectively in the RVOT to obtain the BrS-type ECG. Such an apparently contradictory condition can be met only if the basal expression levels of the Na channels are downregulated in the RVOT.31 By introducing this condition, we succeeded in reproducing the BrS-type ECG (Figure 5). Most importantly, however, heterogeneous expression of the Na channels only creates the basal condition, and heterogeneity of Ito expression and a conduction delay are also required for the genesis of the BrS-type ECG. Therefore, our results suggest a combination hypothesis for the genesis of the BrS-type ECG. The influence of Nav1.5 expression was further examined and is shown in the Supplementary Materials with Supplementary Figure.
Is the Wedge Preparation an Appropriate Model for the BrS ECG?In our simulation of a wedge experiment, ST elevation with T-wave inversion, which suggested the BrS-type ECG, was observed only under strong inhibition of INa (30% of normal). In an experimental study, Di Diego et al.29 administered 5 µM of terfenadine to an arterially perfused wedge preparation to obtain a similar result to that in the current simulation. The concentration of terfenadine for 50% INa inhibition is reported to be <0.4 µM,21 even if 10% of the compound is active (unbound to protein) in plasma. Therefore, a similarly strong inhibition should be obtained in the experiment. The requirement of strong INa inhibition in experiments and simulations using a wedge preparation raises the question of its suitability for studying BrS pathology, for the following reasons. First, in our ventricular model, propagation of excitation was not possible under such strong inhibition of INa, and ECG waveforms were considerably distorted owing to prolongation of the QRS. However, in the wedge preparation, the QRS width was short, reflecting the small size of the tissue sample. Second, because the majority of genetically diagnosed cases of BrS show an autosomal dominant mode of inheritance with low penetrance,40 occurrence of such strong INa inhibition in affected patients is not expected without underlying low expression levels of SCN5A in the RVOT. Notably, the limited information available from a small tissue specimen may hinder the understanding of the pathophysiological mechanisms. The use of the wedge preparation has been questioned by Opthof et al., who pointed out that the interval between the peak and the end of the T wave measured in wedge preparations only reflects the transmural gradient, and thus does not represent this interval in the in situ heart.41 The same argument can be applied to the simulation result using a simple 1D fiber model.11
Study LimitationsThis study has several limitations. First, we tested only the model described by O’Hara et al.22 Studies using other cell models showing a prominent phase I notch36 might have provided different results. Second, we modeled the function of mutated Na channels by reducing channel conductance. However, some mutations have been reported to alter the kinetics of activation and/or inactivation of channels.42,43 Testing such functional impairments may provide considerable insight into the pathogenesis of BrS. Third, complex patterns of histological abnormalities could promote random reentries. Future modeling studies should address this issue. Finally, we did not evaluate arrhythmogenicity, which is of paramount clinical importance.44 An in silico provocation test can be performed by simulating programmed stimulation, but its optimal protocol and clinical significance for risk stratification are still controversial.45
We compared 3 models to identify the mechanisms of the BrS-type ECG. We found that the embryonic phenotype model, which consists of a slow conduction property, upregulation of Ito channels, and reduced expression levels of Na channels in the RVOT, possessed the most likely conditions for generating BrS-type ECG waveforms. Among these conditions, reduced expression levels of Na channels play a major role in generating these waveforms by introducing strong inhibition of INa exclusively in the RVOT.
This work was partially supported by the MEXT Program for Promoting Research on the Supercomputer Fugaku (hp240211). We thank Ellen Knapp, PhD, from Edanz (https://jp.edanz.com/ac) for editing a draft of this manuscript.
Drs. Okada, Washio, Sugiura, and Hisada received a research grant and stock options from Japan Medical Device Corporation.
The present study was granted an exemption from requiring ethics approval by UT-Heart Inc. because it did not involve human subjects.
Supplementary Movie 1. Heart surface membrane potential and the corresponding body surface potential of the embryonic phenotype model (Nav1.5: 45%, G: 30%, Ito: 500%, and INa: 75%).
Supplementary Movie 2. Heart surface membrane potential and the corresponding body surface potential of the embryonic phenotype model (Nav1.5: 45%, G: 30%, Ito: 500%, and INa: 75%) with a shifted orientation of the RVOT.
Please find supplementary file(s);
https://doi.org/10.1253/circj.CJ-24-0814