Abstract
A conventional nomogram, based on serum creatinine (sCr) and age, was developed in order to determine the correct initial dosage regimen for meropenem (MEPM) infusions in elderly patients with severe community-acquired pneumonia (CAP), using a target minimum inhibitory concentration (MIC) of 2 mg/L. A correlation between age and actual bodyweight (BW) in a development cohort of 44 males and 45 females was performed by linear regression using the least-squares method (male: y=−0.4676x+80.281, R2=0.4888; female: y=−0.4373x+77.502, R2=0.3194). There were no significant differences between actual BW and the BW (e-BW) estimated using this equation in this cohort (male: e-BW 41.6±3.1 kg, BW 41.7±3.5 kg, p=0.93; female: e-BW 39.5±2.1 kg, BW 39.5±3.7 kg, p=0.20). By integrating these equations using the Monte Carlo simulation method, a dosage regime was calculated which would have an 80% probability of maintaining plasma drug levels above the MIC for more than 40% of the time (>40%TAM), using only the age and sCr of individual patients. This relationship was summarized as a nomogram. The nomogram was validated using an independent validation cohort (n=28) of patients. An optimized dosage regimen could be predicted in 84 patients (94.4%) in the development cohort and 25 patients (89.3%) in the validation cohort. This nomogram may be a useful tool for clinicians and pharmacists in determining an initial MEPM regimen in elderly patients with severe CAP, based only on age and sCr.
Meropenem (MEPM) is a carbapenem antibacterial agent with broadspectrum, activity against Gram-negative, Gram-positive and anaerobic bacteria1,2) which is often used to treat serious infections in compromised and elderly patients. As MEPM is eliminated by the kidneys, renal function is a determining factor in its clearance rate. Careful management of the dosage regimen is essential, not only to minimize the development of resistance,3–6) but also to prevent any risk of inadequate antibiotic exposure and minimize adverse effects, particularly in elderly patients in whom cardiac output, renal function and hepatic function are decreased.
The effects of MEPM are time-dependent.7) The percentage of time that plasma drug levels are maintained above the minimum inhibitory concentration (MIC) is known as the %TAM. It has been reported that bacteriostatic action can be achieved at 20–30%TAM, while bactericidal action is achieved at 40–50%TAM.7–9)
Simulation software has been developed to predict an optimized individual dosage regimen based on a patient’s creatinine clearance rate (CCR), which can be obtained using the Cockcroft–Gault formula, using serum creatinine (sCr), actual bodyweight (BW) and age. However, it is often difficult to determine the actual BW of elderly, hospitalized, bedridden patients and a visual approximation by healthcare providers may be used instead. The determination of BW is important in order to ensure that an adequate dose is delivered and to avoid unnecessary adverse effects. Clinically, it would be useful to have a nomogram to calculate the optimum starting dose and/or administration interval of a carbapenem antibiotic on the basis of target levels of %TAM, using only sCr and age.
The aims of the present study were firstly to estimate the correlation between age and actual BW, using a retrospective cohort of patients treated with MEPM, in order to develop an equation for the calculation of CCR on the basis of sCr and age alone. Secondly, to validate the performance of this equation, and lastly to develop and validate a conventional nomogram based on this equation.
Experimental
Subjects and EthicsPatients were included if they were ≥70 years of age, had community-acquired pneumonia (CAP) and required MEPM treatment. All patients suffered from some comorbidity (e.g., diabetes mellitus, chronic renal disease, chronic obstructive pulmonary disease, cancer). The investigation was carried out from March 2011 to April 2014. Patients must have had at least one reported determination of sCr at the start of MEPM treatment after being hospitalized. All patients must have been treated with MEPM for at least 4 d with clinical success. Patients who were on dialysis, who were changed to a different antibiotic, or who received other concurrent antibiotics, were excluded from the analysis. The biochemistry data were analyzed retrospectively from test results held on a medical database used by the Saiseikai Chuwa Hospital. The study protocol was reviewed and approved by the ethical committee of Saiseikai Chuwa Hospital (permit number: 14p01).
Regression Equation for the Correlation between Age and BWThe correlation between age and actual BW was estimated in a development cohort treated between April 2011 and March 2013 (n=89) by linear regression using the least-squares method.
Development of a Conventional Nomogram for Elderly Patients Based on sCr and Age Using the Monte Carlo SimulationThe regression equation was applied to Monte Carlo simulation software which had been used previously in our hospital and the appropriate dosing interval required to attain 40%TAM was calculated. The data were divided into six categories for age and seven categories for sCr, on the basis of the simulation exercise.
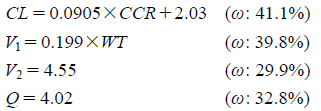
From the mean values and standard deviations of pharmacokinetic (PK) parameters and anthropometric variables (e.g., age, BW and sCr), 1000 simulated patients were created by a Monte Carlo simulation using Microsoft Excel 2007, with the assumption of a normal distribution. The PK parameters, clearance and distribution volumes for each drug were estimated from the population parameters of Japanese adult patients, as reported previously.10) Concentration–time profiles were generated for different dosage regimens of MEPM using the following equations10):
where
CL=total body clearance (L/h),
CCR=creatinine clearance rate (mL/min),
V1 and
V2=distribution volumes of the central and peripheral compartments (L), respectively,
Q=inter-compartmental (central-peripheral) clearance,
WT=BW (kg), and ω=interindividual variability.
Anthropometric data were collected from a cohort of 89 elderly patients who formed the development group. A protein-binding fraction derived from the package inserts of MEPM (2.4%) was applied to correct for the plasma protein-binding fraction in the simulation. The time above the MIC was calculated according to the equation9):
where
T1/2=half-life (h),
DI=dosing interval (h).
The probability of target attainment for each antibiotic regimen was then calculated as the fraction of 1000 subjects achieving >40%TAM across a range of MICs, chosen on the basis of MEPM susceptibilities determined in a surveillance study. A target attainment of MICMEPM=2 mg/L was adopted, since the majority of pathogens have an MIC90 for MEPM <2 mg/L.11) The CCR was calculated using the Cockcroft–Gault formula. Similar methods have been used previously in studies of the population parameters of Japanese adult patients.10) When serum creatinine was <0.6 mg/dL, 0.6 mg/dL was used as the sCr in the simulation.12)
Nomogram ValidationThe validation of the nomogram was performed using a second independent validation group of patients (n=28). The nomogram was validated by calculating the proportion of patients for whom the nomogram correctly predicted the appropriate dosing interval required to attain 40%TAM.
StatisticsThe Excel statistics software program (Excel Statistics 2010® for Windows, SSRI Inc., Tokyo, Japan) was used for statistical analysis. The χ2-test and Mann–Whitney U-test were used to compare results at a significance level of p<0.05.
Results
Patient CharacteristicsThe patient characteristics for the two groups (development and validation cohorts) are summarized in Table 1. In the development group, the mean male BW was significantly higher than that of female patients (41.7±3.5 vs. 39.5±3.7 kg, p<0.01), while the mean male age was significantly lower than that of female patients (82.8±6.8 vs. 86.4±5.4 years, p=0.02). No significant differences were observed in relation to sex distribution, sCr, medical history or frequencies of medical complications between the two groups.
Table 1. Patient Characteristics
| Development group (n=89) | Validation group (n=28) |
|---|
| Male (n=44) | Female (n=45) | p-Value | Male (n=10) | Female (n=18) | p-Value |
|---|
| Age (years), mean±S.D. | 82.8±6.8 | 86.4±5.4 | 0.02 | 81.5±6.6 | 82.3±6.3 | 0.32 |
| Body weight (kg), mean±S.D. | 41.7±3.5 | 39.5±3.7 | <0.01 | 42.9±5.7 | 40.7±3.7 | 0.13 |
| sCr (mg/dL), mean±S.D. | 0.92±0.45 | 0.87±0.50 | 0.50 | 0.86±0.50 | 0.74±0.28 | 0.90 |
| Number of complications (%) |
| Chronic obstructive pulmonary disease | 7 | 4 | 0.31 | 3 | 4 | 0.64 |
| Chronic heart disease | 3 | 5 | 0.48 | 1 | 5 | 0.27 |
| Diabetes mellitus | 28 | 22 | 0.16 | 5 | 5 | 0.24 |
| Chronic renal disease | 2 | 1 | 0.54 | 1 | 2 | 0.93 |
| Brain infarction | 15 | 10 | 0.21 | 2 | 5 | 0.65 |
Statistical significance was estimated using χ2 test or Mann–Whitney U-test.
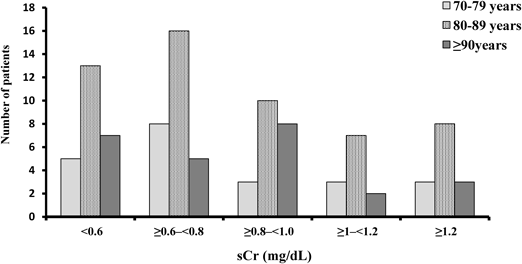
The relation between age and initial sCr is shown in Fig. 1. Most patients had sCr values below 1.0 mg/dL. Patients between 80 and 89 years were the largest age group, followed by patients over 90 years (Fig. 1).
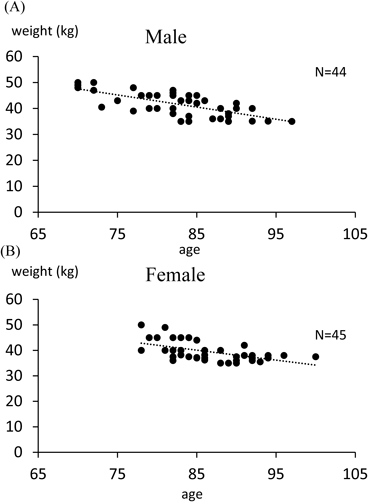
Development and Validation of Equations for Estimating CCR on the Basis of sCr and Age (i.e., Excluding BW)The significant linear relationship between age and BW in the development cohort is summarized in Fig. 2 (least-squares method, p<0.001). Correlation of the data yielded the following equation:
There were no significant differences between actual BW and the BW (e-BW) estimated using this equation (male: e-BW 41.6±3.1 kg, BW 41.7±3.5 kg, p=0.93; female: e-BW 39.5±2.1 kg, BW 39.5±3.7 kg, p=0.20; Table 2). The estimated CCR (eCCR) calculated using e-BW and the CCR based on actual BW were also compared in the development cohort, for males and females separately. There were no significant differences between eCCR and CCR (male: eCCR 40.6±18.1 mL/min, CCR 41.1±17.1 mL/min, p=0.94; female: eCCR 31.2±9.3 mL/min, CCR 30.6±8.7 mL/min, p=0.79; Table 2).
Table 2. Comparison between Actual and Estimated Body Weight Measures (kg), between
CCR and Estimated
CCR (mL/min)
| Average | S.D. | Mean different | p |
|---|
| Male |
| Weight | 41.7 | 3.5 | — | |
| e-Weight | 41.6 | 3.1 | 0.55 | 0.93 |
| CCR | 41.1 | 17.1 | — | |
| eCCR | 40.6 | 18.1 | 0.49 | 0.94 |
| Female |
| Weight | 39.5 | 3.7 | — | |
| e-Weight | 39.5 | 2.1 | −0.05 | 0.20 |
| CCR | 30.6 | 8.7 | — | |
| eCCR | 31.2 | 9.3 | 0.63 | 0.79 |
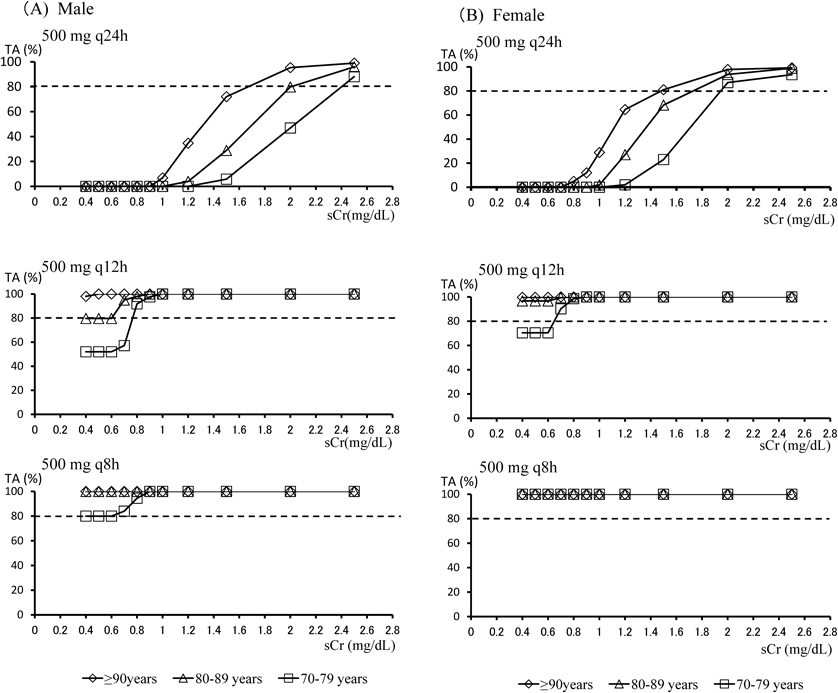
By integrating this equation using simulation software, the target attainments of >40%TAM for the various MEPM dosage regimens were calculated from age and sCr. Figures 3(A) and (B) shows simulated target attainments (%) of >40%TAM for three typical MEPM dosage regimens (500 mg q24h, q12h and q8h) with various values of sCr for male or female patients. From these simulated lines, based on individual sCr values, the dosage regimens reaching above the 80% probability line for patients in three different age groups (70–79, 80–89 and ≥90 years) were determined.
In male patients (Fig. 3), for the 500 mg q8h dose, all age groups reached the target, i.e., the percentage of subjects achieving 40%TAM was more than 80% in all sCr categories. For the 500 mg q12h dose, the percentage of subjects achieving 40%TAM in the group aged ≥90 years was more than 80% in all sCr categories. The overall calculated probability of target attainment in patients aged 80–89 years was 79.6%. In patients aged 70–79 years it was lower than the other two groups in sCr categories <0.8 mg/dL. For the 500 mg q24h dosage regime, the attainment rate declined as sCr and age decreased. When sCr was ≤0.8 mg/dL, the attainment rate was 0% in all age categories. Target was reached for the 70–79, 80–89 and ≥90-year-old groups in sCr categories over 1.7, 2.0 and 2.4 mg/dL, respectively.
In female patients (Fig. 3B), the target was reached by all age groups at a dosage regime of 500 mg q8h. For the 500 mg q12h regime, the percentage of subjects achieving 40%TAM in the 80–89 and ≥90 year groups was >80% in all sCr categories. The calculated probability of target attainment in the 70–79-year-old group was lower than those of the other two groups for all sCr categories ≤0.8 mg/dL. For the 500 mg q24h regime, the target attainment rate declined as sCr and age decreased, becoming 0% for all age categories when sCr was 0.6 mg/dL. Target attainment was reached for the 70–79, 80–89 and ≥90 year-old groups at sCr categories over 2.0, 1.7 and 1.5 mg/dL, respectively.
Dosage regimens which reached the >80% probability were determined for each sCr category and summarized in a nomogram (Table 3). All dosage regimens were determined on the basis of a fixed infusion time of 1 h. As illustrated in the nomogram, the optimal dosing interval increased with increasing age and increasing sCr.
Table 3. Initial Dosage Regimen of Meropenem Infusion Derived Using a Nomogram Based on sCr and Age
| sCr (mg/dL) | Age |
|---|
| 70–74 | 75–79 | 80–84 | 85–89 | 90–95 | ≥96 |
|---|
| <0.6 | 500 mg q8h | 500 mg q8h | 500 mg q8h | 500 mg q8h | 500 mg q12h | 500 mg q12h |
| ≥0.6–<0.8 | 500 mg q8h | 500 mg q8h | 500 mg q12h | 500 mg q12h | 500 mg q12h | 500 mg q12h |
| ≥0.8–<1.0 | 500 mg q12h | 500 mg q12h | 500 mg q12h | 500 mg q12h | 500 mg q12h | 500 mg q12h |
| ≥1–<1.2 | 500 mg q12h | 500 mg q12h | 500 mg q12h | 500 mg q12h | 500 mg q12h | 500 mg q12h |
| ≥1.2–<1.5 | 500 mg q12h | 500 mg q12h | 500 mg q12h | 500 mg q12h | 500 mg q12h | 500 mg q12h |
| ≥1.5–<2 | 500 mg q12h | 500 mg q12h | 500 mg q12h | 500 mg q12h | 500 mg q24h | 500 mg q24h |
| ≥2 | 500 mg q24h | 500 mg q24h | 500 mg q24h | 500 mg q24h | 500 mg q24h | 500 mg q24h |
Defined as dosage regimen at which the probability of %TAM≧40 attainment was 80%. A single administration of MEPM lasted 1 h.
The nomogram were validated using both the development group and a separate validation group of 28 patients. In the validation group, the dosage regimen of 25 patients (89.3%) was predicted correctly with reference to the dose actually prescribed by the treating physician on the basis of actual BW. For three patients, the correct dosage interval was shorter than that predicted by the nomogram.
By comparison, in the development group, the dosage regime of 84 patients (94.4%) was predicted correctly. For five patients, the correct dosage interval was shorter than that predicted by the nomogram.
Discussion
Using published PK data and anthropometric data from elderly in-patients, a simulation study was conducted to develop and test the usefulness of a nomogram for predicting the correct dosage regimen of MEPM in elderly patients on the basis of age and sCr alone. The predictivity of the nomogram was evaluated by observing the rate of achievement of >40%TAM in different age groups. Our study demonstrated the successful implementation of a dosage nomogram based on age and sCr in elderly patients with comorbidities.
The estimated glomerular filtration rate (eGFR), which makes no allowance for body surface area, is routinely reported in clinical situations. If pharmacists calculate a dosage regimen on which to start MEPM treatment on the basis of an individual patient’s data (age, sex, eGFR, sCr and BW), they may overestimate renal function as a result of using an eGFR value.13,14) And in acute situations, the correct dose needs to be administered even when there is no possibility of directly weighing the patient. It was therefore decided to develop a convenient, user-friendly dosing nomogram to use when elderly patients are admitted to hospital with an acute infection such as CAP and need to be started on MEPM immediately.
The nomogram we propose is easy to apply, since it allows the dosage regimen to be estimated on the basis of age and sCr alone, without necessitating the calculation of CCR (which would be necessary if the dosage instructions on the package insert or the Sanford guideline were followed).
In this study, a significant correlation between age and BW was found in a population of elderly patients with CAP (p<0.01), enabling BW to be estimated on the basis of this correlation. Although several equations have been developed which enable BW and height to be estimated from surrogate measures of body segments (e.g., knee height, arm and calf circumferences, skinfold thickness) in patients who are bedridden and unable to walk,15,16) the mean differences between actual and estimated values using these surrogate measures are significant (p<0.001), with overestimation of actual BW in all formulas by 1.9–4.5 kg for males and −2.1–7.1 kg for females.17) This calculation error is much larger than the error between actual BW and e-BW in the present study. There were also no significant differences between CCR and eCCR obtained in our study. This methodology therefore allows the appropriate dosing interval required to attain 40%TAM to be recommended to the clinican by the pharmacist on the basis of eCCR. Our method may be suitable for use in other clinical situations in which details of patient physical characteristics are not available, as long as the patient populations are similar.
Actual renal function may be overestimated as a result of reduced creatinine output from atrophic muscle in elderly patients, particularly the long-term bedridden. When sCr was under 0.6 mg/dL in this study (in long-term bedridden patients and those who had suffered a cerebral infarction), 0.6 mg/dL was used as the sCr in the calculation. To minimize the risk of over- or under-estimation in patients who lie outside the normal limits of the population, it may be necessary to calculate maintenance dosage using real data for patients who are extremely obese or emaciated.
An aim of this study was to investigate the ability of standard MEPM dosage regimens to attain 40%TAM in elderly patients using simulation software. Our results indicate that the attainment rate of 40%TAM declines in most dosage regimens as sCr and age decrease, especially for the 500 mg q24h dose. Regimes of 500 mg q12h and 500 mg q8h appear to be more effective at low values of sCr.
In the development group only 6% of patients were prescribed a higher dosage than the dosage recommended using the nomogram, while in the validation group this figure was 11%. This result suggests that the nomogram may be capable of recommending an initial dosage regimen for MEPM.
The limitations of this study include the small sample size and the assumption that the correct dosages of MEPM can be predicted on the basis of PK parameters for all patients. The PK parameters used in our study were presumed to be capable of predicting serum concentrations of MEPM, but our study population consisted of elderly patient with comorbidities, which may affect the validity of using the selected PK parameters. This may lead to slight differences in predictions of %TAM. Ikawa et al. have reported that age and BW should not both be used to estimate MEPM clearance, in order to avoid a collinearity effect, as age and BW are both highly correlated with CCR.10) In our study, we considered that, in critical situations, it may be more important to estimate a patient’s BW without delay, in order to determine the correct starting dose and administration interval of the appropriate drug. When weighing patients is impossible, an incorrect visual approximation of BW may lead to adverse effects or lack of therapeutic effectiveness. Therefore the present study is the lack of the consideration of collinearity effects.
In the development group used in our study, elderly patients with CAP requiring immediate MEPM treatment, a significant linear relationship existed between age and BW. The difference between CCR and eCCR was fairly small and this allowed us to calculate an initial dosage regimen designed to achieve 40%TAM in the absence of detailed patient information. Maintenance dosing always needs to be calculated later on the basis of further information.
In conclusion, a nomogram has been developed using a Monte Carlo simulation which allows the appropriate dosage and administration schedule of MEPM to be determined on the basis of only the sCr and age of elderly patients. This nomogram will assist clinicians and pharmacists in acute situations to select the appropriate starting regimen of MEPM in elderly patients with CAP so as to achieve >40%TAM. A prospective evaluation in a larger population, with determination of MEPM serum concentrations after dosing based on the nomogram, will be required to confirm the utility of this nomogram.
Conflict of Interest
The authors declare no conflict of interest.
References
- 1) Wiseman L. R., Wagstaff A. J., Brogden R. N., Bryson H. M., Drugs Jul., 50, 73–101 (1995).
- 2) Nicolau D. P., Expert Opin. Pharmacother., 9, 23–37 (2008).
- 3) Baughman R. P., J. Intensive Care Med., 24, 230–241 (2009).
- 4) Hawkey P. M., Livermore D. M., BMJ, 344, e3236 (2012).
- 5) Gould I. M., Curr. Opin. Infect. Dis., 15, 395–400 (2002).
- 6) Neuhauser M. M., Weinstein R. A., Rydman R., Danziger L. H., Karam G., Quinn J. P., JAMA, 289, 885–888 (2003).
- 7) Craig W. A., Clin. Infect. Dis., 26, 1–10, quiz, 11–12 (1998).
- 8) Drusano G. L., Nat. Rev. Microbiol., 2, 289–300 (2004).
- 9) Turnidge J. D., Clin. Infect. Dis., 27, 10–22 (1998).
- 10) Ikawa K., Morikawa N., Ohge H., Ikeda K., Sueda T., Taniwaki M., Kurisu K., J. Infect. Chemother., 16, 25–32 (2010).
- 11) Niki Y., Hanaki H., Matsumoto T., Yagisawa M., Kohno S., Aoki N., Watanabe A., Sato J., Hattori R., Terada M., Koashi N., Kozuki T., Maruo A., Morita K., Ogasawara K., Takahashi Y., Watanabe J., Takeuchi K., Fujimura S., Takeda H., Ikeda H., Sato N., Niitsuma K., Saito M., Koshiba S., Kaneko M., Miki M., Nakanowatari S., Honda Y., Chiba J., Takahashi H., Utagawa M., Kondo T., Kawana A., Konosaki H., Aoki Y., Ueda H., Sugiura H., Ichioka M., Goto H., Kurai D., Okazaki M., Yoshida K., Yoshida T., Tanabe Y., Kobayashi S., Okada M., Tsukada H., Imai Y., Honma Y., Nishikawa K., Yamamoto T., Kawai A., Kashiwabara T., Takesue Y., Wada Y., Nakajima K., Miyara T., Toda H., Mitsuno N., Sugimura H., Yoshioka S., Kurokawa M., Munekawa Y., Nakajima H., Kubo S., Ohta Y., Mikasa K., Maeda K., Kasahara K., Koizumi A., Sano R., Yagi S., Takaya M., Kurokawa Y., Kusano N., Mihara E., Kuwabara M., Fujiue Y., Ishimaru T., Matsubara N., Kawasaki Y., Tokuyasu H., Masui K., Negayama K., Ueda N., Ishimaru M., Nakanishi Y., Fujita M., Honda J., Kadota J., Hiramatsu K., Aoki Y., Nagasawa Z., Suga M., Muranaka H., Yanagihara K., Fujita J., Tateyama M., Sunakawa K., Totsuka K., J. Infect. Chemother., 15, 156–167 (2009).
- 12) Matsuo S., Imai E., Horio M., Yasuda Y., Tomita K., Nitta K., Yamagata K., Tomino Y., Yokoyama H., Hishida A., Collaborators developing the Japanese equation for estimated GFR, Am. J. Kidney Dis., 53, 982–992 (2009).
- 13) Nyman H. A., Dowling T. C., Hudson J. Q., Peter W. L., Joy M. S., Nolin T. D., Pharmacotherapy, 31, 1130–1144 (2011).
- 14) Gill J., Malyuk R., Djurdjev O., Levin A., Nephrol. Dial. Transplant., 22, 2894–2899 (2007).
- 15) Chumlea W. C., Guo S., Roche A. F., Steinbaugh M. L., J. Am. Diet. Assoc., 88, 564–568 (1988).
- 16) Rabito E. I., Vannucchi G. B., Suen V. M. M., Neto L. L. C., Marchini J. S., Rev. Nutr., 19, 655–661 (2006).
- 17) Ana P. F. M., Raquel K. S., Francilene G. K. V., Marilyn G. F. “Methods for estimating body weight and height in hospitalized adults: a comparative analysis.”: ‹DOI http://dx.doi.org/10.5007/1980-0037›, 2014.