Abstract
Oral gel formulations are known as easy to administer drug products for patients who have problems taking drugs including those with conditions such as dysphagia. In addition, there are numerous commercially available oral gel products, most of which are immediate-release formulation that release their pharmaceutical ingredient content by diffusion. This study is focused on developing oral gel formulations that reduce the dosing frequency and dosage compared to the conventional types. This is with the aim of facilitating the use of gel formulations for producing pharmaceutical agents with different dose regimens, thereby enhancing patient convenience. Here, we used naturally derived high-molecular-weight agar (Ag), xanthan gum (Xa), and locust bean gum (Lo) as gel bases to prepare a variety of gel membranes, and evaluated the diffusion coefficient of the model substances. The result revealed that the Ag content in the Xa–Lo combination gel concentration-dependently increased the diffusion coefficient. Moreover, these findings were applied in an attempt to mask the taste of intensely bitter levofloxacin. The results indicated that the Xa–Lo combination gel exhibited a significantly superior masking effect to that of the Ag gel. This study demonstrates the feasibility of using oral gel formulations to modulate the controlled-release functionality of pharmaceutical agents.
In recent years, proactive development of formulations that facilitate patient convenience in taking medicines has been encouraged to improve drug compliance and adherence. Examples of such efforts include orally disintegrating tablets,1,2) film drug products,3,4) and oral gel formulations.5,6) The increasing trend of proactive research and development into these formulations may have been partly encouraged by a rapidly growing aging population worldwide. In particular, Japan is currently experiencing a situation where our population appears to enter into the phase of an aged society ahead of the rest of the world. This circumstance makes addressing the challenges for the prevention of diseases such as pneumonia aspiration associated with compromised swallowing functions in aged people a priority.
Current research on oral gel products has focused on ease-of-dosing that can be achieved by the proper flowability and easy chewability offered by gel formulations. Furthermore, these formulations can clinically enhance drug compliance in the elderly and patients with dysphagia and, therefore, they were primarily expected to be used in hospital dispensaries. However, advances in manufacturing machinery and technologies in recent years have gradually encouraged active research into gel formulations with a post-marketing projection. The beneficial effects of some oral gel formulation jellies have been demonstrated including Caloryl® that contains lactulose as a hyperammonemia treatment drug; Lagnos®, Argamate® that contains calcium polystyrene sulfonate as a hyperkalemia treatment drug, internal use Acivir® that contains the antiviral agent acyclovir, and Aricept® that contains donepezil hydrochloride as a treatment drug for Alzheimer’s-type dementia.7–11)
However, most of the numerous research studies and commercialized drug product development strategies have primarily targeted gel formulations for their ease-of-use and dosing convenience without water. Furthermore, the development efforts have predominantly involved the production of immediate-release drug products designed to release their active pharmaceutical agents by diffusion. In addition, the design of immediate-release preparations predisposes patients to a higher likelihood of experiencing the bitter taste of the drug than conventional dosage forms. This is because of their shortcoming of possessing weaker masking effects than those of physically masked formulations such as film-coated tablets.
In view of the current limitations of gel formulations, we have conducted a study on controlled-release products to develop a formulation that retains the features of a gel but effectively exerts pharmacological effects by releasing its active agents in a controlled manner. The formulation was also targeted at potentially reducing adverse drug reactions, as well as dosage and administration frequency, and improving the product functionality. Numerous studies are proactively being conducted and some have reported the use of gels as additives to enhance the controlled drug release capability of formulations. For example, studies have investigated the use of the swelling/shrinking properties of gel to control the release of pharmaceutical agents by temperature changes.12–14) Specific chemical compounds such as glucose have been used to alter gel swelling,15–18) physical stimuli such as pH responsiveness,19–21) and control the gel mechanisms that respond to magnetic fields and ultrasound.22–24)
However, not many research studies conducted to date have investigated the possibility of including a substance with controlled-release properties to gel formulations used for oral dosing. Moreover, only a limited number of published reports are available on studies on the combination of carrageenan gel and acetaminophen.25–27) This may be because there are a limited number of gel bases that can exhibit controlled-release properties following oral administration. Therefore, studies on the application of gel formulations in future commercialization processes will have to anticipate overcoming the considerable obstacle to developing an agent that can obtain approval as an excipient, especially regarding safety concerns.
We previously reported that we were able to manipulate naturally occurring gel agar (Ag) and a xanthan gum (Xa)–locust bean gum (Lo) combination (Xa–Lo) into forming a gel structure.28) The research results revealed the different level of mesh structures between these gels, and Ag exhibited a rather crude structure while the Xa–Lo has a meticulously woven structure. In addition, our findings determined that the structural differences between these gels might have contributed to the different dissolution profiles of acetaminophen, a model drug tested in the study. This result indicated that the combination of these gels might achieve some drug-release controllability in a formulation.
Therefore, in this paper, we present our research results showing the characterization of the diffusion behaviors of gels that were exhaustively investigated for their drug release profiles. More specifically, we prepared membranous gels to elucidate the diffusion behaviors of a variety of model substances. We also evaluated the possibility of obtaining different diffusion behaviors of the various model substances by using varying combination ratios of Xa–Lo to Ag. These findings were considered and applied in our assessment of the drug dissolution profiles of the gel formulations. Finally, the ability of the gels to mask the intensively bitter taste of a model drug, levofloxacin, was also investigated using a taste sensing system.
This research studied Ag, Xa, and Lo, which have already been established as naturally derived high-molecular-weight gel base excipients, and demonstrated that they produced gel formulations with a controlled drug-release capability. These findings imply that this formulation has the potential for use in the preparation of useful gel formulations of numerous pharmaceutical agents, which are described in this paper.
Experimental
MaterialsGel PreparationFor gel preparations, the gel bases used were Ag, Xa (Ina Food Industry, Nagano, Japan), and Lo (Sansho, Osaka, Japan). Other excipients used were powdered hydrogenated maltose starch syrup (Mitsubishi Shoji Foodtech, Tokyo, Japan) and ethyl 4-hydroxybenzoate (Ueno Fine Chemicals Industry, Osaka, Japan).
Model SubstancesThe model substances used in the defined tests were fluorescein sodium (F-Na), fluorescein isothiocyanate (FITC), dextran-FITC (FITC-DEX molecular weight 4400, 10000, and 69400), acetaminophen (AAP, all from Sigma-Aldrich, Corp., MO, U.S.A.), sodium benzoate (SBA, Fushimi Pharmaceutical, Kagawa, Japan), potassium sorbate (PSA, MC Food Specialties, Tokyo, Japan), chlorpheniramine maleate (CPM) (Tokyo Chemical Industry, Tokyo, Japan), and levofloxacin (LVFX, Teva API Japan Ltd., Tokyo, Japan).
Gel PreparationThe gel used in the experiment was prepared by weighing the quantities of Ag or Xa and Lo specified in the combinations described in Table 1, and then they were mixed with part of the powdered hydrogenated maltose starch syrup to prevent the formation of undissolved masses of powder. Then, these mixtures were gradually added to purified water to allow diffusion, heated in a water bath to a temperature of 95°C, and then mixed for 15 min for complete dissolution. Then, the remaining powdered hydrogenated maltose starch syrup and ethyl 4-hydroxybenzoate were added, and the volume was adjusted for mass correction with purified water. The temperature of the solutions was measured to ensure they were at least 85°C (they were heated again if necessary), sterilized for 30 min, and the resulting gel preparation was dispensed into the predesignated containers as needed for the purpose of the experiment and allowed to sit at 25°C overnight to solidify and were then used.
Table 1. Gel Combined Ratios and Properties Used in Defined Tests
| Components | Content (w/w%) |
|---|
| A | B | C | D | E | F | G | H |
|---|
| Ratio (%)a) | 0.0 | 0.0 | 0.0 | 23.1 | 66.7 | 85.7 | 92.3 | 100.0 |
| Agar (Ag) | 0.5 | 1.0 | 1.5 | 1.0 | 0.3 | 0.1 | 0.05 | — |
| Xanthan gum (Xa) | — | — | — | 0.15 | 0.3 | 0.3 | 0.3 | 0.3 |
| Locust bean gum (Lo) | — | — | — | 0.15 | 0.3 | 0.3 | 0.3 | 0.3 |
| Powdered hydrogenated maltose starch syrup | 40.0 | 40.0 | 40.0 | 40.0 | 40.0 | 40.0 | 40.0 | 40.0 |
| Ethyl 4-hydroxybenzoate | 0.05 | 0.05 | 0.05 | 0.05 | 0.05 | 0.05 | 0.05 | 0.05 |
| Purified water | p.q.b) | p.q. | p.q. | p.q. | p.q. | p.q. | p.q. | p.q. |
| Total | 100.0 | 100.0 | 100.0 | 100.0 | 100.0 | 100.0 | 100.0 | 100.0 |
| Diameter of the plunger used for measurement (mm) | 16 | 16 | 16 | 8 | 1.5 | 1.5 | 1.5 | 1.5 |
| Breaking stress (×104 Pa)c) | 2.3±0.1 | 7.5±0.1 | 16.6±0.2 | 6.2±0.0 | 7.6±0.3 | 7.0±0.3 | 6.0±0.3 | 5.5±0.7 |
| Strain rate (%)c) | 25.7±0.8 | 37.1±0.6 | 37.3±0.8 | 25.7±0.7 | 44.2±1.3 | 80.5±0.6 | 84.0±0.8 | 93.2±2.7 |
a) Combined ratio of Xa and Lo to the total amount of spiked gel bases (Ag, Xa, and Lo). b) Proper quantity. c) Each test had three runs, and the results are the mean±S.D.
The gel properties were determined using the following methods. Samples were prepared by loading approximately 10 mL of the gel preparation solution into a polypropylene container of approximately 26 mL capacity (top, bottom, and height were ϕ 40, 35, and 30 mm, respectively, Sarstedt AG & Co., Nümbrecht, Germany) and the container was left to stand at 25°C. When the samples had solidified, their properties were determined.
Gel strength was determined using a creep meter (Yamaden: RHEONER RE-3305, Tokyo, Japan) and a load cell of 20 N in full scale. The gel was analyzed at 25°C. Using a cylinder-type plunger (Table 1 shows plunger diameters used in the defined determination), a stress–strain curve was obtained from samples that were compressed by 95 to 100% of their thickness at a compression rate of 1 mm/s. In addition, the breaking stress and strain rate of the gel were recorded.
Determination of Diffusion Coefficient of Gel MembraneThe gel membrane was prepared using a gel holder shown in Fig. 1 based on the method of Tokita.29) In addition, we used a commercially available membrane permeability-testing device (Permcell™ Model KH-55, Vidrex Co., Ltd., Fukuoka, Japan) to determine the diffusion as illustrated in Fig. 2.
The gel membrane was placed in the middle of the cells for the permeability test device, sandwiched between silicon sheets that were clipped to secure the membrane to ensure that the test solution did not leak out from the cells. The cells at both ends were filled with 48 mL of purified water, which was the test solution for each cell. Under this condition, the test solution was maintained at 30°C for at least 30 min by delivering circulating water from the thermostat water bath through a pump via a jacket placed outside of the cells.
In Cell 2, the model substance was added at a predefined amount depending on the purpose of the experiments, and the volume of the solution inside the cell was made up to 50 mL. Purified water was added to the other cell (Cell 1) to prevent any pressure difference compared with the membrane. The time the model substance was added was denoted as the beginning of the study, and the test solution in Cell 1 was circulated using a pump. In addition, when the solution used was F-Na, FITC, or FITC-DEX, a fluorescence detector (Model RF-10A, Shimadzu, Kyoto, Japan) was used for monitoring and recording the fluorescence (excitation and emission wavelength, 490 and 520 nm, respectively). For the other model substances, the test solution was sampled from Cell 1 at a predetermined interval (after withdrawal, the sample was added to purified water that had been stored at 30°C), and each test solution was analyzed using an Acquity ultra-performance liquid chromatography (UPLC) system (Waters Corp., MA, U.S.A.). The concentrations of the model substances were calculated using separately prepared calibration lines.
Calculation of Diffusion CoefficientThe diffusion coefficients of the model substances as they permeated through the gel membrane were calculated using the time lag (tL) method.29) As described earlier, the concentrations of the model substance as they diffused in Cell 1 were determined over time and presented in a graph. The early phase of detection shows an inverted bell-shaped curve plotted on the graph, followed by a linear pattern of the concentrations of the model substances, which appears as soon as the diffusion starts. The tL represents the time when the linear curve at a stable state was extrapolated such that the concentration curve passed through the 0 point. The tL values obtained in the various tests were substituted into the following Eq. 1 to obtain the diffusion coefficients.
 | (1) |
where
D is the diffusion coefficient of a given model substance in the gel membrane (m
2/s) and
d is the thickness of the gel membrane (m).
Dissolution Test for Model SubstancesThe model substances were added to the formulation combinations B and D–H to obtain a concentration of 83.3 µmol/L, and then the gels were prepared as described in section Gel Preparation. The gel solutions were poured into 1-cm3 cube-shaped molds, allowed to stand at 25°C to solidify, and then used as the gels samples. The samples were tested at 37°C using the dissolution test apparatus 2 (Paddle method) listed in the General Tests of the Japanese Pharmacopoeia using a dissolution tester (Toyama Sangyo, NTR-6000, Tokyo, Japan). The paddle rotation was set at 50 rpm, and the test solutions were mixed with 900 mL of purified water. A single sample was poured into one vessel, and the test solutions were sampled at predetermined intervals. The dissolution test solutions obtained by sampling were analyzed using an Acquity UPLC system, and concentrations of the diffused substances were separately calculated using a calibration curve obtained by analyzing the concentration of known model substances.
Bitterness Evaluation of Gel Using Taste SensorA taste sensing system (TS-5000Z, Intelligent Sensor Technology, Kanagawa, Japan) that can mechanically determine the tastes that humans consider as bitter in the mouth30,31) was used to evaluate the bitterness of LVFX. A basic bitterness sensor (BT0) was used that was highly responsive to LVFX, concentration-dependently. Among the gels used in the evaluation, combinations B and H were selected as the representative combinations for the Ag and the Xa–Lo combination gels (Table 1). Furthermore, ethyl 4-hydroxybenzoate was excluded from the gels as an additive to eliminate any possible effects it may have on the responses of the taste recognition sensor to any substance other than LVFX. The prepared gels were molded into 1-cm3 cube-shape forms, and to reproduce the state the inside the mouth after mastication, the formed gels were placed into a 10-mL syringe (Terumo, Tokyo, Japan) and crushed by injection from the syringe tip, which had an inner diameter of approximately 2 mm. The crushed gel was placed into 50 mL of 0.33 M potassium chloride (KCl), a responsive solution to the sensor, and the solution was sampled after approximately 30 s to determine the bitterness of LVFX based on the simulated human detection of bitterness. The results obtained with combinations B and H were analyzed using a single t-test to determine significant differences.
Results and Discussion
Property Determination of Gel PreparationsIn this study, to clarify the relationship between gel properties and the diffusion rate of pharmaceutical agents, gel formulations with a variety of properties were prepared. Ag gel is known to be a brittle and fragile while the Xa–Lo combination gel can be prepared with a strongly elastic gel structure.32,33) We previously reported that the Ag gel and Xa–Lo combination gel have networks that provide different levels of dense structures, which may determine the release properties of incorporated pharmaceutical agents.28) For this test, the gels were prepared by combining Ag and Xa–Lo at various ratios according to the combinations specified in Table 1. Then, we examined the effects of the different combinations on the diffusion rate of the pharmaceutical agents and changes in their release properties from the gels. Furthermore, the results of the gel property determination are provided below the combinations presented in Table 1.
The gel property determination revealed that the breaking stress remained practically the same regardless of different plunger diameters used for the determination since the stress could be calculated from the plunger diameter used in the determination and the area of gel it came in contact with. However, the trend of the strain rate suggested it was likely to break sooner when the plunger diameter was smaller and, therefore, we concluded that the results of the effects of the different plunger diameters could not be discussed correctly. Therefore, we decided to discuss them based on the extent to which the strain rate could be evaluated with the results determined using the same plunger diameter.
First, the Ag concentrations were changed ranging from 0.5 to 1.5 w/w% for the gel preparation (combinations A–C). The result showed that the Ag concentration-dependent breaking stress substantially increased following a slight increase in strain rate. Next, when 1.0 w/w% Ag was added to Xa and Lo at a total of 0.3 w/w% (combination D), the breaking stress was slightly lower than that of Combination B was. When the content of Xa plus Lo was set at a constant level of 0.6 w/w% while Ag concentrations were changed in a range of 0.3 to 0 w/w% (combinations E–H), the lower Ag concentrations in the combinations corresponded to lower breaking stresses while the strain rate increased from lowest to highest. For combinations A–H, we prepared a variety of gels with different breaking stresses and strain rates, and these were analyzed in the subsequent tests.
Effect of Model Substance Concentrations on Diffusion CoefficientThe gel solution prepared using the combination B (1.0 w/w% Ag) formulation was poured into the holder illustrated in Fig. 1, to prepare a gel membrane of 2 and 16 mm thickness and diameter, respectively, to determine the effect of size on diffusion. F-Na was used to evaluate the diffusion of the model substances in the gel membrane. First, the initial spike concentration of F-Na in Cell 2 (Fig. 2) was set at a range of 25 to 150 µmol/L to evaluate any potential effects of the F-Na concentration on the diffusion coefficient. The result showed that the diffusion coefficient remained constant at near 2.2×10⁻¹⁰m2/s for all of the concentration tested (Fig. 3). As elucidated by Fick’s first law, diffusion is a phenomenon where the movement of substances depends on the concentration gradient of diffusing molecules. The results of the present study demonstrated that the F-Na used had very little effects on the diffusion coefficient at the concentrations tested.
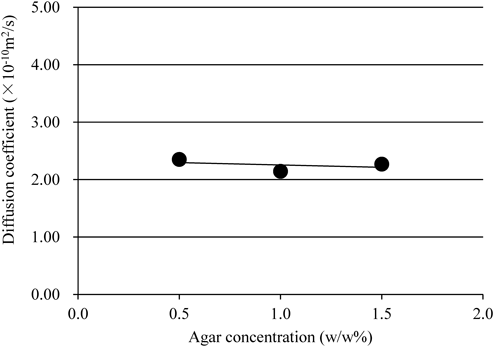
Association between Ag Gel Concentration and Diffusion CoefficientBased on the results in section Effect of Model Substance Concentrations on Diffusion Coefficient, a suitable range was established for F-Na concentrations that would be unlikely to affect the diffusion coefficient. In the subsequent tests, the initial spiking concentration of model substances was 75 µmol/L. Then, gels prepared using different Ag concentrations were evaluated to examine their effects on the diffusion coefficient of F-Na, which was calculated from the gel membranes prepared from combinations A–C (Table 1). The result revealed that the diffusion coefficient remained constant at near 2.2×10⁻¹⁰m2/s when Ag concentrations were changed as shown in Fig. 4. The gels from combinations A–C had breaking stress values of 2.3×10⁴, 7.5×10⁴ and 16.6×10⁴ Pa, respectively, and when compared with those for the gels with Ag concentration 0.5 versus 1.5 w/w%, there was an approximately 7-fold difference. Our previous study demonstrated that higher Ag concentrations were associated with higher breaking stress values, and closer distance between the points of the crosslinked structure of the gel network produced denser networks.28) In addition, the release properties of the AAP embedded in the gel remained the same regardless of Ag concentrations.28) The results of the F-Na diffusion coefficient test are consistent with the findings of our previous study where higher Ag gel concentrations generated denser networks. Furthermore, the gels had a network size (pore size) large enough to enable the permeation of higher concentrations but did not inhibit F-Na diffusion and, consequently, the concentrations might not have affected the diffusion rates.
Association between Molecular Weight of Model Substance and Diffusion CoefficientIn the test described previously, different Ag concentrations produced practically no differences in the diffusion coefficient of F-Na and, therefore, we presumed that the gel network structure might be substantially larger than the molecular sizes of the model substances. For this reason, we examined whether the different diffusion behaviors may have resulted from changes in the molecular weight of the model substances when in contact with gel membranes of 1.0 w/w% Ag (combination B). The model substances used in this test included FITC (molecular weight, 389.4) and dextran with different degrees of polymerization and molecular weights of 4400, 10000, and 69400 (molecular weights are in accordance with the Certificate of Analysis issued by the manufacturers). The result shown in Fig. 5 revealed that FITC had a diffusion rate of 3.2×10⁻¹⁰ m2/s while the FITC-DEXs of 4400, 10000, and 69400 had 2.5×10⁻¹⁰, 1.8×10⁻¹⁰, and 0.8×10⁻¹⁰m2/s, respectively. These values were plotted as a function of the log converted molecular weight on the X-axis with the diffusion coefficient on the Y-axis. The resulting plot provided evidence of an inversely proportional relationship between the molecular weights and the diffusion coefficients. The fact that larger molecular weight model substances were associated with smaller diffusion coefficients may indicate that molecular sizes that can permeate the Ag gels are restricted by the mesh sizes of the gels. However, considering that pharmaceutical agents used in drug products are largely low-molecular weight compounds with a molecular weights of less than 500–1000,34) we concluded that the Ag gel alone would be unlikely to control the diffusion of pharmaceutical agents.
Effect of Combined Ag and Xa–Lo Ratio on Diffusion CoefficientsWe hypothesized that the Ag gel only would not control the diffusion behaviors of low-molecular weight compounds and, therefore, the uncontrollable nature of the diffusion behaviors was examined in Xa–Lo combination gels with a more closed network. The gel membranes investigated were those prepared in accordance with the formulas for combinations B and D–H while F-Na was used as the model substance. The results are illustrated in Fig. 6. Consequently, higher combination ratios of Xa–Lo to the total volume of the gel base were associated with smaller diffusion coefficients or lower diffusion rates. This was presumed to attributable to the compromising of the densely structured Xa–Lo gel by the addition of Ag, which made the membrane more permeable to the molecules. Moreover, this finding has provided evidence that changing the combination ratio of Ag to Xa–Lo gel allows the diffusion behaviors of low-molecular weight compounds to be controlled to a certain extent.
Feasibility Controlling Diffusion Behavior of Model Substances with Different PolaritiesInvestigations using F-Na revealed that changing the combined ratio of Xa–Lo and Ag could change the diffusion coefficient. Base on this observation, AAP and PSA were selected and examined to determine whether different model substances could also alter the diffusion coefficients. AAP and PSA have equivalent molecular weights of approximately 150 but different water solubilities of 1.435) and 58.2 g/100 mL36) at 20°C. These compounds were deliberately selected to demonstrate that some interaction between the drug and gels during diffusion might alter the behaviors. Similar to the previous tests, the diffusion behaviors were determined for these compounds using gel membranes with different combination ratios of Xa–Lo and Ag. The result (Fig. 7) revealed that higher combination ratios of Xa–Lo were associated with lower diffusion coefficient for both compounds, indicating an inversely proportional relationship. Moreover, when the results of the determination were plotted, the slopes of the linear curve fitted through the plots were comparable for both compounds, and no differences were found based on the different polarities of the compounds. The above findings indicate that even compounds with different polarity intended for diffusion can have their diffusion behavior similarly changed.
Dissolution Tests of Various Model SubstancesThe evaluations of the gel membranes revealed that the diffusion coefficient could be changed for a variety of compounds. Based on this observation, the dissolution test was conducted with gel cubes prepared in accordance with the formulas for combinations B and D–H with a variety of model substances, to determine the possibility of controlling their release properties in oral gel formulations. To eliminate any effects of differences in the surface area of sample gel cubes on dissolution rates, the gels were formulated into 1-cm3 cubes. The results are illustrated in Figs. 8a to d. When compared with gels containing only Ag, those with Xa–Lo only had significantly reduced dissolution rates for four types of model substances. Moreover, a trend was observed where higher spiking of the Ag to Xa–Lo ratio also increased the dissolution rate.
The dissolution curves, which were plotted as a function of the combined ratios of Xa–Lo and Ag, show the dissolution rates for various model substances at the first point where there was a constant release from the gels. In addition, the linear curve behavior was evident at 30 min. The results shown in Fig. 9 revealed that a higher spiking ratio of Xa–Lo in the combined gel base was associated with lower dissolution rates, resulting in an inversely proportional chart. This finding shows a similar behavior to that of the diffusion coefficient shown in Figs. 6 and 7. Moreover, the dissolution rate decreased from highest to lowest in the following order, PSA, SBA, CPM, and AAP, similar to the order of the solubility of the model substances in water, suggesting that the dissolution of substances released from gels can also increase because of high polarity. The solubilities in 100 mL of the model substances tested by the flask method37) were PSA, 59.8 g; SBA, 58.0 g; CPM, 49.7 g; and AAP, 2.0 g all at 37°C.
The results illustrated in Fig. 7 show that the diffusion coefficient could remain the same irrespective of compound solubility. Meanwhile, the dissolution tests results shown in Figs. 8 and 9 suggest that the dissolution rate may be affected by the compound’s solubility or polarity, which apparently contradicted the results shown in Fig. 7. This finding was attributable to differences in the test conditions. For instance, the diffusion coefficient determination involved Cell-2 that contained compounds at an adequate concentration, and evaluated the diffusion behaviors of the compounds in the gel membrane when the behavior was stabilized. In contrast, the dissolution test involved gels that already contained the compounds at predefined concentrations, which were dissolved in the dissolution test solution or water to release the compounds. In addition, the compound concentrations of the gels became gradually less and, therefore, the release rate eventually lessened. To obtain further clarification and the details of these responses, we would like to elucidate these mechanisms in our future research studies.
Bitterness Masking Effect of LVFX-Containing GelOur previous findings revealed that changing the spiking ratio of Ag to Xa–Lo could determine the diffusion behavior and dissolution profile. Based on this observation, gels containing LVFX as the pharmaceutical ingredient were prepared and tested to examine whether the formulated gels could mask the bitter taste by inhibiting the rapid dissolution of the ingredient. LVFX is classified as a new quinolone synthetic antibacterial agent, and it has a broad spectrum of activity against Gram-negative and Gram-positive bacteria. Therefore, it is recognized as a beneficial pharmaceutical agent with demonstrated efficacy against bacterial infections.38,39) However, LVFX is extremely bitter, which makes it unpleasant and difficult to formulate as an oral gel product that could be easily administered to elderly patients. As shown in Fig. 8, combinations B and H were chosen as the sample gels with fast and slow dissolutions, respectively, and the taste of LVFX-spiked formulations of both gels were tested using a taste sensor. The change of membrane potential by adsorption (CPA) values, regarded as an aftertaste in functional evaluations in humans, were set as the index and the response potential was determined. The result showed that the CPA was −0.44 and 0.07 mV for combinations B and H, respectively as shown in Fig. 10. It has already been demonstrated that the BT0 sensor used for the determination increases the negative response potential in proportion to LVFX concentrations. The negative potential was stronger with combination B than it was with H, which indicates that more LVFX dissolution causes a stronger sense of bitterness. Moreover, the results were analyzed using an unpaired t-test, which revealed a significant difference (p<0.01). In addition, we found that the masking effect of combination H can be kept significantly while taking the gel spiked with LVFX.
The above findings demonstrate that understanding the differences in the diffusion rate and dissolution profile provides a strategy for using this gel formulation to mask the bitterness of some pharmaceutical ingredients.
Conclusion
This research study demonstrated that the drug-release functions of oral gel formulations containing naturally derived high-molecular-weight gels could be modulated by adjusting the combination ratio of Xa–Lo and Ag. Based on our findings in this study, our future efforts will be focused on developing strategies for the commercialization of products. These strategies include selecting drugs that can be realistically commercialized, designing control-release formulations suitable for maintaining the efficacy of such selected drugs, and elucidating the in vivo behaviors.
Conflict of Interest
The authors declare no conflict of interest.
References
- 1) Velmurugan S., Sundar V., Int. J. Chem. Pharm. Sci., 1, 1–12 (2010).
- 2) Abay F. B., Ugurlu T., J. Pharm. Drug Devel., 3, 1–8 (2015).
- 3) Ankita K., Pramod K. S., Nayyar P., Int. J. Pharm Sci. Res., 5, 92–95 (2014).
- 4) Prakruti M. A., Gangurde A. B., Pranali V. A., Ijppr. Human, 3, 183–203 (2015).
- 5) Dixit A. S., Parthasarathi K. K., Hosakote G. S., Curr. Drug Ther., 6, 79–86 (2011).
- 6) Katakam P., Varanasi M. S., Hwisa T. N., Assaleh H. F., Adiki K. S., Avula R. P., Asian J. Pharm., 8, 241–249 (2014).
- 7) Sassa R., Saito S., Ihori M., Unuma T., J. New Rem. & Clin., 44, 1139–1161 (1995).
- 8) Fukuda Y., Nishida N., Medicine and Drug Journal, 36, 178–181 (2000).
- 9) Takashima K., Mizuno Y., Arita K., Igarashi S., Ushioki Y., Jpn. J. Pharm. Health Care Sci., 30, 584–587 (2004).
- 10) Mukai H., Miyagawa S., Iwata M., Kamata H., Eto H., Jpn. Pharmacol. Ther., 29, 347–361 (2001).
- 11) Harada T., Yasuoka K., Sakurai M., Murase T., Owaki T., Yakugaku Zasshi, 135, 249–254 (2015).
- 12) Kaneko Y., Yoshida R., Sakai K., Sakurai Y., Okano T., J. Membr. Sci., 101, 13–22 (1995).
- 13) Huffman A. S., Afrassiabi A., Dong L. C., J. Control. Release, 4, 213–222 (1986).
- 14) Yoshida R., Sakai K., Okano T., Sakurai Y., Ind. Eng. Chem. Res., 31, 2339–2345 (1992).
- 15) Kost J., Horbett T. A., Ratner B. D., Singh M., J. Biomed. Mater. Res., 19, 1117–1133 (1985).
- 16) Ishihara K., Kobayashi M., Shionohara I., Macromol. Rapid Commun., 4, 327–331 (1983).
- 17) Kitano S., Kataoka K., Koyama Y., Okano T., Sakurai Y., Macromol. Rapid Commun., 12, 227–233 (1991).
- 18) Shiino D., Murata Y., Kataoka K., Koyama Y., Yokoyama M., Okano T., Sakurai Y., Biomaterials, 15, 121–128 (1994).
- 19) Dong L. C., Hoffman A. S., J. Control. Release, 15, 141–152 (1991).
- 20) Siegel R. A., Pitt C. G., J. Control. Release, 33, 173–188 (1995).
- 21) Baker J. P., Siegel R. A., Macromol. Rapid Commun., 17, 409–415 (1996).
- 22) Sawahata K., Hara M., Yasunaga H., Osada Y., J. Control. Release, 14, 253–262 (1990).
- 23) Kwon I. C., Bae Y. H., Okano T., Kim S. W., Berner B., Makromol. Chem., 33, 265–277 (1990).
- 24) Kwon I. C., Bae Y. H., Kim S. W., Nature (London), 354, 291–293 (1991).
- 25) Kawasaki N., Ohkura R., Miyazaki S., Uno Y., Sugimoto S., Attwood D., Int. J. Pharm., 181, 227–234 (1999).
- 26) Miyazaki S., Takahashi A., Itoh K., Ishitani M., Dairaku M., Togashi M., Mikami R., Attwood D., Drug Dev. Ind. Pharm., 35, 780–787 (2009).
- 27) Miyazaki S., Ishitani M., Takahashi A., Shimoyama T., Itoh K., Attwood D., Biol. Pharm. Bull., 34, 164–166 (2011).
- 28) Hishikawa Y., Kakino Y., Furukawa H., Tahara K., Takeuchi H., Kobunshi Ronbunshu, 72, 57–63 (2015).
- 29) Tokita M., Jpn. J. Appl. Phys., 34, 2418–2422 (1995).
- 30) Takamatsu R., Toko K., Takeguchi H., Kawabata A., Sensor Mater., 13, 179–187 (2001).
- 31) Uchida T., Kobayashi Y., Miyanaga Y., Toukubo R., Ikezaki H., Taniguchi A., Nishikata M., Matsuyama K., Chem. Pharm. Bull., 49, 1336–1339 (2001).
- 32) Whistler R. L., BeMiller J.N., “Industrial gums: Polysaccharides and their derivatives 3rd ed.,” Academic Press Inc., San Diego, CA, U.S.A., 1993, pp. 87–103.
- 33) Whistler R. L., BeMiller J.N., “Industrial gums: Polysaccharides and their derivatives,” 3rd ed., Academic Press Inc., San Diego, CA, U.S.A., 1993, pp. 205–215, 341–371.
- 34) Alain L. W., Hans B., “Allergic reactions to drugs,” Springer-Verlag, Berlin, 1983, p. 37.
- 35) International Programme on Chemical Safety (IPCS), INCHEM. “PARACETAMOL.”: ‹http://www.inchem.org/documents/icsc/icsc/eics1330.htm›, cited 16 November, 2015.
- 36) O’Neil M. J., Smith A., Heckelman P. E., Obenchain J. R. Jr., Gallipeau J. A. R., D’Arecca M. A., Budavari S., “The Merck Index,” 13th ed., Merck & Co., Inc., Whitehouse Station, NJ, U.S.A., 2001, p. 7746.
- 37) OECD GUIDELINE FOR THE TESTING OF CHEMICALS, No. 105. “Water Solubility” (Adopted by the Council on 27 July, 1995).: ‹http://www.oecd.org/chemicalsafety/risk-assessment/1948185.pdf›, cited 18 May, 2016.
- 38) Tanaka M., Otsuki M., Une T., Nishino T., J. Antimicrob. Chemother., 26, 659–666 (1990).
- 39) Fujimoto T., Mitsuhashi S., Chemotherapy, 36, 268–276 (1990).