Abstract
Pulmonary hypertension (PH) is a life-threatening lung disease. Despite the availability of several approved drugs, the development of a new treatment method is needed because of poor prognosis. Tissue selective drug delivery systems can avoid the adverse effects of current therapy and enhance efficacy. We evaluated the possibility of delivering drugs to the lungs of a PH rat model using fluorescence dye-labeled nanosized liposomes. To evaluate the tissue distribution following systemic exposure, fluorescent dye-labeled, 40–180 nm liposomes with and without polyethylene glycol (PEG) were intravenously administered to a monocrotaline-induced PH (MCT) rat model and tissue fluorescence was measured. Fluorescent dye-containing liposomes were intratracheally administered to the MCT model to evaluate the distribution of the liposome-encapsulated compound following local administration to reduce systemic exposure. The lung vascular permeability, plasma concentration of surfactant protein (SP)-D, lung reactive oxygen species (ROS) production, and macrophage marker gene cluster of differentiation (CD68) expression were measured. PEG and 80-nm liposome accumulation in the lung was elevated in the MCT model compared to that in normal rats. The intratracheally administered liposomes were delivered selectively to the lungs of the MCT model. The lung vascular permeability, plasma SP-D concentration, and CD68 expression were significantly elevated in the lungs of the MCT model, and were all significantly and positively correlated to liposome lung accumulation. Liposomes can accumulate in the lungs of an MCT model by enhancing vascular permeability by the inflammatory response. Therefore, drug encapsulation in liposomes could be an effective method of drug delivery in patients with PH.
Pulmonary hypertension (PH) is a life-threatening lung disease and there are 100000–200000 patients worldwide.1) Several drugs such as endothelin receptor antagonists, phosphodiesterase 5 inhibitors, prostaglandin I2 analogs, and soluble guanylate cyclase activator are available.1) However, the survival rate of patients with PH is still 6–7 years despite the availability of drug treatments.2) In the treatment of PH, the synthetic prostaglandin I2, epoprostenol, is widely used.3) However, because of its short half-life, the drug requires continuous intravenous administration, which has risk for the development of thrombosis and central venous catheter-related infections.3) Inhaled prostaglandin I2 analogs are also approved; however, frequent administration is needed because of their fast clearance from the lung.4,5) Lung selective drug delivery using drug delivery systems can improve the adverse effect incidence of current therapies and enhance efficacy.
Nanosized liposomes can accumulate in tissues such as inflammatory and cancer tissues after intravenous administration.6) The accumulation is mediated by permeable vasculature in the inflammatory and cancer tissue. The phenomenon is referred to as the enhanced permeability and retention (EPR) effect.7) Nanosized liposomal drugs have been developed to reduce systemic adverse effects such as liposomal doxorubicin, which shows higher tolerability in cancer treatment than doxorubicin alone does.8) The lung is rich in capillaries. Nanosized liposomes can accumulate in the lungs of patients with PH9) and, thus, lung selective drug delivery by the EPR effect can be expected under this condition. Moreover, lung targeting can be achieved using inhaled liposomes.10) For example, a clinical study using cisplatin encapsulated liposomes for lung cancer was conducted to obtain a selective lung effect.10)
Several studies have shown the possibility of using liposomal drugs for PH using the monocrotaline-induced PH (MCT) model. For example, the liposomal encapsulation of fasudil, a Rho kinase inhibitor, changed its pharmacokinetic (PK) parameters in an MCT model. Moreover, prolonged reduction of arterial pressure after intratracheal administration was reported.11–13) Liposomal encapsulation of a nitric oxide (NO) donor reduced its entry into the blood after intratracheal administration.14) Intravenously administered microRNA-145 (miR-145) encapsulated liposomes accumulated in the lungs of an MCT model.15)
The size and composition of liposomes, which are properties that affect their distribution, can be changed, and related information is useful for their optimization. However, the relationship between liposome composition and distribution in MCT models has been unclear. The whole tissue ex vivo imaging assay using fluorescent dye-labeled liposomes is a simple and sensitive method to evaluate the distribution of liposomes. In this study, we synthesized series of fluorescent dye-labeled or -encapsulated liposomes which can be suitable for imaging analysis of their tissue distribution. Using synthesized liposome, we clarified the relationship between the properties of liposomal and accumulation in the lungs of the MCT model. Moreover, we analyzed the relationship between liposome accumulation and the indexes associated with the EPR effect such as vascular characteristics and reactive oxygen species (ROS) was also evaluated using fluorescent or luminescent probes.
Experimental
Preparation of Dye-Labeled LiposomesThe compositions and properties of the liposomes are summarized in Table 1. Liposomes with particle sizes of 80 and 180 nm were prepared using a thin-film hydration method. A mixture of 1,2-distearoyl-sn-glycero-3-phosphocholine (DSPC, NOF Corp., Tokyo, Japan), cholesterol (Chol, Wako Pure Chemical Industries, Ltd., Osaka, Japan), and N-(carbonyl-methoxypolyethyleneglycol 5000)-1,2-distearoyl-sn-glycero-3-phosphoethanolamine (DSPE–PEG, NOF Corp.) was dissolved in methanol and ethanol (1 : 1, v/v) with 1,1′-dioctadecyltetramethyl indotricarbocyanine iodide (DiR, Thermo Fisher Scientific, Inc., MA, U.S.A.). The solvent was evaporated to dryness, and the lipid film was further dried overnight, and then hydrated in 9% sucrose–water solution to obtain liposomes with a phospholipid concentration of 20 mM. The resultant liposomes were reduced in size by extrusion through a series of polycarbonate membrane filters. Uranine (Fluorescein Sodium Salt, Wako Pure Chemical Industries, Ltd.) was loaded into the liposome without DiR using a remote loading method. In the loading method, Ca acetate was used as an internal phase of liposome because uranine is weak acid.16) The lipid thin film was hydrated in 300 mM Ca acetate at pH 6.8 with a concentration of 20 mM phospholipid. The resultant liposomes were reduced in size by the extrusion. The liposome was dialyzed by 9% sucrose–water solution using dialysis membrane (Slide-A-Lyzer Dialysis Cassette 20000MWCO, Thermo Fisher Scientific, Inc.). Uranine solution (10 mg/mL) was added into the liposome suspension in the same volume. The loading process was carried out at 50°C for 30 min because a phase transition temperature (Tm) of a mixture of the lipids (DSPC/Chol/DSPE–PEG=68/30/2) will be decreased from Tm of single DSPC (Tm=55°C). The uranine loaded liposome was dialyzed again by 9% sucrose–water solution to remove encapsulated uranine outside of the liposomes. The uranine liposome which was diluted by methanol–ethanol (1 : 1, v/v) was analyzed using HPLC and measured uranine concentration.
Table 1. Compositions and Properties of Liposome
| Name | Composition | Size (nm) | Fluorescent dye | ζ Potential (mV) |
|---|
| 40-nm PEG | POPC/Chol/DSPE–PEG=55/40/5 | 45.3 | DiR | −33.7 |
| 80-nm PEG | DSPC/Chol/DSPE–PEG=50/45/5 | 81.8 | DiR | −48.2 |
| 180-nm PEG | DSPC/Chol/DSPE–PEG=50/45/5 | 178.3 | DiR | −53.5 |
| 40-nm | POPC/Chol/DSPE–PEG=60/40/0 | 36.2 | DiR | 21.5 |
| 80-nm | DSPC/Chol/DSPE–PEG=55/45/0 | 79.6 | DiR | 28.1 |
| 180-nm | DSPC/Chol/DSPE–PEG=55/45/0 | 179.3 | DiR | 25.7 |
| Uranine liposome | DSPC/Chol/DSPE–PEG=68/30/2 | 89.2 | Uranine | −11.9 |
PEG, polyethylene glycol; POPC, 1-palmitoyl-2-oleoyl-sn-glycero-3-phosphocholine; DSPC, 1,2-distearoyl-sn-glycero-3-phosphocholine; Chol, cholesterol; DSPE–PEG, N-(carbonyl-methoxy polyethyleneglycol 5000)-1,2-distearoyl-sn-glycero-3-phosphoethanolamine.
Liposomes with a 40-nm particle size were prepared using a microfluidic injection method. A mixture of 1-palmitoyl-2-oleoyl-sn-glycero-3-phosphocholine (POPC, NOF Corp.), Chol, and DSPE–PEG was dissolved in methanol and ethanol (1 : 1 v/v) with DiR. The dissolved lipids in the organic solvent were then injected into a flow chemistry system (Syrris Ltd., Royston, U.K.). A 9% sucrose-water solution was also connected to the system. As the organic solvent in the lipid stream diffused and was diluted in the water stream, the lipids tended to assemble into liposomes in a micromixer chip. Stable liposomes were formed when the mixture reached equilibrium. The size distribution and zeta potential of the liposomes were analyzed using a dynamic light scattering method using a Zetasizer Nano (Malvern Instruments, Ltd., Malvern, U.K.). To evaluate the in vitro release profile of uranine from the liposomes, the residual uranine in the liposomes was measured after incubation with normal rat serum. The uranine/DSPC ratio of the liposome was analyzed using HPLC, and the Corona® Charged Aerosol Detector® (initial). Samples (liposome/serum, 1/9, v/v) were collected 0, 1, 2, 4, and 6 h after incubation and passed through a gel filtration column (prepacked disposable PD-10 columns). The filtered samples were also analyzed using HPLC and the Corona® Charged Aerosol Detector®. The residence time of uranine in the liposomes was evaluated by comparing the uranine/DSPC ratio of each time point to the initial value.
Preparation of MCT ModelMale wistar rats (7-week-old, CLEA Japan, Inc., Tokyo, Japan) were anesthetized with isoflurane (3%) and monocrotaline (60 mg/kg, Wako Pure Chemical Industries, Ltd.) dissolved in saline was subcutaneously administered. The dose of monocrotaline is set to 60 mg/kg because the dose is generally used to induce pulmonary hypertension within two weeks.17) Plasma surfactant protein (SP)-D level was measured 2 weeks after monocrotaline administration using an SP-D enzyme-linked immunosorbent assay (ELISA) kit (Yamasa Corp., Chiba, Japan) to monitor the level of lung injury.
Fluorescent Imaging AnalysisDiR-labeled liposomes (30–100 µg/kg DiR) were intravenously administered to the MCT rat model via the tail vein 24 h before the measurements. Then, tissue samples were placed into the light-tight chamber of the IVIS Spectrum imaging system (PerkinElmer, Inc., MA, U.S.A.) and imaged ex vivo. The fluorescence intensity of the DiR-labeled liposome in the lung, liver, kidney, and blood was measured at excitation and emission wavelengths of 710 and 760 nm, respectively. For measurement of vascular permeability, fluorescein isothiocyanate (FITC) albumin (50 mg/kg FITC albumin, Sigma-Aldrich Corp., Inc., MO, U.S.A.) was intravenously administered 2 h before the measurement. Fluorescence was measured at excitation and emission wavelengths of 465 and 520 nm, respectively. For measurement ROS production, the luminescent probe L-01218) (Wako Pure Chemical Industries, Ltd.) was intravenously administered at 25 mg/kg via the tail vein. Lung was isolated and imaged using the IVIS Spectrum ex vivo for 3 min. Data acquisition and analysis were performed using the Living Image Software (version 4.4., PerkinElmer, Inc.). The fluorescence and luminescence intensity of the region of interest (ROI) was quantified as average radiant efficiency. Gene expression of cluster of differentiation 68 (CD68) and glyceraldehyde 3-phosphate dehydrogenase (GAPDH) were measured by reported method19) and Taqman primer/probes (Thermo Fisher Scientific, Inc.), Rn01495634_g1 and Rn01775763_g1, respectively.
Intratracheal AdministrationUranine or uranine liposomes (95–230 µg/rat uranine) were intratracheally administered to the MCT model using a gavage needle that was inserted into the trachea under isoflurane (3%) inhalation. For administration, 0.1 mL of the solution was injected gently into the trachea. The fluorescence of tissue was imaged using the IVIS spectrum at excitation and emission wavelengths of 465 and 520 nm, respectively. To measure the lung uranine concentration, lung homogenates were prepared with a mixture of ethanol–methanol (1 : 1, v/v, 3 mL/tissue). For detection of plasma concentration of uranine, blood samples were periodically collected from the tail vein and centrifuged to collect plasma sample. Fluorescence intensity of the supernatant and plasma were determined using the fluorescence ALVO-HTS spectrophotometry (PerkinElmer, Inc.) at excitation and emission wavelengths of 485 and 535 nm, respectively.
Data Analysis for Fluorescent ImagingData analysis for imaging data was performed using the Living Image Software (version 4.4., PerkinElmer, Inc.). Data of the fluorescence and luminescence intensity of the ROI was quantified as average radiant efficiency [p/s/cm2/sr]/[μW/cm2]. To evaluate tissue change of accumulation in each tissue by size and surface modification, fluorescence of liver, lung and blood was normalized by average fluorescence of same tissue treated with 40-nm PEG-liposome. To evaluate the change of accumulation of liposome and FITC albumin in liver, kidney, lung, spleen and blood, tissue fluorescence was normalized by fluorescence of same tissue in normal rat. To evaluate correlation between liposome accumulation in lung and disease index, fluorescence of lung was normalized by fluorescence of lung normal rat.
Statistical AnalysisThe Student’s t-test was used to evaluate differences between two groups. Pearson’s correlation coefficient was used to measure the strength of the association between the two groups while the Bonferroni correction was used for multiple comparisons. p-values <0.05 were considered statistically significant.
Results
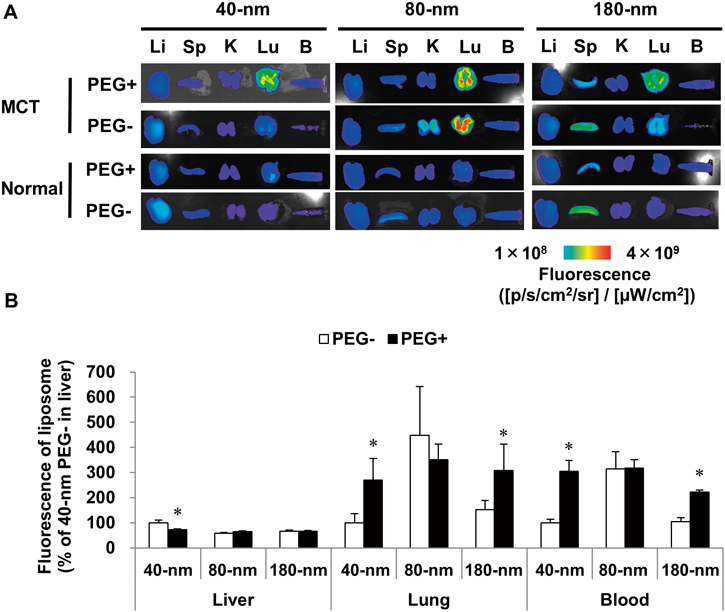
Accumulation of Liposomes in Lungs of MCT ModelA series of liposomes with different compositions and size was intravenously administered to the MCT model and normal rats to identify the appropriate formulation for efficient lung delivery. The tissue fluorescent value were normalized by average value of 40-nm liposome group (the value of lung, liver, blood were 2.8×10⁸, 4.3×10⁸, 3.5×10⁷ [p/s/cm2/sr]/[µW/cm2], respectively). In normal rats, all the liposomes did not accumulate in the lung. All the PEG liposomes with various particle sizes were accumulated in the lungs 24 h after administration. The 80- but not the 40- and 180-nm liposomes accumulated in the lungs of the MCT model. All sizes of the PEG and 80-nm liposome were retained in blood 24 h after administration (Figs. 1A, B). Liposomes with a 40-nm size showed higher accumulation than the 80-nm liposomes did in the liver (170.5% of 80-nm liposomes). Liposomes with a 180-nm size showed a higher accumulation in the spleen than the 80-nm liposomes did (193.6%, 80-nm liposome).
Relationship between Liposome Accumulation in Lungs and Vascular PermeabilityTo clarify the role of the EPR effect in liposome accumulation in the MCT model, the relationship between vascular permeability and liposome accumulation was determined using the same animals. The fluorescence intensity of the 40-nm liposomes and FITC albumin leakage was detected in the same sample (Fig. 2A). The tissue fluorescent value were normalized by average value of normal rat (the DiR fluorescence in liver, spleen, kidney, lung and blood were 1.8×10⁸, 5.3×10⁷, 4.5×10⁷, 8.6×10⁷, 3.7×10⁷ [p/s/cm2/sr]/[µW/cm2], respectively. The value of FITC fluorescence in liver, spleen, kidney, lung and blood were 2.9×10⁸, 5.3×10⁷, 5.2×10⁸, 2.3×10⁸, 4.1×10⁷ [p/s/cm2/sr]/[µW/cm2], respectively). Compared to the normal rats, a higher level of the 40-nm PEG liposomes and significantly elevated vascular permeability were detected in the lungs of the MCT model. In contrast, accumulation of 40-nm PEG liposomes and FITC albumin is increased in lung and did not increased in the liver, spleen, kidney, and blood of the MCT model (Figs. 2B, C). Vascular permeability was significantly and positively correlated with the accumulation of 40-nm PEG liposomes (Fig. 2D).
Relationship between Liposome Accumulation and Inflammation and Epithelium InjuryTo evaluate the importance of the inflammatory response in the accumulation of liposomes in the lung, the inflammatory index and liposome accumulation were compared to 40-nm PEG liposome accumulation. L-012, which is a luminescent probe for ROS,18) was intravenously administered to the MCT model and normal rats. L-012-derived lung luminescence was elevated in the MCT model (Fig. 3A) and increased to 264.9% of that of the normal rats (Fig. 3B). The luminescence was positively correlated to 40-nm PEG liposome accumulation (p=0.0679, Fig. 3C).
To evaluate the importance of macrophage infiltration, the gene expression of the macrophage marker CD68 was measured in the MCT model. Compared to that in the normal rats, CD68 expression in the lung was significantly elevated in the MCT model (Fig. 3D). CD68 expression was significantly and positively correlated with the accumulation of 40-nm PEG liposomes (Fig. 3E).
To clarify the importance of epithelial injury in liposome accumulation in the lung, the plasma concentration of SP-D was measured in the MCT model. SP-D is secreted from type 2 alveolar epithelial cells and known as a plasma biomarker of epithelium injury in the lungs.20) The plasma SP-D concentration was significantly elevated in the MCT model (Fig. 3F) and the levels were significantly and positively correlated with accumulation of the 40-nm PEG liposomes in the lungs (Fig. 3G).
Lung Targeting of Liposomes after Intratracheal AdministrationThe intratracheal administration of a liposome-encapsulated drug is an effective method to deliver drugs to the lungs. Uranine was retained in the liposomes at least 6 h in vitro (Fig. 4A). To evaluate the liposomal distribution in the lungs of the MCT model, uranine (pure drug and liposomes, 230 µg/rat) were intratracheally administered to the MCT model. The fluorescence was then evaluated 4 h after administration. Compared to that of uranine alone, higher fluorescence intensity was observed in the lungs of the uranine liposome group than in the unformulated uranine-treated group. To evaluate the residence time of uranine, its concentration was measured in the MCT model rats treated with uranine drug alone and the uranine liposomes (Figs. 4B, C). Compared to the uranine alone group, higher uranine concentrations were detected in the lungs of the uranine liposome group at 0.25, 1, and 3 h after intratracheal administration (Fig. 4D).
The residence time in the blood was examined for uranine alone and uranine liposome. Intratracheal administered uranine alone was rapidly cleared from the blood (Fig. 4E). On the other hand, prolonged residence of uranine in blood was observed in uranine liposome group (Fig. 4F). Moreover, dose normalized maximum serum concentration of uranine is lower in uranine liposome group than in uranine alone group. PK parameters are summarized in Table 2.
Table 2. The Pharmacokinetic (PK) Parameters of Uranine and Liposomal Encapsulated Uranine
| Uranine (µg/rat) | Uranine liposome (µg/rat) |
|---|
| 95 | 123.4 |
|---|
| Mean | S.D. | Mean | S.D. |
|---|
| Cmax | (ng/mL) | 434.4 | 125.6 | 190.1 | 54.4 |
| Cmax/Dose | | 4.6 | 1.3 | 1.5 | 0.4 |
| Tmax | (h) | 0.5 | 0.0 | 4.0 | 0.0 |
| AUC0–24h | (ng/[h·mL]) | 1479.7 | 359.1 | 2082.2 | 611.3 |
| AUC0–24h/Dose | | 15.6 | 3.8 | 16.9 | 5.0 |
| MRT | (h) | 4.74 | 0.65 | 6.90 | 0.12 |
Cmax, maximum serum concentration; Tmax, time to reach; Cmax, AUC, area under the blood concentration–time curve; MRT, mean residence time; n=3.
Discussion
In this study, we evaluated nanosized liposomal distribution in an MCT model using ex vivo imaging. Our results demonstrated that ex vivo imaging assay showed adequate sensitivity in the quantitative analysis for the development of liposome in the MCT model. By evaluating liposomes with different compositions and sizes, we found that liposomes with a prolonged residence time in the blood can accumulate in the lungs of the MCT model. A long residence in the blood circulation is required for the EPR effect. Liposomes are removed from circulation by the mononuclear phagocyte system (MPS, reticuloendothelial system).21) In the MPS, serum opsonins such as the third component of the complement system bind to liposomes. Then, resident macrophages in the liver and spleen remove the liposomes from circulation. Modification by PEG provides liposomes with a barrier that prevents the attachment to plasma proteins and recognition by cells of the MPS.21,22) PEG liposomes showed a long residence time in the circulation by avoiding the MPS in the MCT model. Generally, PEG liposome is gradually incorporated into MPS and removed from blood. In this study, PEG liposome was observed in blood 24 h after administration. Previous reports showed that PEG liposome is detected 24 and 48 h after intravenous administration.21) Our results matched to previous results.
For the liposomes without PEG, our results suggest that a long residence was achieved because of their size and phospholipid component. Our results showed that the 80-nm DSPC based liposomes were retained in the blood without accumulating in the liver and spleen. In a previous study using normal mice, liposomes were distributed in the blood in a bell-shaped and size-dependent manner. Small sized (<70 nm) liposomes accumulated in the liver. Moreover, increasing the liposome size enhanced its accumulation in the spleen.23) The liposome with 110 nm size showed long residence in blood by avoiding accumulation in liver and spleen.23) In addition, more rigid membrane bilayer which is depending on transition temperature (Tm) of phospholipid component increases a resists penetration of serum opsonins. The rigid liposome tends to be stable in the circulation and show a long residence.24)
One of the reasons why the 40-nm liposomes were incorporated in the liver is the pore size of the liver sinus hole, which is estimated to be 110 nm.25) And, POPC (Tm=−2°C) based liposome tends a short residence because of serum opsonins rather than DSPC (Tm=55°C) based liposome. On the other hand, 180-nm DSPC based liposomes can be retained in the splenic sinusoidal filter, which acts as a filter to remove aged red blood cells.26) A histological study showed that large liposomes accumulated in the red pulp, which is the network composed of reticular cells.27) Our results for accumulation of 40- and 180-nm liposome in liver and spleen were in agreement with those of a previous study. The 80-nm liposomes achieved a long residence in the circulation by avoiding the liver sinus hole and spleen and splenic sinusoidal filter incorporation. After circulation, 80-nm liposome can be incorporated in lung MPS which is composed by alveolar macrophage28) in MCT model. Our data showing elevation of expression of CD68, which is macrophage marker gene, suggests that lung MPS is activated in MCT model and contribute to liposome accumulation.
Our result also demonstrated that the accumulation of liposomes in the lungs of the MCT model was significantly and positively correlated to the vascular permeability. Enhancement of the vascular permeability is an important mechanism for delivering liposomes to target tissues.29) The correlation between vascular permeability and liposome accumulation suggests that the EPR effect played an important role in the accumulation of liposomes in the MCT model.
Using ex vivo imaging, we detected a correlation between liposome accumulation and inflammatory responses by measuring the L-012 derived luminescence. To the best of our knowledge, this is the first study to use an L-012 probe to analyze the MCT model. As shown in the various tissues, macrophage infiltration and ROS production also had an important role in enhancing the vascular permeability in the MCT model.30–33) The correlation between the plasma SP-D and liposome accumulation suggests that lung injury could be an important factor in the accumulation of liposomes in the lungs of the MCT model.
We confirmed that the encapsulation of uranine in liposomes with PEG changed their PK profile after intratracheal administration. One mechanism underlying this change is the slow release of uranine by liposomal encapsulation. In the lungs, alveolar macrophages act as MPS to incorporate and digest the inhaled liposomes in the alveolar lining fluid.29) Our study has not evaluated the difference between MCT model and normal rat. However, previous report showed that intratracheally administered liposome was highly accumulated lipopolysaccharide-treated rat, which showed incorporation of white blood cell into lung.34) Based on our results which demonstrated that macrophage marker genes was elevated in MCT model, accumulation of liposome in lung of MCT model can be elevated compared to normal rat.
A previous report showed that liposomes with PEG exhibited a prolonged residence time in the alveolar lining fluid of normal rats because their clearance was suppressed by alveolar macrophages.22) In the MCT model, we confirmed that the macrophage marker was elevated, and the PEG-containing liposomes were available for the encapsulation of compounds.
To the best of my knowledge, the accumulation of liposome in PH patients has not been evaluated. However, clinical study using nanoparticle-mediated drug delivery in PH patients is completed (UMIN000014940).35,36) The information obtained by this study can be useful information for future development of nanoparticle-mediated drug delivery in PH patients.
In this study, we demonstrated that liposomes with a long residence time in the blood were accumulated in the MCT model, and this was mediated by the EPR effect. Encapsulation of compound in liposomes can lower their systemic exposure and increase their residence time in target tissues. Therefore, encapsulation of drugs in nanosized liposomes could be useful drug delivery system for targeting the lungs of patients with PH.
Acknowledgments
We sincerely appreciate Masatoshi Hazama and Sham Nikam (Takeda Pharmaceutical Company Ltd.) for supervising and providing useful advice for these experiments. We also really appreciate Yutaka Nishimoto and Yusuke Murakawa (Takeda Pharmaceutical Company Ltd.) for technical advice on these experiments.
Conflict of Interest
All authors are employees of Takeda Pharmaceutical Company Limited.
References
- 1) Rosenzweig E. B., Expert Opin. Emerg. Drugs, 11, 609–619 (2006).
- 2) Sardana M., Moll M., Farber H. W., Expert Opin. Investig. Drugs, 24, 1571–1596 (2015).
- 3) O’Connell C., Amar D., Boucly A., Savale L., Jais X., Chaumais M. C., Montani D., Humbert M., Simonneau G., Sitbon O., Drug Saf., 39, 287–294 (2016).
- 4) Olschewski H., Simonneau G., Galie N., Higenbottam T., Naeije R., Rubin L. J., Nikkho S., Speich R., Hoeper M. M., Behr J., Winkler J., Sitbon O., Popov W., Ghofrani H. A., Manes A., Kiely D. G., Ewert R., Meyer A., Corris P. A., Delcroix M., Gomez-Sanchez M., Siedentop H., Seeger W., Aerosolized Iloprost Randomized Study Group, N. Engl. J. Med., 347, 322–329 (2002).
- 5) Saji T., Myoishi M., Sugimura K., Tahara N., Takeda Y., Fukuda K., Olschewski H., Matsuda Y., Nikkho S., Satoh T., Circ. J., 80, 835–842 (2016).
- 6) Ajorlou E., Khosroushahi A. Y., Cancer Chemother. Pharmacol., 79, 251–265 (2017).
- 7) Nakamura Y., Mochida A., Choyke P. L., Kobayashi H., Bioconjug. Chem., 27, 2225–2238 (2016).
- 8) Marchal S., El Hor A., Millard M., Gillon V., Bezdetnaya L., Drugs, 75, 1601–1611 (2015).
- 9) Vaidya B., Gupta V., J. Control. Release, 211, 118–133 (2015).
- 10) Rudokas M., Najlah M., Alhnan M. A., Elhissi A., Med. Princ. Pract., 25 (Suppl 2), 60–72 (2016).
- 11) Gupta V., Gupta N., Shaik I. H., Mehvar R., McMurtry I. F., Oka M., Nozik-Grayck E., Komatsu M., Ahsan F., J. Control. Release, 167, 189–199 (2013).
- 12) Nahar K., Absar S., Gupta N., Kotamraju V. R., McMurtry I. F., Oka M., Komatsu M., Nozik-Grayck E., Ahsan F., Mol. Pharm., 11, 4374–4384 (2014).
- 13) Nahar K., Absar S., Patel B., Ahsan F., Int. J. Pharm., 464, 185–195 (2014).
- 14) Nahar K., Rashid J., Absar S., Al-Saikhan F. I., Ahsan F., Pharm. Res., 33, 1696–1710 (2016).
- 15) McLendon J. M., Joshi S. R., Sparks J., Matar M., Fewell J. G., Abe K., Oka M., McMurtry I. F., Gerthoffer W. T., J. Control. Release, 210, 67–75 (2015).
- 16) Zucker D., Marcus D., Barenholz Y., Goldblum A., J. Control. Release, 139, 73–80 (2009).
- 17) Deng Y., Wu W., Guo S., Chen Y., Liu C., Gao X., Wei B., Respir. Res., 18, 53 (2017).
- 18) Asghar M. N., Emani R., Alam C., Helenius T. O., Gronroos T. J., Sareila O., Din M. U., Holmdahl R., Hanninen A., Toivola D. M., Inflamm. Bowel Dis., 20, 1435–1447 (2014).
- 19) Muraki Y., Makita Y., Yamasaki M., Amano Y., Matsuo T., Biochem. Biophys. Res. Commun., 486, 632–638 (2017).
- 20) Greene K. E., King T. E. Jr., Kuroki Y., Bucher-Bartelson B., Hunninghake G. W., Newman L. S., Nagae H., Mason R. J., Eur. Respir. J., 19, 439–446 (2002).
- 21) Allen T. M., Hansen C., Martin F., Redemann C., Yau-Young A., Biochim. Biophys. Acta, 1066, 29–36 (1991).
- 22) Kaneko K., Togami K., Yamamoto E., Wang S., Morimoto K., Itagaki S., Chono S., Drug Deliv. Transl. Res., 6, 565–571 (2016).
- 23) Liu D., Mori A., Huang L., Biochim. Biophys. Acta, 1104, 95–101 (1992).
- 24) Drummond D. C., Meyer O., Hong K., Kirpotin D. B., Papahadjopoulos D., Pharmacol. Rev., 51, 691–743 (1999).
- 25) Kraft J. C., Freeling J. P., Wang Z., Ho R. J., J. Pharm. Sci., 103, 29–52 (2014).
- 26) Rosse W. F., N. Engl. J. Med., 317, 704–706 (1987).
- 27) Liu D., Mori A., Huang L., Biochim. Biophys. Acta, 1066, 159–165 (1991).
- 28) Gustafson H. H., Holt-Casper D., Grainger D. W., Ghandehari H., Nano Today, 10, 487–510 (2015).
- 29) Maeda H., Nakamura H., Fang J., Adv. Drug Deliv. Rev., 65, 71–79 (2013).
- 30) Mehta D., Ravindran K., Kuebler W. M., Am. J. Physiol. Lung Cell. Mol. Physiol., 307, L924–L935 (2014).
- 31) Kratzer E., Tian Y., Sarich N., Wu T., Meliton A., Leff A., Birukova A. A., Am. J. Respir. Cell Mol. Biol., 47, 688–697 (2012).
- 32) Trocme C., Deffert C., Cachat J., Donati Y., Tissot C., Papacatzis S., Braunersreuther V., Pache J. C., Krause K. H., Holmdahl R., Barazzone-Argiroffo C., Carnesecchi S., J. Pathol., 235, 65–78 (2015).
- 33) Fang J., Sawa T., Maeda H., Adv. Exp. Med. Biol., 519, 29–49 (2003).
- 34) Herber-Jonat S., Mittal R., Gsinn S., Bohnenkamp H., Guenzi E., Schulze A., Inflamm. Res., 60, 245–253 (2011).
- 35) Nakamura K., Matsubara H., Akagi S., Sarashina T., Ejiri K., Kawakita N., Yoshida M., Miyoshi T., Watanabe A., Nishii N., Ito H., J. Clin. Med., 6, 48 (2017).
- 36) da Silva A. L., Cruz F. F., Rocco P. R. M., Morales M. M., Biophys. Rev., 9, 793–803 (2017).