Abstract
The mechanical strain distribution of scored tablets was simulated using the finite element method (FEM). The score was fabricated as a triangular runnel with the pole on the top surface of flat tablets. The effect of diametral compression on the tablet surface strain was evaluated by changing the angle between the scored line and the diametral compression axis. Ten types of granules were prepared according to an extreme vertices design. Young’s modulus and the Poisson ratio for the model powder bed were measured as elastic parameters. The FEM simulation was then applied to the scored tablets represented as a continuous elastic model. Strain distributions in the inner structure of the tablets were simulated after the application of external force. The maximum principal strain (ε1) value was obtained with tablets containing a large amount of corn starch, in all scored line positions. In contrast, the ε1 value of the tablets containing a large amount of microcrystalline cellulose was minimal. The adequacy of the simulation was evaluated by experiments with scored tablets. The results indicated a fairly good agreement between the FEM simulation and experiments. Moreover, it was found that the ε1 value correlated negatively with the value of tablet hardness. These results suggest that the FEM simulation was advantageous for designing scored tablets.
There is a growing expectation that the finite element method (FEM) can be effective in pharmaceutical design.1,2) FEM is a numerical technique for solving complicated systems that is well known to scientists and engineers. By applying FEM, we can understand the physical behaviors of a complex object and predict the performance of a design such as the tableting process2–5) and strength simulation.6–8)
The response surface method (RSM) is used to model the relationships between design variables and pharmaceutical responses.9,10) A nonlinear RSM incorporating thin-plate spline interpolation (RSM-S) has been developed to determine the acceptable formulations of pharmaceutical compounds.11) The RSM-S approach enables us to understand better the causal relationships in pharmaceutical design and to estimate a robust optimal formulation and process parameter.12–14)
Tablets should be sufficiently strong to hold together during postcompaction operations, packaging, storage, and use. To evaluate whether tablets have sufficient strength, their hardness is measured by diametral compression during pharmaceutical development. In this test, the tablet is enclosed from both sides, and load is applied gradually. Then, tablets are crushed along their central lines. The maximum crush force is considered to be the tablet hardness. When tablets have a breaking line, large differences in stress distributions are observed, depending on the position of the line during hardness testing.15) This consideration is important for quality control, because the position of the breaking line could lead to large increases in the variations of tablet hardness. However, the relationship between FEM results and tablet hardness has not been sufficiently validated in the past. Moreover, the influence of tablet formulation and the shape of the breaking line on stress distributions during hardness testing has not been determined. Therefore, the purpose of this study was to explore differences in stress distribution between these design variables using FEM. We also aimed to determine any relationships between FEM results and tablet hardness using RSM-S. To achieve this, we prepared 10 types of tablets by a wet granulation compression method according to the extreme vertices design and measured the elastic parameters of each type of granule. Subsequently, we simulated the mechanical strain distribution of tablets using FEM. The depths and angles of the score were changed as design variables. Then, RSM-S was applied to reveal any causal relationships between design variables and strain in each tablet simulated by FEM. Finally, the relationship between strain and tablet hardness was evaluated.
Experimental
MaterialsLactose (LAC; Tablettose 80) was purchased from Meggle Japan Co., Ltd. (Tokyo, Japan), cornstarch (CS; Graflow M) from Nippon Starch Chemical Co., Ltd. (Osaka, Japan), and microcrystalline cellulose (MCC; Ceolus PH-101) from Asahi Kasei Chemicals Co., Ltd. (Tokyo, Japan). Low-substituted hydroxypropyl cellulose (L-HPC; LH-21) was a gift from Shin-Etsu Chemical Co., Ltd. (Tokyo, Japan). Polyvinylpyrrolidone K90 (PVP K90) was a gift from Nippon Shokubai Co., Ltd. (Osaka, Japan). Magnesium stearate (Mg–St) was purchased from Wako Pure Chemical Industries, Ltd. (Osaka, Japan).
Preparation of Granules and Scored TabletsWe accurately weighed a total quantity of 189 g of LAC, CS, and MCC, 4 g of PVP K90 as a binder, and 6 g of L-HPC as a disintegrant, and blended all excipients, with the exception of Mg–St, using a mixer (KM4005, De Longhi, Treviso, Italy) for 1 min. Purified water equivalent to 30% of the powder mixture by weight was added as the granulation liquid, and the mixture was blended using the same mixer (impeller speed, 470 rpm; blending time, 5 min). After the granulation process, the granules were sieved through a 5.8-mm mesh and dried at 75°C for 60 min. The granules were then separated using a series of sieves of 250–710 µm pore size. Mg–St (0.5% of the granule weight) was added, and the mixture was blended using a V-type mixer (S-3, Tsutsui Scientific Instruments Co., Ltd., Tokyo, Japan) for 2 min. Next, 200 mg of the final blend was compressed at 4 kN into flat-faced scored tablets, 8 mm in diameter, using a hydraulic press (Model PCH-20, NPa System Co., Ltd., Warabi, Saitama, Japan). Twelve types of scores were fabricated on the flat-faced tablets by changing the depth (h=0.50, 0.75, 1.00, and 1.50 mm) and the angle (θ=45°, 60°, and 75°).
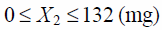
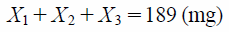
Experimental DesignVarying amounts of MCC (X1), CS (X2), and LAC (X3) in each tablet were selected as formulation factors. The lower and upper limits of the levels of each factor were set as follows.
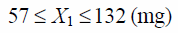 | (1) |
 | (2) |
 | (3) |
 | (4) |
Therefore, the feasible experimental region in the simplex lattice design had a trapezoidal shape. The formulation factors were assigned and prepared according to an extreme vertices design, including a duplicate of the centroid.16)
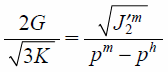
Determination of Elastic ParametersYoung’s modulus (E) and Poisson rate (ν) were determined from the unloading curve of a die compaction experiment. The axial upper/lower punch forces and displacements and the radial die-wall pressure were measured during compaction using an instrumented hydraulic press (TK-TB20KN, Tokushu Keisoku Co., Ltd., Yokohama, Japan). The E and ν values were calculated based on the variation of axial stress with volume strain (εZ) and the stress path during the compaction of granules. The stress path is shown by a scatter plot in which the x and y-axes show the equivalent hydrostatic pressure stress (p) and the square root of the second invariant of the deviatoric stress  plane, respectively. The εZ value was defined as a ratio of the powder height during compaction (Z) to Z0: εZ=|ln(Z/Z0)|.17) The bulk modulus K and shear modulus G were defined as:
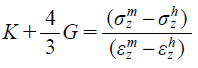 | (5) |
 | (6) |
where the superscripts
m and
h denote the values at points when the compression pressure indicates the maximum value and

is 0, respectively. Knowing the
K and
G values, the
E and ν values can be determined from the following.
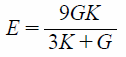 | (7) |
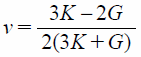 | (8) |
Excellent descriptions of measuring E and ν have been published.4,18)
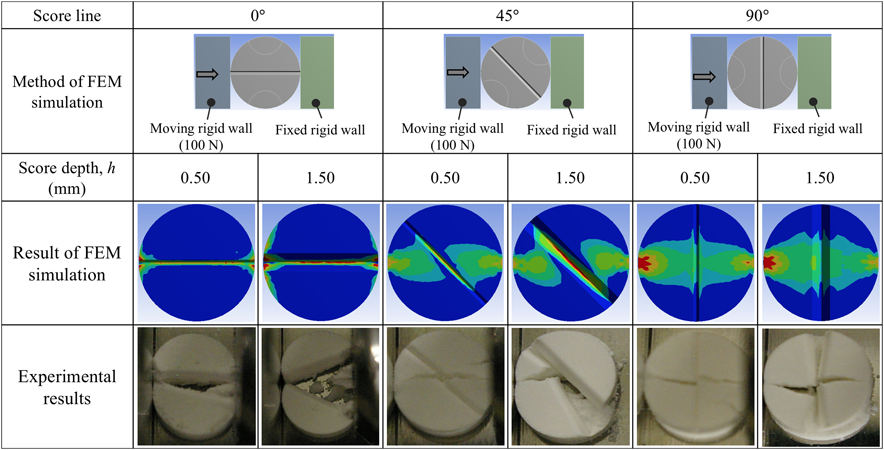
FEM SimulationIn the initial stage of loading the external force to the tablet, we hypothesized that the tablet could be represented as a continuum in an elastic model. Although the elastic parameter is varied as a function of tablet density,3) it was considered as a constant value in this study. This continuum elastic model has been used widely in the simulation of diametral compression, and the results obtained are reasonable.15,19) The FEM was applied to estimate the principal stresses generated at the top and lateral surfaces and along the scored lines of the tablets. To avoid generating a singular point, the shape of the score tip was set to be a fillet surface. Strain distribution was simulated after the application of external forces such as a bending stress and diametral compression. The methods for application of these external stresses to the scored tablet are illustrated schematically in Fig. 1. The scored tablet was compressed against a rigid wall by moving the other side horizontally at 100 N, and the angles of the scored line to the diametral compression axis were set at 0°, 45°, or 90°. Strain distributions on the top surface were estimated using the FEM simulation.
Determination of Tablet CharacteristicsThe breaking strength of scored tablets and tablet hardness were determined using a portable hardness checker (PC-30, Okada Seiko Co., Ltd., Tokyo, Japan). The tablet was mounted on the checker, and the angles of the scored line to the diametral compression axis were set at 0°, 45°, or 90°.
Computer ProgramsThe FEM analysis of the tablet property was performed using ANSYS® version 16.0 (ANSYS Inc., Canonsburg, PA, U.S.A.). The RSM-S was applied to generate response surfaces and was performed using data NESIA® version 3.2 (Azbil Corporation, Fujisawa, Japan).
Results and Discussion
Simulation of Diametral CompressionTo perform FEM simulation, the scored tablet was represented as a continuum elastic model. The Young’s modulus (E) and Poisson rate (ν) of the test formulations were calculated from the stress–strain curve during the tableting process. These parameters, summarized in Table 1, were fed into a computer for the FEM simulation. The principal strains are defined as the strain tensor elements when the three-dimensional strain coordinate is rotated so that the shear strain components become zero. They are represented as maximum (ε1), intermediate (ε2), and minimum (ε3) principal strains. In this study, we employed the ε1 value as representative of the strain generated after applying an external force to the tablets. Generally, when elastic model is applied, strains are correlated with external force and tablet does not break in FEM analysis. In the preliminary test, it was confirmed that when an external force was set at lower than 100 N, similar tendency was obtained although absolute values varied by an external force.
Table 1. Elastic Modules of All Formulations
| Rp. | Young’s modulus (GPa) | Poisson rate |
|---|
| 1 | 2.95±0.06 | 0.1624±0.0019 |
| 2 | 4.13±0.06 | 0.1492±0.0010 |
| 3 | 2.03±0.00 | 0.1454±0.0001 |
| 4 | 3.48±0.05 | 0.1621±0.0152 |
| 5 | 3.43±0.04 | 0.1679±0.0197 |
| 6 | 2.56±0.03 | 0.1605±0.0019 |
| 7 | 2.73±0.08 | 0.1354±0.0050 |
| 8 | 3.81±0.09 | 0.1807±0.0246 |
| 9 | 2.80±0.02 | 0.1543±0.0114 |
| 10 | 2.76±0.04 | 0.1562±0.0030 |
Each value represents the mean±S.D. for three determinations.
Typical examples of the distribution of ε1 values estimated by the breaking strength simulation are shown in Fig. 1. When the angle of the scored line to the breaking force was set at 90°, the horizontal strain increased. Turning the angle of the scored line to 45° resulted in an ε1 value being generated along the scored line. As the score depth increased, this tendency increased. It is likely that the potential strain generated along the scored line is closely related to the breaking strength of the tablets. When the angle of the scored line was changed to 0°, a very strong ε1 value appeared only on the scored line. Similar phenomena were seen regardless of differences in the score depth, although the absolute value of the strain on the scored line increased with increasing score depth. The strain decreased markedly when the angles of the scored line to the diametral compression axis were changed to 45° and 90°. These findings coincided fairly well with the results reported by Podczeck et al.,15,20) who suggested that considerable differences in stress distribution appeared depending on the angle of the scored line to the diametral compression axis. The stress values at failure were predicted to be similar for tablets tested at an angle of 45° or above, whereas at lower test angles, the predicted breaking loads were up to three times greater. Comparisons of FEM simulations with actual experiments are described in the next section.
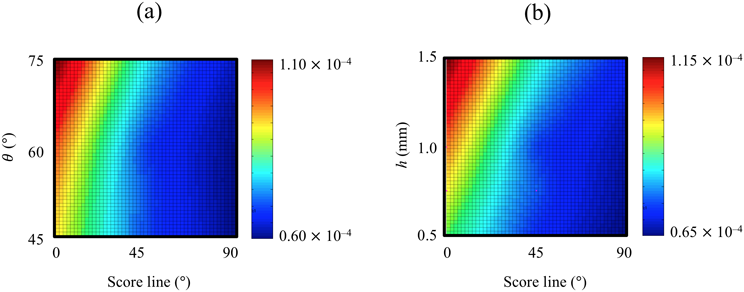
To visualize the relationships between the ε1 values and various factors, the response surfaces for the ε1 values were estimated by RSM-S. Figures 2a and 2b show the ε1 values of Rp. 1 modeled as a function of the angle of the scored line to the compression axis, the score angle, and the score depth. The response surface showed that the ε1 value was strongly dependent on the angle of the score line to the compression axis and deceased as the angle increased from 0° to 45° to 90°. The ε1 value was also affected by the score angle (Fig. 2a) and the score depth (Fig. 2b). The ε1 value increased with increasing score angle and score depth.
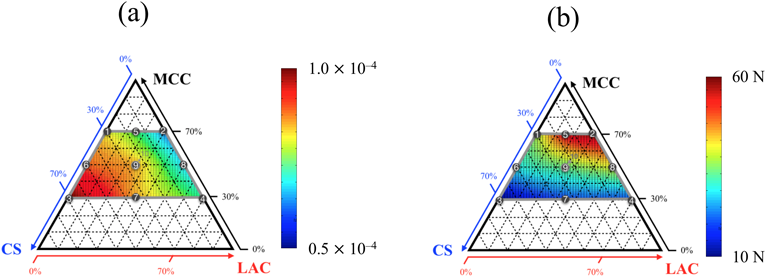
Figure 3a shows the response surface on which the ε1 was modeled as a function of formulation factors when the angle of the scored line to the compression axis, the score angle, and the score depth were set at 45°, 60°, and 0.75 mm, respectively. The maximum ε1 value was obtained with Rp. 3, which contained a large amount of CS, in all scored line positions. In contrast, the ε1 value of Rp. 2, which contained a large amount of MCC, was minimal. It is considered that the strain in Rp. 3 was the highest because it had the smallest value for the Young’s modulus. Although Figs. 2 and 3a show typical examples, similar results were obtained from the other formulations and conditions.
Experimental Validation of FEM SimulationThe lowest rows in Fig. 1 show the breaking behaviors for three test angles of the scored tablets. The experimental results were similar to those of the simulations. When the angle of the scored line to the diametral compression axis was 0°, regardless of the depth and angle of the score, the cracks appeared to initiate at the scored line in the direction of compression. When the angle of the scored line was changed to 45° at a score depth of 0.50 mm, the cracks propagated in the direction of compression. In contrast, with a score depth of 1.50 mm, the cracks not only appeared in the direction of the compression but also approached the score line. A similar tendency was observed when the score angle was much wider. When the angle of the scored line to the diametral compression axis was changed to 90°, regardless of the score shape, horizontal cracks appeared on the compression axis.
To compare the relationships between the ε1 value and tablet hardness, the response surface of tablet hardness was estimated using RSM-S. Typical examples are shown in Fig. 3b. The lowest tablet hardness value was observed with Rp. 3, which contained a large amount of CS, while the highest was observed with Rp. 2, which contained a large amount of MCC. The tablet hardness correlated negatively with the value of ε1.
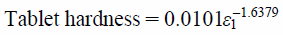
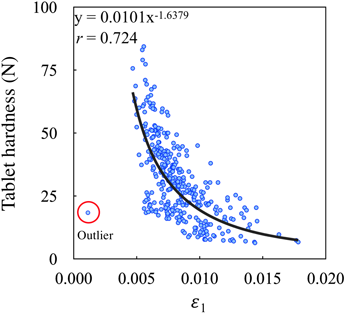
To investigate the quantitative relationships between ε1 values and tablet hardness, a scatter plot was made using 360 types, with differences in the formulations, the angles of the score line to the compression axis, the score angles, and the score depths (Fig. 4). Regression analysis revealed that the correlation coefficient of the power equation (r=0.724) was better than those of linear (r=0.667), polynomial (r=0.719), and exponential equations (r=0.711). Outliers, which might be derived from errors in the FEM analysis, were excluded from regression analyses. The best fitting power equation was as follows.
This result revealed that the least deformable tablet had the greatest hardness. Therefore, this result is considered to be reasonable, although a large variation was observed in the regression analyses. Such regression errors might arise from a simple FEM model because each tablet was considered as a uniform elastic model in this study regardless of whether the tablet’s inner structure—such as density and stress distribution—was inhomogeneous.3) Moreover, although the ε1 was considered as an explaining variable in this study, multivariate analysis—in which all strains of inner tablet are considered as explaining variables—could increase prediction accuracy.21,22) These approaches might enable us to predict in silico tablet hardness of arbitrary formulation and shape accurately.
Conclusion
We investigated the mechanical strain on the top surface of scored tablets after application of external forces by using the FEM simulation. For diametral compression, considerable differences were observed in the strain distribution, depending on the angle of the score line to the diametral compression axis: 0°, 45°, or 90°. The strain values increased with increasing score depth. The FEM simulation was validated by the experimental data. Moreover, we found that the value of ε1 obtained from FEM simulation was negatively correlated with tablet hardness, suggesting that the FEM simulation was advantageous for designing scored tablets. We conclude that such FEM simulation is useful for achieving an objective understanding of the pharmaceutical characteristics of scored tablets.
Acknowledgments
This study was supported by the Japan Society for the Promotion of Science (JSPS) KAKENHI Grant Numbers JP16K08192 and JP17K08192. This study was also supported by Tamura Science Foundation and JSPS Core-to-Core Program, B. Asia-Africa Science Platforms.
Conflict of Interest
The authors declare that they have no financial or noncompeting interests concerning this manuscript. The Department of Pharmaceutical Technology, University of Toyama, is an endowed department, supported by an unrestricted Grant from Nichi-Iko Pharmaceutical Co. (Toyama, Japan).
References
- 1) Han L. H., Elliott J. A., Bentham A. C., Mills A., Amidon G. E., Hancock B. C., Int. J. Solids Struct., 45, 3088–3106 (2008).
- 2) Sinka I. C., Cunningham J. C., Zavaliangos A., J. Pharm. Sci., 93, 2040–2053 (2004).
- 3) Cunningham J. C., Sinka I. C., Zavaliangos A., J. Pharm. Sci., 93, 2022–2039 (2004).
- 4) Michrafy A., Ringenbacher D., Tchoreloff P., Powder Technol., 127, 257–266 (2002).
- 5) Michrafy A., Diarra H., Dodds J. A., Michrafy M., Penazzi L., Powder Technol., 208, 417–422 (2011).
- 6) Mazel V., Diarra H., Busignies V., Tchoreloff P., J. Pharm. Sci., 103, 1305–1308 (2014).
- 7) Mazel V., Guerard S., Croquelois B., Kopp J. B., Girardot J., Diarra H., Busignies V., Tchoreloff P., Int. J. Pharm., 513, 669–677 (2016).
- 8) Podczeck F., Drake K. R., Newton J. M., Int. J. Pharm., 454, 412–424 (2013).
- 9) Huang Y.-B., Tsai Y.-H., Yang W.-C., Chang J.-S., Wu P.-C., Biol. Pharm. Bull., 27, 1626–1629 (2004).
- 10) Giry K., Viana M., Genty M., Wüthrich P., Chulia D., Wüthrich P., Chulia D., Drug Dev. Ind. Pharm., 36, 1016–1026 (2010).
- 11) Takayama K., Obata Y., Morishita M., Nagai T., Pharmazie, 59, 392–395 (2004).
- 12) Obata Y., Ashitaka Y., Kikuchi S., Isowa K., Takayama K., Int. J. Pharm., 399, 87–93 (2010).
- 13) Onuki Y., Morishita M., Takayama K., J. Control. Release, 97, 91–99 (2004).
- 14) Hayashi Y., Oshima E., Maeda J., Onuki Y., Obata Y., Takayama K., Chem. Pharm. Bull., 60, 1419–1425 (2012).
- 15) Podczeck F., Newton J. M., Fromme P., Int. J. Pharm., 477, 306–316 (2014).
- 16) Hirata M., Takayama K., Nagai T., Chem. Pharm. Bull., 40, 741–746 (1992).
- 17) Aydin İ., Briscoe B. J., Şanlitürk K. Y., Powder Technol., 89, 239–254 (1996).
- 18) Wu C. Y., Ruddy O. M., Bentham A. C., Hancock B. C., Best S. M., Elliott J. A., Powder Technol., 152, 107–117 (2005).
- 19) Procopio A. T., Zavaliangos A., Cunningham J. C., J. Mater. Sci., 38, 3629–3639 (2003).
- 20) Podczeck F., Newton J. M., Fromme P., Int. J. Pharm., 495, 485–499 (2015).
- 21) Hayashi Y., Miura T., Shimada T., Onuki Y., Obata Y., Takayama K., J. Pharm. Sci., 102, 3678–3686 (2013).
- 22) Otoguro S., Hayashi Y., Miura T., Uehara N., Utsumi S., Onuki Y., Obata Y., Takayama K., Chem. Pharm. Bull., 63, 890–900 (2015).