Abstract
Direct compression is a popular choice as it provides the simplest way to prepare the tablet. It can be easily adopted when the active pharmaceutical ingredient (API) is unstable in water or to thermal drying. An optimal formulation of preliminary mixed powders (premix powders) is beneficial if prepared in advance for tableting use. The aim of this study was to find the optimal formulation of the premix powders composed of lactose (LAC), cornstarch (CS), and microcrystalline cellulose (MCC) by using statistical techniques. Based on the “Quality by Design” concept, a (3,3)-simplex lattice design consisting of three components, LAC, CS, and MCC was employed to prepare the model premix powders. Response surface method incorporating a thin-plate spline interpolation (RSM-S) was applied for estimation of the optimum premix powders for tableting use. The effect of tablet shape identified by the surface curvature on the optimization was investigated. The optimum premix powder was effective when the premix was applied to a small quantity of API, although the function of premix was limited in the case of the formulation of large amount of API. Statistical techniques are valuable to exploit new functions of well-known materials such as LAC, CS, and MCC.
A compressed tablet is one of the most popular and widely used dosage forms for drug administration. They are easy to swallow and the proper dose is countable by the number of tablets. Compared with the other solid dosage forms such as powders, granules, and capsules, tableting requires rather long and complex manufacturing process, i.e., milling, sieving, mixing, granulation, drying, and compression via a tableting machine. Direct compression is the simplest method and a popular choice to prepare the tablet.1) In addition, direct compression is easy to adopt when the active pharmaceutical ingredient (API) is unstable in water or to thermal drying.2) It is beneficial if we can provide the optimal formulation of preliminary mixed powders (premix powders) in advance for tableting use. Such knowledge can be applicable to the development of an initial trial of tablet formulation containing APIs. The aim of this study was to find the optimal formulation of the premix powders composed of lactose (LAC), cornstarch (CS), and microcrystalline cellulose (MCC) by using a series of statistical techniques.3–12) LAC is used as a filler-binder and CS as a filler and possible disintegrating agent.13) MCC is a filler and used mostly as a binder for direct compression.14) These components are the most common and effective tableting materials.15)
In recent years, the application of statistical techniques to pharmaceutical product development has been implemented to allow the “Quality by Design” concept proposed by the International Council for Harmonization of Technical Requirements for Pharmaceuticals for Human Use (ICH).16) The statistical techniques include design of experiments (DOE) and response surface method (RSM). Based on the “Quality by Design” concept, we employed a (3,3) simplex lattice design17) consisting of three components, LAC, CS, and MCC to prepare the model premix powders. The model formulations were assigned to the (3,3) simplex lattice design and a special cubic statistical equation17) was adopted to predict the responses as a function of the mixture components. The special cubic equation is useful to understand the statistical significance of each component and their interactions. However, the predictive accuracy of this equation is not always sufficient to optimize several responses simultaneously, which may often lead to a poorly reproducible solution. In order to cover the shortcomings of the special cubic equation, we have developed a multi-objective simultaneous optimization method based on the RSM in which a thin-plate spline (TPS) interpolation was incorporated (RSM-S).18,19) RSM-S fits well with the non-linear relationship between causal factors and responses. The TPS prediction obtained by RSM-S is always relevant and robust compared with the special cubic equation.20) Therefore, RSM-S was applied in the search of accurate optimal solutions. In addition, the effect of tablet shape identified by the surface curvature on the optimization was investigated. A confidence area of the optimal solution was also estimated by RSM-S, in which bootstrap (BS) resampling21) and Kohonen’s self-organizing map (SOM)22,23) were implemented.
To evaluate the possibility and the limitation of the optimized premix powders, API-containing tablets were prepared. Prednisolone (PRED) and theophylline (THEO) were chosen as models of poorly water-soluble APIs. The dissolution profiles of tablets containing different doses of APIs were compared with each other by using similarity factors.24)
Experimental
MaterialsPRED and THEO were purchased from Tokyo Chemical Industry Co., Ltd. (Tokyo, Japan) and Wako Pure Chemical Industries, Ltd. (Osaka, Japan), respectively. Lactose (LAC, Tablettose® 80) was purchased from Meggle Japan Co., Ltd. (Tokyo, Japan). Cornstarch (CS, Graflow® M) was purchased from Nippon Starch Chemical Co., Ltd. (Osaka, Japan). Microcrystalline cellulose (MCC, Ceolus® PH-101) was purchased from Asahi Kasei Chemicals Co., Ltd. (Tokyo, Japan). Magnesium stearate (MgSt) was purchased from Wako Pure Chemical Industries, Ltd. Other reagents used were of analytical grade.
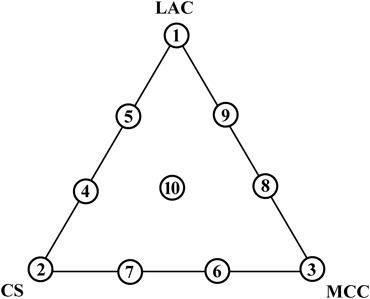
Preparation of Premix Powders and TabletsAll ingredients were dried at 75°C for 24 h and sieved through a 60-mesh screen. A total mass of 20 g of LAC, CS, and MCC was accurately weighed in the ratio assigned by the (3,3) simplex lattice design (Fig. 1), and blended by hand in a polyethylene bag for 2 min; subsequently, 400 mg MgSt was added into the mixture powder and blending was continued for 1 min. A 200 mg quantity of the premix powder was compressed with a force of 8 kN into a flat-faced or convexly curved tablet (8 mm in diameter) by using a tableting apparatus (HANDTAB 100; Ichihashi-Seiki Company, Ltd., Kyoto, Japan). Hard chrome plating punches with a flat-face and curvature radii of 16 mm and 12 mm were used to prepare the flat-faced (FLAT) and convex (R16 and R12) tablets, respectively. In the case of API-containing tablets, appropriate amounts of PRED and THEO were accurately weighed, added into the mixture of LAC, CS, and MCC and then blended in a polyethylene bag for 2 min. The process continued in the same manner as for the preparation of the premix powders without APIs. Tablets containing 1 and 5 mg of PRED or 50 and 100 mg of THEO were prepared, respectively. The total amount of API-containing tablets was fixed at 200 mg through reduction in the quantities of LAC, CS, and MCC.
Measurement of Hausner RatioThe Hausner ratio (HR) of premix powders was determined as an index of fluidity.25) Approximately 20 mL of the sample powders was gently poured into the graduated cylinder. The bulk density (ρbulk) was determined as the value of the powder weight divided by the value of gently poured powders. The graduated cylinder was then tapped up and down repeatedly until the powder volume remained constant using a tap density tester (Konishi Seisakusho, Co., Ltd., Osaka, Japan). The powder volume was measured after every 20 tap, and the volume was checked to become constant before 100 taps. The tapped density (ρtapped) was given as a ratio of the powder weight with the tapped volume at 100 taps. The HR was defined as:
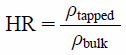 | (1) |
The HR was measured for three time of each premix powder.
Determination of Tensile StrengthThe tensile strength (TS), used as an index of hardness of tablets, was determined from26):
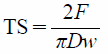 | (2) |
where
F is the crushing force of the tablet in the diametrical direction,
D is the diameter, and
w is the thickness of the tablet. In convex tablets,
w is the length of thickest part of the tablet.
26) The TS was measured for three tablets of each formulation.
Measurement of Disintegration Time (DT)The disintegration test was performed in accordance with the Japanese Pharmacopoeia 17 disintegration test for tablets using a disintegration tester (NT-20H; Toyama Sangyo Co., Ltd., Osaka, Japan) and 700 mL of water as a test medium at 37°C±2°C. The DT value was defined as the time required for the complete disappearance of a tablet and its particles from the tester net. The DT was measured for three tablets of each formulation. To reduce the deviation, the logarithmic transformation of DT was applied (log DT).
Measurement of Dissolution RateThe dissolution profiles of PRED and THEO from the tablets were determined in accordance with the Japanese Pharmacopoeia 17 dissolution test no. 2 (paddle method) by using a dissolution tester (NT-6600; Toyama Sangyo Co., Ltd.). As a test medium, a 900 mL of water was used at 37±0.5°C at a paddle rotation speed of 50 rpm. The samples were withdrawn at 5, 10, 15, 20, 30 and 60 min, and filtered through a membrane filter with a pore size of 0.45 µm. The concentrations of PRED and THEO were determined spectrophotometrically at 247 and 270 nm, respectively, with an UVmini-1240 spectrophotometer (Shimadzu Corp., Kyoto, Japan). The dissolution profiles were determined for the three tablets made by the optimum formulation. A similarity factor (f2),24) defined in Eq. 3, was used as an index of the similarity of dissolution profiles between different doses of PRED (1 mg/tablet and 5 mg/tablet) or THEO (50 mg/tablet and 100 mg/tablet), respectively.
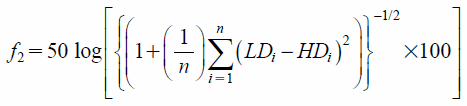 | (3) |
where
n is the number of samplings and
LDi and
HDi are the percentage (%) dissolution in low and high doses of tablets, respectively.
Regression Equation and Response SurfaceA special cubic equation17) was employed to understand the statistical significance of causal factors and their interactions with the response variables, and to create a triangle contour diagram:
 | (4) |
where
F(
x) is a predicted response,
x is a causal factor, and β is a regression coefficient. The special cubic equation is composed of three terms of first-order factors (
xi), three terms of second-order interactions (
xixj) and one term of third-order interaction (
xixjxk). The regression coefficients of each term were estimated by using a least-square linear regression passing through the origin. Triangle contour diagrams were created based on the special cubic equation. In rare cases, a quadratic equation or a full cubic equation was recommended as better fit models, so that these models were used instead of the special cubic equation, if necessary, to produce better contour diagrams.
Estimation of Optimal Solution and Confidence IntervalTo estimate the optimal solution with high accuracy, a thin-plate spline interpolation (TPS)20) was introduced to identify the relationship between the causal factors and the pharmaceutical responses. It is recognized that TPS always leads to a better approximation compared with the linear statistical models.20) The individual response, as estimated by TPS, was integrated into a generalized Euclidian distance and the optimal solution was obtained through the minimization of the distance function under the inequality and equality constraints27):
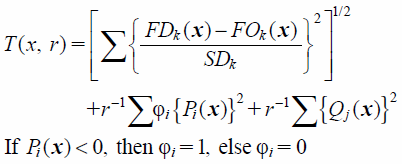 | (5) |
where
T(
x,
r) is a generalized Euclidian distance function with constraints,
FDk(
x) is an individual optimal value of each response,
FOk(
x) is a simultaneous optimal value (a compromised value),
SDk is a sample standard deviation, and
Pi(
x) and
Qj(
x) are the inequality and equality constraints, respectively, and
r is a positive monotonically decreasing perturbation parameter.
T(
x,
r) is discontinuous when the values of
Pi(
x) are negative, so that the iterative direct search method was applied for the estimation of a numerical solution.
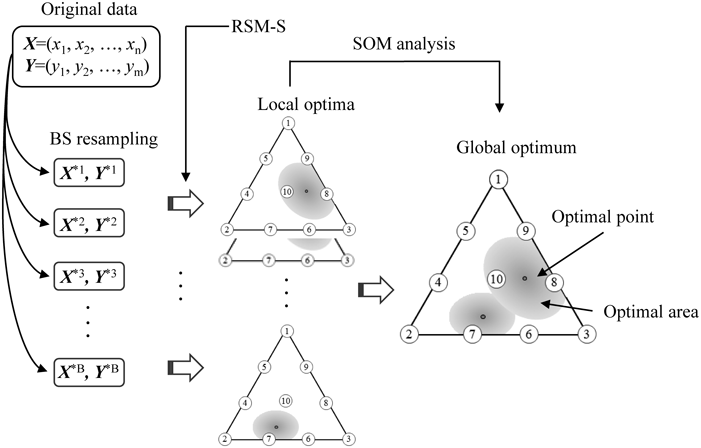
Bootstrap Resampling and Self-Organizing MapTo estimate a global optimum and its confidence area, a random sampling with replacement was repeated to generate 1000 sets of bootstrap (BS) samples. The search process for the global optimum solution based on BS resampling and Kohonen’s self-organizing map (SOM) is schematically illustrated in Fig. 2.3,4) In the general BS resampling method, each resampled mean can be assumed to follow a normal distribution based on a central limit theorem.21) However, this theorem is no longer approved because every optimum solution was estimated by the non-linear TPS interpolation. The optimum solutions obtained from every BS resampled data are often split into several clusters. We then employed SOM to classify BS optimal solutions into several clusters and to find the global optimum solution.
Computer ProgramsRegression analysis based on the special cubic equation was performed by using JMP Pro version 13 (SAS Institute, Cary, NC, U.S.A.). The triangle contour diagram was produced by using Design-Expert version 11 (Stat-Ease, Inc., Minneapolis, MN, U.S.A.). dataNESIA version 3.2 (Azbil Corp., Tokyo, Japan) was used for the RSM-S analysis that incorporated the BS resampling method. Viscovery SOMine version 5.0 (Eudaptics Software, Vienna, Austria) was used for SOM clustering of the BS optimum solutions.
Results and Discussion
Characteristics of Model Premix PowdersThe model premix powders and their responses are summarized in Tables 1, 2. In formulations 3, 6, and 8, the HR values were somewhat large and these formulations were less effective in the powder fluidity. There was no formulation with an HR value of over 1.6,28) which suggested that the fluidity of most formulations was acceptable for direct compression powders. The TS values were relatively small and some of them were inappropriate as tablet formulations. In the case of CS only (formulation 2), the tablet could not maintain the form. Then, the values of TS and DT in the formulation 2 were set to zero. Sufficient hardness was observed in formulations 3, 7, and 8, and these formulations included a large amount of MCC. Because plastic deformation of excipients dominates compression moldability, the partially crystallized needle-like powders of MCC have the advantage providing high TS values compared with that of CS and LAC.1) The DT values significantly deviated among the formulations. More than 2 h were required for formulation 6 to completely disintegrate. In contrast, the DT values for formulations 7 and 10 were less than 2 min, which suggested that disintegration phenomena were very sensitive to the weight ratios of LAC, CS, and MCC.
Table 1. Premix Powder Formulations Assigned by (3, 3) Simplex Lattice Design
| Rp.a) | LAC | CS | MCC |
|---|
| 1 | 1 | 0 | 0 |
| 2 | 0 | 1 | 0 |
| 3 | 0 | 0 | 1 |
| 4 | 0.333 | 0.667 | 0 |
| 5 | 0.667 | 0.333 | 0 |
| 6 | 0 | 0.333 | 0.667 |
| 7 | 0 | 0.667 | 0.333 |
| 8 | 0.333 | 0 | 0.667 |
| 9 | 0.667 | 0 | 0.333 |
| 10 | 0.333 | 0.333 | 0.333 |
Table 2. HR, TS, and log DT Values for Model Formulations
| Rp. | HR | FLAT | R16 | R12 |
|---|
| TS (MPa) | log DT (log(s)) | TS (MPa) | log DT (log(s)) | TS (MPa) | log DT (log(s)) |
|---|
| 1–1 | 1.180 | 0.520 | 3.336 | 0.314 | 3.307 | 0.343 | 3.384 |
| 1–2 | 1.143 | 0.437 | 3.331 | 0.369 | 3.256 | 0.339 | 3.387 |
| 1–3 | 1.152 | 0.353 | 3.366 | 0.369 | 3.298 | 0.393 | 3.342 |
| 2–1 | 1.156 | 0 | 0 | 0 | 0 | 0 | 0 |
| 2–2 | 1.146 | 0 | 0 | 0 | 0 | 0 | 0 |
| 2–3 | 1.144 | 0 | 0 | 0 | 0 | 0 | 0 |
| 3–1 | 1.534 | 2.663 | 3.082 | 2.204 | 3.157 | 2.457 | 3.054 |
| 3–2 | 1.457 | 2.923 | 3.091 | 2.572 | 3.505 | 2.674 | 3.954 |
| 3–3 | 1.504 | 3.140 | 3.594 | 2.168 | 3.410 | 2.412 | 3.055 |
| 4–1 | 1.122 | 0.071 | 2.934 | 0.047 | 2.951 | 0 | 2.763 |
| 4–2 | 1.120 | 0.033 | 2.772 | 0 | 2.903 | 0.055 | 3.007 |
| 4–3 | 1.127 | 0.036 | 2.941 | 0 | 2.817 | 0 | 2.767 |
| 5–1 | 1.149 | 0.054 | 3.010 | 0.041 | 3.192 | 0.081 | 2.834 |
| 5–2 | 1.115 | 0.123 | 2.770 | 0.072 | 2.886 | 0.097 | 3.192 |
| 5–3 | 1.143 | 0.076 | 2.875 | 0.062 | 3.0124 | 0.109 | 2.986 |
| 6–1 | 1.321 | 0.401 | 3.878 | 0.238 | 3.918 | 0.169 | 3.639 |
| 6–2 | 1.397 | 0.234 | 3.709 | 0.429 | 3.207 | 0.349 | 3.846 |
| 6–3 | 1.400 | 0.365 | 3.924 | 0.238 | 3.897 | 0.343 | 3.848 |
| 7–1 | 1.229 | 1.685 | 1.959 | 1.284 | 2.053 | 1.677 | 1.978 |
| 7–2 | 1.163 | 1.699 | 2.041 | 1.157 | 1.919 | 2.045 | 2.000 |
| 7–3 | 1.256 | 1.644 | 1.996 | 1.739 | 1.875 | 1.979 | 1.875 |
| 8–1 | 1.370 | 2.004 | 2.305 | 1.331 | 2.618 | 1.501 | 1.919 |
| 8–2 | 1.393 | 1.495 | 2.190 | 1.665 | 2.228 | 1.574 | 2.124 |
| 8–3 | 1.405 | 1.719 | 2.671 | 1.606 | 2.354 | 1.742 | 2.470 |
| 9–1 | 1.265 | 1.228 | 2.917 | —a) | 2.158 | 1.025 | 2.164 |
| 9–2 | 1.250 | 0.784 | 2.391 | 1.107 | 2.146 | 1.058 | 1.778 |
| 9–3 | 1.279 | 0.959 | 2.149 | 0.941 | 2.233 | 1.007 | 1.991 |
| 10–1 | 1.321 | 0.331 | 2.021 | 0.200 | 2.233 | 0.183 | 1.903 |
| 10–2 | 1.281 | 0.320 | 1.898 | 0.400 | 2.199 | 0.343 | 1.903 |
| 10–3 | 1.278 | 0.392 | 2.176 | 0.366 | 1.996 | 0.392 | 2.545 |
a) Datum was missing because of the tablet capping during measurement.
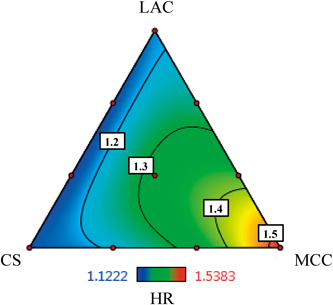
The regression equation and a triangle contour diagram for the HR are presented in Table 3 and Fig. 3. The precise prediction for HR was achieved with high R2 values (0.961). The first-order terms, such as LAC, CS, and MCC acted as highly positive factors in the enlargement of HR, which suggested that the increase in the amount of first-order factors worsened the powder fluidity. The third-order interaction of LAC×CS×MCC provided a positive effect on the HR values. It was rare that the third-order interaction was statistically significant. This clearly indicated the importance of the synergy in the combined use of materials. A triangle contour diagram of HR is shown in Fig. 3. An increase in the amount of MCC led to poor fluidity, which suggested that the upper limit of MCC was required to secure better fluidity of premix powders.
Table 3. Prediction of HR with Special Cubic Equation
| Factor | β | SE | t | p |
|---|
| LAC | 1.158 | 0.015 | 75.96 | <0.01** |
| CS | 1.141 | 0.015 | 74.88 | <0.01** |
| MCC | 1.506 | 0.015 | 98.77 | <0.01** |
| LAC×CS | −0.091 | 0.071 | −1.27 | 0.11 |
| LAC×MCC | −0.027 | 0.071 | −0.29 | 0.10 |
| CS×MCC | −0.131 | 0.071 | −1.84 | 0.08 |
| LAC×CS×MCC | 1.401 | 0.523 | 2.68 | <0.05* |
| R2 | 0.961 | | | |
| RMSEa) | 0.028 | | | |
a) Residual mean squared error. **Highly significant at p<0.01, *Significant at p<0.05.
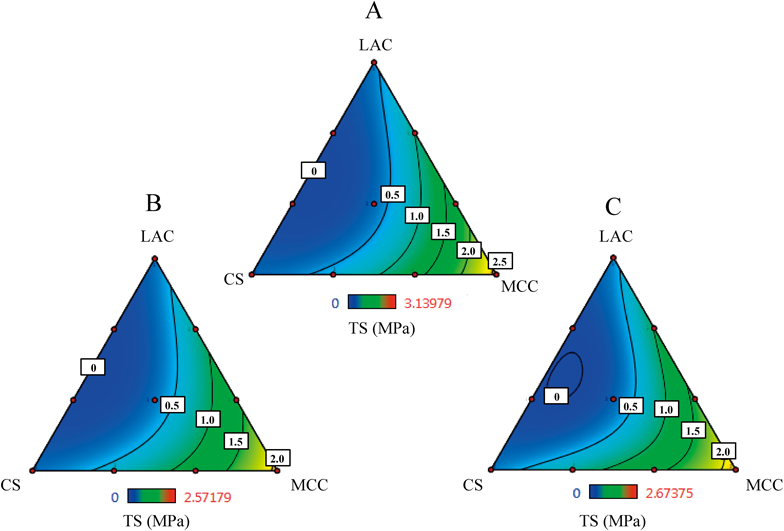
The regression equation for the TS value is summarized in Table 4. Compared with HR, the R2 values decreased in all tablet shapes (FLAT, R16, and R12). In every case, only MCC was highly significant and MCC worked to increase the tablet hardness. The triangle contour diagrams for TS of the FLAT, R16, and R12 tablets are shown in Fig. 4. The highest value of TS was seen in the neighbor of the formulation 3 (MCC alone). In contrast, the tablets were brittle around the area of LAC : CS=1 : 1. It was observed that the interaction of LAC and CS weakened the tablet hardness. Tablet shape was observed to have almost no effect on the hardness.
Table 4. Prediction of TS (MPa) with Special Cubic Equation
| FLAT |
|---|
| Factor | β | SE | t | p |
|---|
| LAC | 0.432 | 0.316 | 1.37 | 0.184 |
| CS | 0.346 | 0.316 | 1.09 | 0.285 |
| MCC | 2.568 | 0.316 | 8.13 | <0.01** |
| LAC×CS | −1.455 | 1.476 | −0.99 | 0.334 |
| LAC×MCC | −0.607 | 1.476 | −0.41 | 0.684 |
| CS×MCC | −2.034 | 1.476 | −1.38 | 0.181 |
| LAC×CS×MCC | −8.432 | 10.822 | −0.78 | 0.444 |
| R2 | 0.702 | | | |
| RMSEa) | 0.575 | | | |
| R16 |
|---|
| Factor | β | SE | t | p |
|---|
| LAC | 0.359 | 0.266 | 1.35 | 0.191 |
| CS | 0.277 | 0.264 | 1.05 | 0.307 |
| MCC | 2.029 | 0.266 | 7.64 | <0.01** |
| LAC×CS | −1.265 | 1.238 | −1.02 | 0.318 |
| LAC×MCC | 0.360 | 1.299 | 0.28 | 0.784 |
| CS×MCC | −1.373 | 1.238 | −1.11 | 0.279 |
| LAC×CS×MCC | −8.455 | 9.146 | −0.92 | 0.365 |
| R2 | 0.706 | | | |
| RMSEa) | 0.482 | | | |
| R12 |
|---|
| Factor | β | SE | t | p |
|---|
| LAC | 0.373 | 0.330 | 1.13 | 0.271 |
| CS | 0.356 | 0.330 | 1.08 | 0.292 |
| MCC | 2.144 | 0.330 | 6.49 | <0.01** |
| LAC×CS | −1.383 | 1.544 | −0.90 | 0.380 |
| LAC×MCC | 0.268 | 1.544 | 0.17 | 0.834 |
| CS×MCC | −0.704 | 1.544 | −0.46 | 0.653 |
| LAC×CS×MCC | −12.132 | 11.323 | −1.07 | 0.295 |
| R2 | 0.623 | | | |
| RMSEa) | 0.601 | | | |
a) Residual mean squared error. **Highly significant at p<0.01.
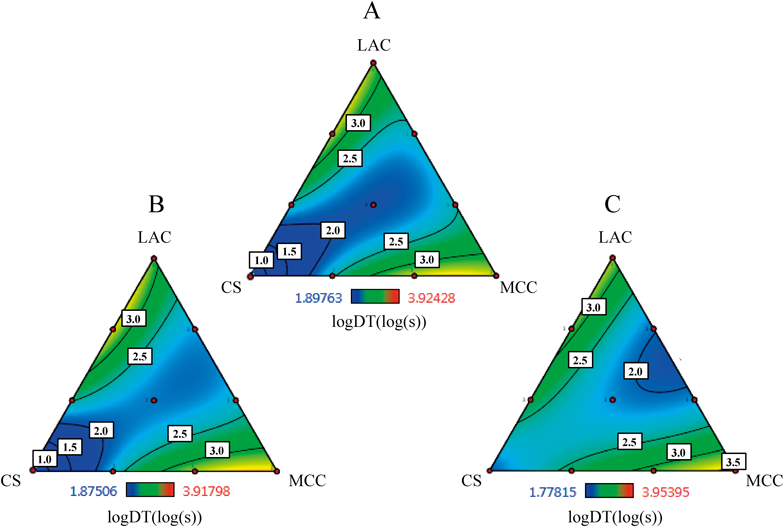
The prediction with the special cubic equation for log DT was somewhat improved compared with those for TS, as summarized in Table 5. The coefficients of first-order terms of LAC and MCC, and the LAC×CS and CS×MCC interactions were highly positive and these factors contributed to the retardation of tablet disintegration. Meanwhile, the interaction of LAC×MCC and LAC×CS×MCC showed significant negative effects and these interactions caused an enhancement in the disintegration times of tablets. Although CS has been recognized as a disintegrating agent,13) the coefficient of first-order term was not significant enough for prediction of log DT, suggesting that CS functioned as a disintegrating agent primarily when mixed with LAC and MCC. The triangle contour diagrams for the log DT of FLAT, R16, and R12 tablets are shown in Fig. 5. The area with shorter disintegration times was observed along the line from the point of formulation 2 (CS alone) to the area of LAC : MCC=1 : 1. The disintegration time was affected by the shape of tablets. When the tablet face was flat, CS worked well as a disintegrating agent, but the area of LAC : MCC=1 : 1 became more important to shorten the disintegration time with the increasing steepness of convexly curved surfaces. Previously, we reported that stress remained in the tablet after compression with dies and punches.29,30) The distribution of the stress remaining in the tablet was significantly affected by the shape of tablets and was biased by an increase in curvature.30) It is likely that the stress remaining in the tablet is a major reason that this effect of shape was observed.
Table 5. Prediction of log DT (log(s)) with Special Cubic Equation
| FLAT |
|---|
| Factor | β | SE | t | p |
|---|
| LAC | 3.195 | 0.208 | 15.33 | <0.01** |
| CS | 0.051 | 0.208 | 0.25 | 0.808 |
| MCC | 3.354 | 0.208 | 16.09 | <0.01** |
| LAC×CS | 5.671 | 0.974 | 5.82 | <0.01** |
| LAC×MCC | −3.767 | 0.974 | −3.87 | <0.01** |
| CS×MCC | 5.469 | 0.974 | 5.61 | <0.01** |
| LAC×CS×MCC | −26.665 | 7.145 | −3.73 | <0.01** |
| R2 | 0.893 | | | |
| RMSEa) | 0.380 | | | |
| R16 |
|---|
| Factor | β | SE | t | p |
|---|
| LAC | 3.122 | 0.178 | 17.55 | <0.01** |
| CS | 0.050 | 0.178 | 0.28 | 0.781 |
| MCC | 3.472 | 0.178 | 19.51 | <0.01** |
| LAC×CS | 6.184 | 0.832 | 7.44 | <0.01** |
| LAC×MCC | −4.534 | 0.832 | −5.45 | <0.01** |
| CS×MCC | 4.727 | 0.832 | 5.68 | <0.01** |
| LAC×CS×MCC | −21.083 | 6.099 | −3.46 | <0.01** |
| R2 | 0.921 | | | |
| RMSEa) | 0.324 | | | |
| R12 |
|---|
| Factor | β | SE | t | p |
|---|
| LAC | 3.205 | 0.206 | 15.56 | <0.01** |
| CS | 0.037 | 0.206 | 0.18 | 0.860 |
| MCC | 3.484 | 0.206 | 16.91 | <0.01** |
| LAC×CS | 5.869 | 0.963 | 6.09 | <0.01** |
| LAC×MCC | −5.715 | 0.963 | −5.93 | <0.01** |
| CS×MCC | 4.968 | 0.963 | 5.16 | <0.01** |
| LAC×CS×MCC | −18.732 | 7.062 | −2.65 | <0.05* |
| R2 | 0.901 | | | |
| RMSEa) | 0.375 | | | |
a) Residual mean squared error. **Highly significant at p<0.01, *Significant at p<0.05.
In order to optimize the premix powders, we defined the multi-objective simultaneous optimization problem as follows:
 | (6) |
 | (7) |
 | (8) |
Subject to the inequality and equality constraints:
 | (9) |
 | (10) |
 | (11) |
 | (12) |
Equations 6–8 were integrated into the standardized Euclidian distance, first-term on the right-hand side in Eq. 5. The inequality constraints 9–11 and the equality constraint 12 were defined as the second- and the third-terms on the right-hand side in Eq. 5. The upper limit of CS was set to 0.667 in Eq. 10, because the tablets containing a large amount of CS, i.e., formulation 2 (LAC : CS : MCC=0 : 1 : 0), were too weak for the measurement of the responses.
A leave-one-out-cross-validation (LOOCV) was applied to validate the TPS approximation for responses. Although the TPS method always yields a better fit to the experimental data,20) we must be careful to the over-fit problem. To avoid the over-fit, the LOOCV was applied (Table 6). The coefficient of determination in LOOCV (R2LOOCV) was sufficiently high, which indicated the robustness of the TPS approximation. This may suggest that the reliable optimum solution can be estimated based on the TPS approximation.
Table 6. Leave-One-Out-Cross-Validation of Responses Predicted by TPS
| Response | R2LOOCVa) |
|---|
| HR | 0.962 |
| TS-FLAT | 0.983 |
| TS-R16 | 0.925 |
| TS-R12 | 0.990 |
| log DT-FLAT | 0.974 |
| log DT-R16 | 0.979 |
| log DT-R12 | 0.959 |
The BS resampling generated 1000 sets of resampled data to which TPS was applied.
After the minimization of Eq. 5, 1000 sets of BS optimum solutions were obtained. The SOM analysis for 1000 sets of BS optimum solutions revealed five clusters. Approximately 70% of the BS optimum solutions were classified into the top two clusters. The largest cluster included LAC : CS : MCC=0.004 : 0.659 : 0.337 as the mean values. Although this formulation suggested a better estimation for every response variable, the tablet hardness was somewhat weak (TS=1.368–1.869 MPa). The larger cluster in second provided the optimum formulation with better tablet hardness (1.583–2.387 MPa), although the powder fluidity was somewhat worse. The other three were small and meaningless clusters. Among them, we decided that the global optimum solution was included in the larger cluster in second. The results are summarized in Table 7. The optimum solution estimated was close to formulation 8. The quantity ratio of LAC : MCC was approximately 1 : 2 and almost no CS was included. The standard deviations (S.D.s) of the causal factors and responses were fairly small, except for the level of CS, which suggested that the optimum solution was reliable and robust. The S.D. value of CS was bigger than the mean because a very slight amount of CS was estimated as the optimum. The experimental results of the optimum solution agreed well with the predictions (data not shown), indicating that the reproducible solution was obtained by using the BS resampling and SOM analysis.
Table 7. Simultaneous Optimal Solution of FLAT, R16, and R12 Tablets Identified by BS Resampling and SOM Analysis
| Formulation | LAC | CS | MCC | | |
|---|
| Mean | 0.325 | 0.014 | 0.661 | | |
| S.D. | 0.049 | 0.052 | 0.032 | | |
| Response | HR | FLAT | R16 | R12 |
|---|
| TS (MPa) | log DT (log(s)) | TS (MPa) | log DT (log(s)) | TS (MPa) | log DT (log(s)) |
|---|
| Mean | 1.387 | 1.706 | 1.508 | 1.583 | 2.373 | 2.387 | 2.170 |
| S.D. | 0.013 | 0.151 | 0.124 | 0.089 | 0.126 | 0.103 | 0.138 |
Data represent the mean±S.D. of three determinations.
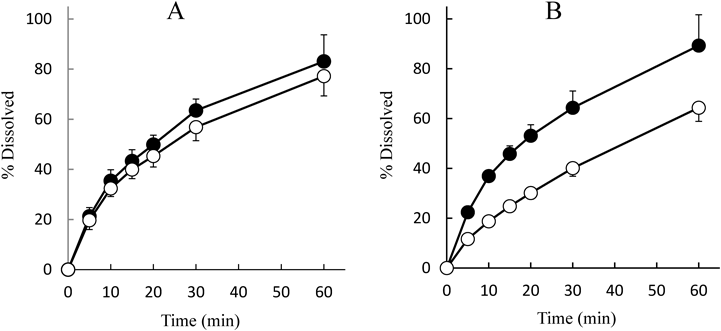
To investigate the usefulness of the optimum premix powders, PRED and THEO were employed as model poorly water-soluble drugs. PRED was used as the low-dose drug, and THEO was the high-dose drug. The results are summarized in Table 8. The HR values of the optimum premix powders containing PRED slightly increased, but their fluidity was still maintained as a good level. In contrast, the powder contained THEO, the HR values increased significantly and these powders were no longer flowable. Slight changes in the TS values of tablets that contained PRED were observed, and these levels of fluctuation were acceptable. However, the disintegration time was retarded when THEO was formulated in the tablets. This disintegration took approximately 10 min and 30 min to finish when 50 and 100 mg of THEO were contained in the tablets. It is likely that the retardation of disintegration time causes unfavorable effect on the dissolution of THEO tablets. The typical dissolution profiles of PRED and THEO in FLAT tablets prepared by the optimum premix powders are shown in Fig. 6. Irrespective of the different dose of PRED, the dissolution profiles were very similar. The dissolution profiles of PRED suggested that the dosage had only a little effect. Almost the same results were observed in R16 and R12 tablets. As the major part of tablets was composed of the optimum premix powders, the nature of properties of PRED did not significantly affect any dissolution profiles. In contrast, considerable difference between the dissolution profiles was observed in THEO-containing tablets. In particular, a serious impact to the dissolution rate was observed when a high dose of THEO was in the formulation. Similar phenomena were seen in R16 and R12 tablets. The similarity factors (f2) between the different doses are summarized in Table 9. When the f2 value is more than 50%, it is recognized that the difference in dissolution profiles was below 10%. The f2 values of PRED-containing tablets were more than 65%, which indicated that the dissolution profiles of different doses of PRED in FLAT, R16, and R12 tablets were substantially similar. However, the f2 values were nearly 20–30% of the values for different doses of THEO. In this case, the premix powder is no longer available as “the optimum premix powder.”
Table 8. Response Variables of Optimum Formulation of FLAT, R16, and R12 Tablets Containing APIs
| Powder |
|---|
| API | PRED (mg) | THEO (mg) |
|---|
| Content | 1 | 5 | 50 | 100 |
| HR | 1.467±0.024 | 1.406±0.023 | 1.584±0.132 | 1.953±0.116 |
| FLAT |
|---|
| API | PRED (mg) | THEO (mg) |
|---|
| Content | 1 | 5 | 50 | 100 |
| TS (MPa) | 1.582±0.014 | 1.701±0.057 | 2.223±.0.236 | 2.295±0.281 |
| log(DT) (log(s)) | 1.943±0.010 | 2.034±0.181 | 2.780±0.084 | 3.347±0.028 |
| R16 |
|---|
| API | PRED (mg) | THEO (mg) |
|---|
| Content | 1 | 5 | 50 | 100 |
| TS (MPa) | 1.717±0.045 | 1.567±0.026 | 2.223±0.236 | 2.295±0.281 |
| log(DT) (log(s)) | 1.953±0.007 | 2.066±0.263 | 2.753±0.063 | 3.292±0.054 |
| R12 |
|---|
| API | PRED (mg) | THEO (mg) |
|---|
| Content | 1 | 5 | 50 | 100 |
| TS (MPa) | 1.458±0.092 | 1.543±0.052 | 1.650±0.084 | 2.015±0.250 |
| log(DT) (log(s)) | 2.047±0.175 | 1.949±0.051 | 2.784±0.057 | 3.307±0.038 |
Data represent the mean±S.D. of three determinations.
Table 9. Similarity Factor (
f2) of Dissolution Profiles of Different Doses of PRED and THEO from Tablets Prepared by Optimum Premix Powders
| Tablet | PRED 1 mg vs. 5 mg | THEO 50 mg vs. 100 mg |
|---|
| FLAT | 66.7 | 33.9 |
| R16 | 85.8 | 22.9 |
| R12 | 66.2 | 29.4 |
The f2 value was calculated using the mean values of the dissolution rates in accordance with Eq. 3.
We have concluded that the optimum premix powder is effective when a small quantity of API is formulated even though API is a poorly water-soluble, but limited for application to large doses of API. It is valuable to exploit the new functions of well-known materials by using statistical techniques such as simplex lattice design, special cubic equation, triangle contour diagram, thin-plate spline, and RSM-S, together with the BS resampling method and SOM analysis.
Acknowledgment
This work was supported by the Japan Society for the Promotion of Science (JSPS) KAKENHI Grant Number JP17K08252.
Conflict of Interest
The authors declare no conflict of interest.
References
- 1) Jivraj I., Martini L. G., Thomson C. M., Pharm. Sci. Technol. Today, 3, 58–63 (2000).
- 2) Wardrop J., Law D., Qiu Y., Engh K., Faitsch L., Ling C., J. Pharm. Sci., 95, 2380–2392 (2006).
- 3) Arai H., Suzuki T., Kaseda C., Takayama K., Chem. Pharm. Bull., 57, 572–579 (2009).
- 4) Hayashi Y., Kikuchi S., Onuki Y., Takayama K., J. Pharm. Sci., 101, 333–341 (2012).
- 5) Kikuchi S., Takayama K., Int. J. Pharm., 374, 5–11 (2009).
- 6) Kikuchi S., Takayama K., Int. J. Pharm., 386, 149–155 (2010).
- 7) Kikuchi S., Onuki Y., Yasuda A., Hayashi Y., Takayama K., J. Pharm. Sci., 100, 964–975 (2011).
- 8) Maeda J., Suzuki T., Takayama K., Chem. Pharm. Bull., 60, 1155–1163 (2012).
- 9) Onuki Y., Kawai S., Arai H., Maeda J., Takagaki K., Takayama K., J. Pharm. Sci., 101, 2372–2381 (2012).
- 10) Onuki Y., Ohyama K., Kaseda C., Arai H., Suzuki T., Takayama K., J. Pharm. Sci., 97, 331–339 (2008).
- 11) Takayama K., Fujikawa M., Obata Y., Morishita M., Adv. Drug Deliv. Rev., 55, 1217–1231 (2003).
- 12) Takayama K., Kawai S., Obata Y., Todo H., Sugibayashi K., Chem. Pharm. Bull., 65, 967–972 (2017).
- 13) Desai P. M., Liew C. V., Heng P. W. S., J. Pharm. Sci., 105, 2545–2555 (2016).
- 14) Thoorens G., Krier F., Leclercq B., Carlin B., Evrard B., Int. J. Pharm., 473, 64–72 (2014).
- 15) Gohel M. C., Jogani P. D., J. Pharm. Pharm. Sci., 8, 76–93 (2005).
- 16) Yu L. X., Pharm. Res., 25, 781–791 (2008).
- 17) Khuri A., Cornell J. A., “Response Surfaces Design and Analyses, Chap. 9: Mixture Design and Analysis,” Marcel Dekker, Inc., New York, NY, U.S.A., 1987, pp. 333–373.
- 18) Takayama K., Obata Y., Morishita M., Nagai T., Pharmazie, 59, 392–395 (2004).
- 19) Takayama K., Yakuzaigaku, 76, 191–207 (2016).
- 20) Whaba G., “Spline Models for Observational Data,” SIAM, Philadelphia, PA, U.S.A., 1990, pp. 1–151.
- 21) Efron B., Tibshirani R., Stat. Sci., 1, 54–75 (1986).
- 22) Kohonen T., Neurocomputing, 21, 1–6 (1998).
- 23) Yasuda A., Onuki Y., Kikuchi S., Takayama K., J. Pharm. Sci., 99, 4535–4542 (2010).
- 24) Moore J. W., Flanner H. H., Pharm. Technol, 20, 64–74 (1996).
- 25) Hausner H. H., J. Powder Metallurgy, 3, 7–13 (1967).
- 26) Podczeck F., Drake K. R., Newton J. M., Int. J. Pharm., 454, 412–424 (2013).
- 27) Takayama K., Nagai T., Int. J. Pharm., 74, 115–126 (1991).
- 28) Zheng J. Y., Ternik R. L., “Formulation and Analytical Development for Low-Dose Oral Drug Products, Chap. 7: Development of Low-Dose Solid Oral Tablets Using Direct Compression,” ed. by Zheng J. Y., John Wiley & Sons, Inc., Hoboken, NJ, U.S.A., 2009, pp. 159–200.
- 29) Hayashi Y., Miura T., Shimada T., Onuki Y., Obata Y., Takayama K., J. Pharm. Sci., 102, 3678–3686 (2013).
- 30) Otoguro S., Hayashi Y., Miura T., Uehara N., Utsumi S., Onuki Y., Obata Y., Takayama K., Chem. Pharm. Bull., 63, 890–900 (2015).