Results and Discussion
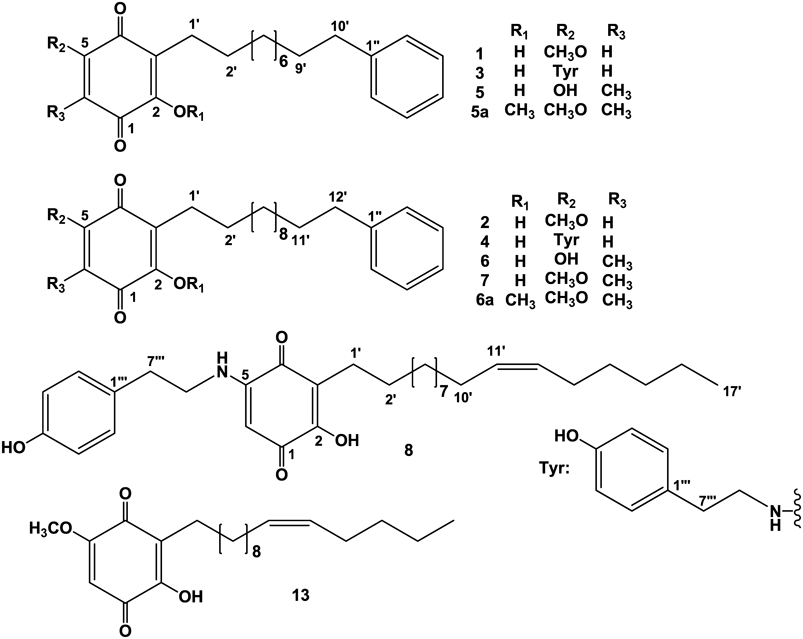
After extensive separation of the non-polar fractions of a MeOH extract from the leaves of A. quinquegona, eight alkylated benzoquinone derivatives (Fig. 1) were isolated together with four known compounds. Their structures were elucidated largely by spectroscopy.
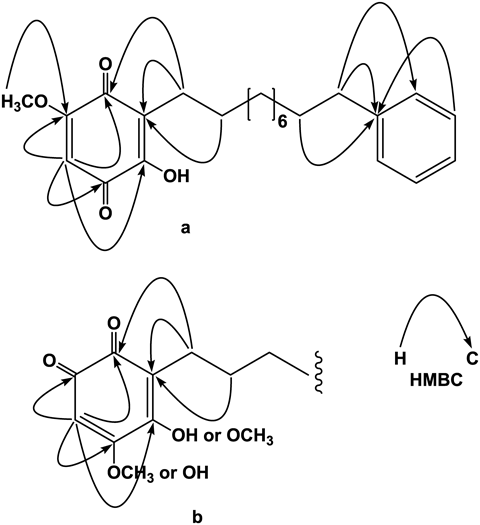
Ardisiaquinone A (1) was isolated as yellow needles, mp 77–79°C (MeOH), and its elemental composition was determined to be C23H30O4 by high resolution-electrospray ionization (HR-ESI)-MS. The IR spectrum exhibited absorption bands attributable to a hydroxy group (3423 cm−1) and two different conjugated carbonyl functional groups (1662 and 1634 cm−1). The visible-light absorption maximum at 428 nm implied the presence of a yellow chromophore. Large collapsed peaks at δH 1.28 and δC 29.3–29.5 in the 1H- and 13C-NMR spectra, respectively, indicated a long methylene carbon chain (Tables 1 and 2). In the 1H-NMR spectrum, one singlet proton in the sp2 region, five finely coupled aromatic protons [δH 7.16 (1H), 7.17 (2H), and 7.26 (2H)], and one methoxy signal were observed. Four carbon signals for six carbon atoms, observed in the 13C-NMR, were assigned to a monosubstituted benzene ring together with the results of heteronuclear single-quantum correlation spectroscopy (HSQC) correlations. Two fairly deshielded carbon signals, two carbonyl carbon signals, and a further two sp2 signals, with and without hydrogen atoms, were also observed. It is possible that the latter six carbon atoms form a quinonoid carbon skeleton, considering the presence of a yellow chromophore. Based on the above evidence and the elemental composition, obtained from HR-MS, it is likely that these two C6 units are connected by an alkyl chain with ten methylene carbons. Two carbonyl carbon atoms must be involved in one of the C6 motifs, and heteronuclear multiple bond correlation spectroscopy (HMBC) correlations were observed from the singlet aromatic proton, H-6 (δH 5.82) with two carbonyl carbons (δC 181.6 and 182.8) and two fairly deshielded carbons (δC 151.6 and 161.2) (Fig. 2a). Further correlations were observed between H2-1′ (δH 2.44) and C-3 (δC 119.3) and C-4 (δC 182.8), H2-2′ (δH 1.45) and C-3, and CH3O- (δH 3.84) and C-5 (δC 161.2). These correlations confirmed the structure of the quinonoid unit, and HMBC correlations observed between H2-9′ (δH 1.60) and C-1″ (δC 143.0), and H2-10′ (δH 2.59) and C-1″ and C-2″ (δC 128.2), placed the monosubstituted benzene ring on the other end (C-12′) of the alkyl chain (Fig. 2a). However, HMBC correlations observed around the para-benzoquinone structure were also compatible with an alternative structure, such as an ortho-benzoquinone system (Fig. 2b). A closely related compound, maesanin (2-hydroxy-5-methoxy-3-(10′Z-pentadecenyl)cyclohexa-2,5-diene-1,4-dione) (13) was isolated from the fruits of Maesa lanceolata (Myrsinaceae) by Kubo et al., and synthesized to confirm the structure.11,12) In 1998, maesanin was independently synthesized by Poigny et al.13) and the 13C-NMR data reported were superimposable on those of the maesanin synthesized by Kubo et al. Complete accordance of the NMR data of the p-benzoquinone moiety in 1 with those of the synthesized maesanin, provided enough evidence to confirm the structure as 2-hydroxy-5-methoxy-3-(phenylalkyl)cyclohexa-2,5-diene-1,4-dione. The site of the methoxy functional group was confirmed to be at the 5-position as a significant nuclear Overhauser effect (NOE) enhancement of H-6 in the difference NOE experiment was observed on irradiation of the methoxy protons. The number of methylene carbons was calculated to be ten from the elemental composition and 13C-NMR resonances attributable to methylene carbons. Therefore, as shown in Fig. 1, the structure of ardisiaquinone A (1) was elucidated as 2-hydroxy-5-methoxy-3-(10′-phenyldecyl)cyclohexa-2,5-diene-1,4-dione.
Table 1.
1H-NMR Spectroscopic Data for Ardisiaquinones A–H (
1–
8) (600 MHz, CDCl
3)
| C | 1 | 2 | 3 | 4 | 5 | 6 | 7 | 8 |
|---|
| 6 | 5.82 1H s | 5.83 1H s | 5.37 1H s | 5.37 1H s | | | | 5.37 1H s |
| 1′ | 2.44 2H t 7.6 | 2.44 2H t 7.6 | 2.37 2H t 7.6 | 2.37 2H t 7.6 | 2.44 2H t 7.6 | 2.40 2H t 7.6 | 2.42 2H t 7.6 | 2.37 2H t 7.6 |
| 2′ | 1.45 2H m | 1.45 2H m | 1.43 2H m | 1.43 2H m | 1.45 2H m | 1.44 2H m | 1.45 2H m | 1.43 2H m |
| 3′–8′ | 1.28 12H m | | 1.27 12H m | | 1.28 12H m | | | |
| 3′–9′ | | | | | | | | 1.28 14H m |
| 3′–10′ | | 1.27 16H m | | 1.27 16H m | | 1.27 16H m | 1.28 16H m | |
| 9′ | 1.60 2H m | | 1.61 2H m | | 1.45 2H m | | | |
| 10′ | 2.59 2H t 7.6 | | 2.59 2H t 7.8 | | 2.59 2H t 7.9 | | | 2.01 2H m |
| 11′ | | 1.60 2H m | | 1.61 2H m | | 1.61 2H m | 1.45 2H m | 5.34 1H m |
| 12′ | | 2.59 2H t 7.6 | | 2.59 2H t 7.8 | | 2.59 2H t 7.9 | 2.59 2H t 7.7 | 5.34 1H m |
| 13′ | | | | | | | | 2.01 2H m |
| 14′ | | | | | | | | 1.28 2H m |
| 16′ | | | | | | | | 1.28 2H m |
| 17′ | | | | | | | | 1.61 2H m |
| 18′ | | | | | | | | 0.88 3H t 7.0 |
| 6-Me | | | | | 1.93 3H s | 1.93 3H s | 1.93 3H s | |
| 5-OMe | 3.84 3H s | 3.85 3H s | | | | | 4.08 3H s | |
| 2″,6″ | 7.17 2H m | 7.18 2H m | 7.17 2H m | 7.17 2H m | 7.18 2H m | 7.18 2H m | 7.18 2H m | |
| 3″,5″ | 7.26 2H m | 7.26 2H m | 6.80 2H m | 7.25 2H m | 7.26 2H m | 7.26 2H m | 7.26 2H m | |
| 4″ | 7.16 1H m | 7.16 1H m | 7.16 1H m | 7.16 1H m | 7.16 1H m | 7.16 1H m | 7.16 1H m | |
| 2‴,6‴ | | | 7.05 2H d 8.2 | 7.05 2H d 8.2 | | | | 7.06 2H d 8.0 |
| 3‴,5‴ | | | 6.80 2H d 8.2 | 6.80 2H d 8.2 | | | | 6.80 2H d 8.0 |
| 7‴ | | | 2.87 2H t 6.0 | 2.87 2H t 7.0 | | | | 2.87 2H t 7.2 |
| 8‴ | | | 3.36 2H dt 6.0 7.0 | 3.36 2H dt 6.0 7.0 | | | | 3.37 2H dt 6.0 7.2 |
| –NH– | | | 6.42 1H br s | 6.42 1H br s | | | | 6.42 1H br s |
Table 2.
13C-NMR Spectroscopic Data for Ardisiaquinones A–H (
1–
8) and Dimethyl Ether (
5a) (150 MHz, CDCl
3)
| C | 1 | 2 | 3 | 4 | 5 | 5a | 6 | 7 | 8 |
|---|
| 1 | 181.6 | 181.7 | 178.9 | 178.9 | 179.7a) | 184.1 | 179.7a) | 183.7 | 178.9 |
| 2 | 151.6 | 151.5 | 154.8 | 154.8 | 152.5a) | 155.5 | 152.5a) | 150.8 | 154.9 |
| 3 | 119.3 | 119.3 | 115.9 | 115.9 | 116.1 | 126.4 | 116.1 | 118.8 | 115.9 |
| 4 | 182.8 | 182.8 | 182.4 | 182.4 | 183.8a) | 184.6 | 183.8a) | 184.2 | 182.4 |
| 5 | 161.2 | 161.2 | 149.5 | 149.5 | 161.9a) | 155.5 | 161.9a) | 157.2 | 149.6 |
| 6 | 102.2 | 102.2 | 91.8 | 91.8 | 111.6 | 131.0 | 111.6 | 122.7 | 91.8 |
| 1′ | 22.6 | 22.7 | 22.7 | 22.7 | 22.4 | 23.1 | 22.4 | 22.6 | 22.7 |
| 2′ | 28.0 | 28.0 | 28.1 | 28.1 | 28.1 | 28.9 | 28.0 | 28.3 | 28.0 |
| 3′–8′ | 3′–10′ | 3′–8′ | 3′–10′ | 3′–8′ | 3′–8′ | 3′–10′ | 3′–10′ | 3′–9′, 14′ |
| 29.30 | 29.36 | 29.33 | 29.26 | 29.33 | ca. 29.4 | 29.36 | 29.32×2 | 28.36 |
| 29.35 | 29.40 | 29.36 | 29.39 | 29.42 | | 29.45 | 29.45 | 28.41 |
| 29.46 | 29.52 | 29.49 | 29.52 | 29.49 | | 29.52 | 29.56 | 28.52 |
| 29.49 | 29.54 | 29.52×2 | 29.55×2 | 29.56×2 | | 29.59×2 | 29.57 | 28.58×2 |
| 29.53×2 | 29.57×2 | 29.55 | 29.58 | 29.57 | | 29.60 | 29.60 | 28.63×2 |
| | 29.63×2 | | 29.63×2 | | | 29.65×2 | 29.79 | 28.68 |
| 9′ | 31.5 | | 31.5 | | 31.5 | 31.5 | | | |
| 10′ | 36.0 | | 36.0 | | 36.0 | 36.0 | | | 27.2 |
| 11′ | | 31.5 | | 31.5 | | | 31.5 | 31.5 | 129.9 |
| 12′ | | 36.0 | | 36.0 | | | 36.0 | 36.0 | 129.9 |
| 13′ | | | | | | | | | 27.2 |
| 15′ | | | | | | | | | 31.8 |
| 16′ | | | | | | | | | 22.7 |
| 17′ | | | | | | | | | 14.1 |
| 6-Me | | | | | 7.4 | 8.4 | 7.4 | 7.4 | |
| 2-OMe | 56.7 | 56.7 | | | | 61.2b) | | 61.5 | |
| 5-OMe | | | | | | 61.0b) | | | |
| 1″ | 143.0 | 143.0 | 143.0 | 143.0 | 143.0 | 143.0 | 143.0 | 143.0 | |
| 2″,6″ | 128.2 | 128.2 | 128.2 | 128.2 | 128.2 | 128.2 | 128.2 | 128.2 | |
| 3″,5″ | 128.4 | 128.4 | 128.4 | 128.4 | 128.4 | 128.4 | 128.4 | 128.4 | |
| 4″ | 125.5 | 125.5 | 125.6 | 125.6 | 125.6 | 125.6 | 125.6 | 125.6 | |
| 1‴ | | | 129.5 | 129.5 | | | | | 129.5 |
| 2‴,6‴ | | | 129.8 | 129.8 | | | | | 129.8 |
| 3‴,5‴ | | | 115.9 | 115.9 | | | | | 115.9 |
| 4‴ | | | 155.1 | 155.1 | | | | | 155.1 |
| 7‴ | | | 33.5 | 33.5 | | | | | 33.5 |
| 8‴ | | | 44.1 | 44.1 | | | | | 44.2 |
a) Signals were assigned from HMBC correlations. b) Maybe interchangeable.
Ardisiaquinone B (2) was isolated as yellow crystals, and the elemental composition was determined to be C25H34O4, corresponding to two additional methylene units than in 1. Other spectroscopic data were essentially the same as those of 1. Therefore, as shown in Fig. 1, the structure of ardisiaquinone B (2) was as 2-hydroxy-5-methoxy-3-(12′-phenyldodecyl)cyclohexa-2,5-diene-1,4-dione.
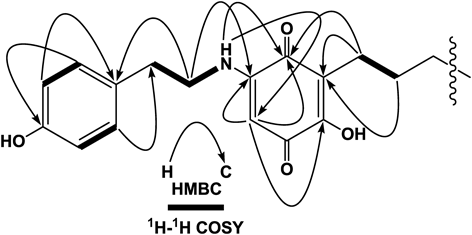
Ardisiaquinone C (3) was isolated as a red amorphous powder and its elemental composition was determined to be C30H37NO4 by HR-ESI-MS. The IR absorptions at 1653 and 1635 cm−1 were indicative of a quinonoid structure. In the 1H-NMR spectrum, instead of the methoxy signal observed in 1 and 2, four aromatic protons coupled in an AA′BB′ system were observed, and four methylene protons (–CH2–CH2–) and an amino proton (δH 6.42 br s) were correlated in 1H–1H correlation spectroscopy (COSY). In the HMBC spectrum, correlations were observed between H2-8‴ protons (δH 3.36) and C-1‴ (δC 129.5) and C-4 (δC 149.5), H-2‴ (6‴) (δH 7.05) and C-4‴ (δC 155.1), and H-3‴ (5‴) (δH 6.80) and C-1‴. Further correlations from the amino proton and C-4 and C-6 (δC 91.8) revealed the structure of the p-hydroxyphenethylamine moiety and its attachment at the 5-position of the quinonoid structure through the amino atom (Fig. 3). NMR spectroscopic data for the alkyl chain and a terminal benzene ring were similar those of 1. Therefore, as shown in Fig. 1, the structure of ardisiaquinone C (3) was confirmed as 2-hydroxy-5-(4‴-hydroxyphenethylamino)-3-(10′-phenyldecyl)cyclohexa-2,5-diene-1,4-dione.
Ardisiaquinone D (4) was isolated as a red amorphous powder and its elemental composition was determined to be C32H41NO4, corresponding to two methylene units more than in 3. Other spectroscopic data were similar to those of 3. Therefore, as shown in Fig. 1, the structure of ardisiaquinone D (4) was confirmed as 2-hydroxy-5-(4‴-hydroxyphenethylamino)-3-(12′-phenyldodecyl)cyclohexa-2,5-diene-1,4-dione.
Ardisiaquinone E (5) was isolated as an orange amorphous powder and its elemental composition was determined to be C23H30O4. Based on the IR absorptions at 1682 and 1649 cm−1 and NMR spectroscopic data, 5 was expected to be congeneric with the aforementioned compounds, but without methoxy and p-hydroxytyramine functional groups. In the 1H-NMR spectrum, a singlet aromatic proton attributable to the 6-position was replaced by a methyl group, whose NMR signals appeared at δH 1.93 and δC 7.4. The elemental composition revealed 23 carbons in 5. Nevertheless, only 19 signals were observed in the 13C-NMR spectrum (Table 2), i.e., the four signals, involved in the formation of the quinonoid skeleton were not observed, since the NMR data for the alkyl chain and the terminal benzene ring of 5 and 1 (or 3) were superimposable. In the HMBC spectrum, the H2-1′ (δH 2.44) proton showed a correlation cross peaks at δC 152.5 and 183.8, which were not seen in the 13C-NMR spectrum. Methyl proton (δH 1.93) correlation peaks at δC 152.5 (C-2), 183.8 (C-4) and 161.9 (C-5) along with 179.7 (C-1) because of the W-figure formation were also observed, although these four signals were not seen in the 13C-NMR spectrum (Table 2, Fig. 4a). Virtual 13C-NMR signals assigned at δC 183.8 and 179.7 were expected due to carbonyl carbons and at δC 161.9 and 152.5 due to phenolic hydroxy bearing carbons, that is to say these functional groups were interconvertible by keto-enol tautomerism. Ardisiaquinone E (5) was methylated with trimethylsilyldiazomethane (TMSCHN2) to give dimethylether (5a), which showed similar HMBC correlations to those of 5 between protons and existing carbon signals (Table 2, Fig. 4). Therefore, as shown in Fig. 1, the structure of 5 was confirmed as 2,5-dihydroxy-6-methyl-3-(10′-phenyldecyl)cyclohexa-2,5-diene-1,4-dione.
Ardisiaquinone F (6) was isolated as a red amorphous powder and its elemental composition was determined to be C25H34O4, corresponding to two more methylene units than in 5. Other spectroscopic data were similar to those of 5. Therefore, as shown in Fig. 1, the structure of 5 was confirmed as 2,5-dihydroxy-6-methyl-3-(12′-phenyldodecyl)cyclohexa-2,5-diene-1,4-dione.
Ardisiaquinone G (7) was isolated as an orange amorphous powder and its elemental composition was determined to be C26H36O4 by HR-ESI-MS. The IR absorptions at 1683 and 1649 cm−1 supported the presence of a quinonoid moiety, and in the 1H-NMR spectrum, methoxy (δH 4.08) and aromatic methyl (δH 1.93) signals were observed. HMBC correlations from the aromatic methyl protons with C-1 (δC 183.7), C-4 (δC 184.2), C-5 (δC 157.2), and C-6 (122.7), and H2-1′ (δH 2.42) and C-2 (δC 150.8), C-3 (δC 118.8), and C-4 confirmed the quinonoid structure to be 2-hydroxy-5-methoxy-6-methyl-3-alkylcyclohexa-2,5-diene-1,4-dione. The elemental composition and the 13C-NMR data supported the presence of a C12 alkyl chain and terminal benzene ring. Therefore, as shown in Fig. 1, the structure of 7 was confirmed as 2-hydroxy-5-methoxy-6-methyl-3-(12′-phenyldodecyl)cyclohexa-2,5-diene-1,4-dione.
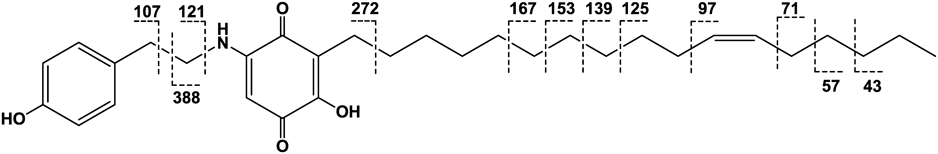
Ardisiaquinone H (8) was isolated as a red amorphous powder and its elemental composition was determined to be C31H45NO4. The IR spectrum exhibited two typical absorptions (1682 and 1649 cm−1) for the quinonoid skeleton. In the 1H-NMR spectrum, one singlet aromatic proton signal (δH 5.37), four proton signals coupled in an AA′BB′ system, two olefinic protons [δH 5.34 (2H, m)], and an amino proton [δH 6.42 (1H, br s)] together with a considerable number of methylene protons were observed (Table 1). Detailed inspection of one- and two-dimensional NMR spectroscopic data (Fig. 5) confirmed the presence of a 5-amino-2-hydroxy-3-alkylcyclohexa-2,6-dien-1,4-dione and p-hydroxytyramine along with a long alkyl chain. However, signals attributable to a terminal monosubstituted benzene ring, as seen in the NMR spectra of the aforementioned compounds, were not observed. Based on the NMR spectroscopic data and the elemental composition, the side chain was found to comprise 17 carbon atoms and one double bond. The length of the carbon chain and the position of the double bond were different from those in related compounds, maesanin (13)11,12) and ardisianones A and B, isolated from Ardisia japonica.14) The geometry of the double bond was expected to be in a Z-form from the 13C-NMR chemical shifts of the methylene carbons adjacent to the double bond (C-10′: 27.2 and C-13′: 27.2), compared with those reported in maesanin (15)11,12) (C-9′: 26.9 and C-12′: 27.1) and ardisianones A (C-9′: 27.3 and C-12′: 27.0) and B (C-7′: 27.2 and C-10′: 26.9). This was confirmed by the NMR data reported for Z-5-decene (C-4 and C-7: 27.5) and E-5-decene (C-4 and C-7: 32.9).15) The position of the double bond was determined by electron impact (EI)-MS. Observation of the crucial fragment ion at m/z 97, together with m/z 71, placed the double bond between C-11′ and C-12′ (Fig. 6). Therefore, as shown in Fig. 1, the structure of 8 was confirmed as 2-hydroxy-5-(4″-hydroxyphenethylamino)-3-(11′Z-heptadecenyl)cyclohexa-2,5-diene-1,4-dione.
Leishmaniasis is a disease caused by protozoan parasites that belongs to the Leishmania genus and is transmitted by the bite of certain species of sand fly. It affects as many as 12 million people worldwide, with 1.5–2 million new cases each year. Several potential vaccines are being developed, under pressure from the WHO but as of 2013, none are available. For development of effective natural compounds to cure Leishmaniasis, the anti-Leishmania activity of new compounds was assayed. The results are summarized in Table 3 and show that some compounds had moderate activity, with an IC50 range of 40.1–87.3 µM. However, their activities were always associated with cytotoxicity.
Table 3. Anti-
Leishmania Activity and Cytotoxicity toward A549 Cells
| Anti-Leishmania IC50 (µM) | Cytotoxicity IC50 (µM) |
|---|
| 1 | 65.8±4.5 | 55.7±12.1 |
| 2 | 62.7±6.2 | 44.2±8.0 |
| 3 | NA | 67.9±4.6 |
| 4 | NA | 75.6±1.2 |
| 5 | 80.7±8.4 | 12.7±0.3 |
| 6 | 87.3±0.9 | 15.2±7.3 |
| 7 | 77.5±3.6 | 47.5±7.3 |
| 8 | NA | 67.0±6.4 |
| Mil | 19.0±0.5 | NT |
| Eto | NT | 36.7±0.5 |
NA: not active. NT: not tested. Mil: Miltefosin. Eto: Etoposide. Positive controls. Each value represents the mean±S.D. with triplicate experiments.
Experimental
General Experimental ProcedureMelting points were measured with a Yanagimoto micro-melting point apparatus and are uncorrected. Optical rotations were measured on a JASCO P-1030 digital polarimeter. IR and UV spectra were recorded on Horiba FT-710 and JASCO V-520 UV/Vis spectrophotometers, respectively. 1H- and 13C-NMR spectra were taken on a Bruker Avance III 600 spectrometer at 600 MHz and 150 MHz with tetramethylsilane as an internal standard. Positive-ion HR-ESI-MS were performed with an Applied Biosystems QSTAR XL NanoSpray™ System and EI-MS was obtained with a JEOL JMS-GC MATE spectrometer.
Silica gel and reversed-phase open CC were performed on silica gel 60 (E. Merck, Darmstadt, Germany) and Cosmosil 75C18-OPN (Nacalai Tesque, Kyoto, Japan), respectively. HPLC were performed on columns (octadecyl silanized silica gel (ODS), Inertsil; GL Science, Tokyo, Japan; Φ=6 mm, L=25 cm, 1.6 mL/min and Φ=10 mm, L=25 cm, 2.8 mL/min) and Cosmosil Cholester (Nacalai Tesque, Φ=10 mm, L=25 cm, 2.8 mL/min), and the eluate was trailed with UV (254 nm) and refractive index monitors.
Plant MaterialLeaves of A. quinquegona were collected in Kunigami-gun, Okinawa in July, 1992. A voucher specimen was deposited in the Herbarium of Department of Pharmacognosy, Graduate School of Biomedical and Health Sciences, Hiroshima University (Accession No. 97-MQ-0728-Okinawa).
Extraction and IsolationAir-dried leaves (1.59 g) of A. quinquegona were extracted three times with MeOH (4.5 L×3) at room temperature for one week and then concentrated to 3 L in vacuo. The concentrated extract was washed with n-hexane (3 L, 32.9 g) and then the MeOH layer was concentrated to a gummy mass. The latter was suspended in water (3 L) and then extracted with EtOAc (3 L) to give 56.2 g of an EtOAc-soluble fraction. The aqueous layer was extracted with 1-BuOH (3 L) to give a 1-BuOH-soluble fraction (113 g), and the remaining water-layer was concentrated to furnish 96.2 g of a water-soluble fraction.
The n-hexane-soluble fraction (32.0 g) was subjected to silica gel (300 g) column chromatography (CC) with elution with n-hexane (2 L), n-hexane–EtOAc [(19 : 1, 2 L), (9 : 1, 2 L), (4 : 1, 2 L), (3 : 1, 2 L), (2 : 1, 2 L) and (1 : 1, 2 L)] and EtOAc (1 L), 500 mL-fractions being collected. The residue (2.36 g) in faction 2 was separated by reversed-phase silica gel (150 g) CC with elution with MeOH–H2O [(4 : 1, 1 L), (17 : 3, 1 L), (9 : 1, 1 L) and (19 : 1, 1 L)], MeOH (1 L), MeOH–(CH3)2CO (1 : 1. 1 L) and (CH3)2CO (1 L), 1 L-fractions being collected to give seven fractions. The residue (107 mg) in the third fraction was separated again by silica gel (50 g) CC with a linear gradient solvent system [n-hexane (200 mL)→n-hexane–EtOAc (19 : 1, 200 mL)], 5 mL-fractions being collected. The residue (27.1 mg) in fractions 13–18 was purified by HPLC (Cosmosil Cholester) [H2O–(CH3)2CO, (3 : 17)] to give 3.6 mg of 8.
The residue (65.0 g) of the EtOAc-soluble fraction was subjected to silica gel (1.5 kg) CC with elution with n-hexane (2 L), n-hexane–EtOAc [(20 : 1, 2 L), (10 : 1, 2 L), (5 : 1, 2 L), (2 : 1, 2 L), (1 : 1, 2 L) and (1 : 2, 2 L)], EtOAc (2 L), EtOAc–(CH3)2CO (1 : 1, 2 L) and (CH3)2CO (2 L), 2 L-fractions being collected. The residue (1.55 g) in fraction 4 was separated by reversed-phase silica gel (150 g) CC with elution with MeOH–H2O [(1 : 9, 1 L), (1 : 4, 1 L), (3 : 7, 1 L), (2 : 3, 1 L), (1 : 1, 1 L), (3 : 2, 1 L), (17 : 3, 1 L), (7 : 3, 1 L), (3 : 1, 1 L), (4 : 1, 1 L) (17 : 3, 1 L), (87 : 13, 1 L), (9 : 1, 1 L), (23 : 2, 1 L), (19 : 1, 1 L) and (97 : 3, 1 L)], MeOH (1 L) and (CH3)2CO (1 L), 1 L-fractions being collected to give 17 fractions. The residue (246 mg) in the twelfth fraction was purified by HPLC (Inertsil ODS) [H2O–(CH3)2CO, 1 : 3] to give 5.2 mg of 11. The residue (3.01 g) in fraction 5 was separated by reversed-phase silica gel (150 g) CC with elution with MeOH–H2O [(1 : 9, 1 L), (1 : 4, 1 L), (3 : 7, 1 L), (2 : 3, 1 L), (1 : 1, 1 L), (3 : 2, 1 L), (17 : 3, l L), (7 : 3, 1 L), (3 : 1, 1 L), (4 : 1, 1 L), (17 : 3, 1 L), (87 : 13, 1 L), (9 : 1, 1 L), (23 : 2, 1 L), (19 : 1, 1 L) and (97 : 3, 1 L)], MeOH (1 L) and (CH3)2CO (1 L), 1 L-fractions being collected to give 17 fractions. The residue (312 mg) in the tenth fraction was purified by HPLC (Cosmosil Cholester) [H2O–(CH3)2CO, 1 : 3] to give 88.1 mg of 1. The residue (592 mg) in the eleventh fraction was further separated by silica gel (100 g) CC with a linear gradient solvent system [n-hexane–EtOAc (19 : 1, 400 mL)→n-hexane–EtOAc (1 : 2, 400 mL)], 3 mL-fractions being collected. The residue (83.6 mg) in fractions 7–19 was purified by HPLC (Inertsil ODS) [H2O–(CH3)2CO, (19 : 1)] to give 4.1 mg of 3. The residue (303 mg) in fractions 20–38 was similarly purified by HPLC (Cosmosil Cholester) [H2O–(CH3)2CO, 1 : 3] to give 111 mg of 2. The residue (430 mg) in the twelfth fraction was purified by HPLC (Cosmosil Cholester) [H2O–(CH3)2CO, 1 : 3] to give 77.0 mg of 6 and two residues, 56.8 mg and 57.0 mg. The former and the latter were further purified by HPLC (Cosmosil Cholester) [H2O–(CH3)2CO, 11 : 29] to give 22.9 mg of 4 and 27.7 mg of 7, respectively. The residue (93.1 mg) in the fourteenth fraction was purified HPLC [(Inertsil ODS) H2O–(CH3)2CO, 1 : 3] to give 4.0 mg of 12.
The residue (3.17 g) in fraction 6 was separated by reversed-phase silica gel (150 g) CC with elution with MeOH–H2O [(1 : 9, 1 L), (1 : 4, 1 L), (3 : 7, 1 L), (2 : 3, 1 L), (1 : 1, 1 L), (3 : 2, 1 L), (7 : 3, 1 L), (4 : 1, 1 L) and (9 : 1, 1 L)], MeOH (1 L) and (CH3)2CO (1 L), 1 L-fractions being collected to give eleven fractions. The residue (492 mg) in the second fraction was purified by silica gel (75 g) CC with a linear gradient solvent system [CHCl3 (200 mL)→CHCl3–MeOH (9 : 1, 200 mL)], 3 mL-fractions being collected. The residue (492 mg) in the second fraction was purified by silica gel CC with a linear gradient solvent system [CHCl3 (200 mL)→CHCl3–MeOH (9 : 1, 200 mL)], 3 mL-fractions being collected, to give 17.2 mg of 9 in fractions 7–16. The residue (776 mg) in the tenth fraction was purified by HPLC (Cosmosil Cholester) [H2O–(CH3)2CO, 1 : 3] to yield 16.4 mg of 5 and 38.3 mg of 6.
The residue (3.17 g) in fraction 6 was separated by reversed-phase silica gel (150 g) CC with elution with MeOH–H2O [(1 : 9, 1 L), (1 : 4, 1 L), (3 : 7, 1 L), (2 : 3, 1 L), (1 : 1, 1 L), (3 : 2, 1 L), (7 : 3, 1 L), (4 : 1, 1 L) and (9 : 1, 1 L)], MeOH (1 L) and (CH3)2CO (1 L), 1 L-fractions being collected to give thirteen fractions. The residue (564 mg) in the second fraction was further purified by silica gel CC with a linear gradient solvent system [CHCl3 (200 mL)→CHCl3–MeOH (9 : 1, 200 mL)], 3 mL-fractions being collected, to give 98.6 mg of 10 in fractions 14–21.
Ardisiaquinone A (1)Yellow needles; mp 77–79°C (MeOH); IR νmax (film) cm−1: 3423, 3025, 2921, 1662, 1634, 1464, 1114, 1027, 720; UV λmax (MeOH) nm (log ε): 428 (2.20), 343 (3.59), 279 (4.07), 210 (4.07); 1H-NMR (600 MHz, CDCl3): Table 1; 13C-NMR (150 MHz, CDCl3): Table 2; HR-ESI-MS (positive-ion mode) m/z: 393.2039 [M+Na]+ (Calcd for C23H30O4Na: 393.2036).
Ardisiaquinone B (2)Yellow needles; mp 81–83°C (MeOH); IR νmax (film) cm−1: 3418, 3025, 2920, 1662, 1634, 1464, 1114, 1029, 720; UV λmax (MeOH) nm (log ε): 425 (2.24), 351 (3.50), 283 (4.12), 211 (3.92); 1H-NMR (600 MHz, CDCl3): Table 1; 13C-NMR (150 MHz, CDCl3): Table 2; HR-ESI-MS (positive-ion mode) m/z: 421.2352 [M+Na]+ (Calcd for C25H34O4Na: 421.2352).
Ardisiaquinone C (3)Red amorphous powder; IR νmax (film) cm−1: 3418, 3250, 3024, 2921, 2850, 1653, 1635, 1601, 1456, 1210, 1120, 720; UV λmax (MeOH) nm (log ε): 502 (2.76), 311 (3.65), 211 (3.53); 1H-NMR (600 MHz, CDCl3): Table 1; 13C-NMR (150 MHz, CDCl3): Table 2; HR-ESI-MS (positive-ion mode) m/z: 498.2618 [M+Na]+ (Calcd for C30H37NO4Na: 498.2615).
Ardisiaquinone D (4)Red amorphous powder; IR νmax (film) cm−1: 3409, 3273, 3031, 2916, 2848, 1653, 1635, 1456, 1119, 720; UV λmax (MeOH) nm (log ε): 500 (2.64), 310 (3.55), 211 (3.43); 1H-NMR (600 MHz, CDCl3): Table 1; 13C-NMR (150 MHz, CDCl3): Table 2; HR-ESI-MS (positive-ion mode) m/z: 526.2927 [M+Na]+ (Calcd for C32H41NO4Na: 526.2928).
Ardisiaquinone E (5)Orange amorphous powder; IR νmax (film) cm−1: 3523, 3363, 2926, 2854, 1682, 1649, 1456, 1225, 1129, 748; UV λmax (MeOH) nm (log ε): 463 (2.08), 360 (3.81), 287 (3.85), 214 (3.68); 1H-NMR (600 MHz, CDCl3): Table 1; 13C-NMR (150 MHz, CDCl3): Table 2; HR-ESI-MS (positive-ion mode) m/z: 393.2037 [M+Na]+ (Calcd for C23H30O4Na: 393.2036).
Ardisiaquinone F (6)Orange amorphous powder; IR νmax (film) cm−1: 3504, 3327, 2917, 2850, 1682, 1649, 1457, 1268, 1122, 748; UV λmax (MeOH) nm (log ε): 462 (2.09), 359 (2.87), 287 (3.81), 215 (3.66); 1H-NMR (600 MHz, CDCl3): Table 1; 13C-NMR (150 MHz, CDCl3): Table 2; HR-ESI-MS (positive-ion mode) m/z: 421.2359 [M+Na]+ (Calcd for C25H34O4Na: 421.2349).
Ardisiaquinone G (7)Yellow amorphous powder; IR νmax (film) cm−1: 3333, 2922, 2851, 1683, 1649, 1456, 1222, 1124, 1058, 765; UV λmax (MeOH) nm (log ε): 430 (2.13), 323 (3.70), 286 (4.14), 214 (4.15); 1H-NMR (600 MHz, CDCl3): Table 1; 13C-NMR (150 MHz, CDCl3): Table 2; HR-ESI-MS (positive-ion mode) m/z: 435.2506 [M+Na]+ (Calcd for C26H36O4Na: 435.2506).
Ardisiaquinone H (8)Red amorphous powder; IR νmax (film) cm−1: 3336, 3262, 2961, 2852, 1682, 1649, 1456, 1210, 1121, 1081, 764; UV λmax (MeOH) nm (log ε): 497 (3.23), 311 (3.80), 219 (3.74); 1H-NMR (600 MHz, CDCl3): Table 1; 13C-NMR (150 MHz, CDCl3): Table 2; HR-ESI-MS (positive-ion mode) m/z: 518.3231 [M+Na]+ (Calcd for C31H45NO4Na: 518.3241); EI-MS m/z (rel. int. %): 495 [M]+, 390 (7), 388 (100), 272 (27), 167 (11), 153 (5), 139 (6), 125 (2), 107 (30), 97 (2), 71 (1), 57 (4), 43 (6).
Methylation of Ardisiaquinone E (5)Ardisiaquinone E (5) (6.0 mg) in 50 µL of MeOH–CH3CN (1 : 9) was stirred with 15 µmol of N,N-diisopropylethylamine and 30 µmol of TMSCHN2 for 1 h at 25°C. The reaction mixture was evaporated and the residue was purified by prep. TLC (n-hexane–EtOAc, 4 : 1) to give 2.0 mg of Ardisiaquinone E dimethyl ether (5a). Ardisiaquinone E dimethyl ether (5a): yellow amorphous powder; IR νmax (film) cm−1: 3026, 2927, 1699, 1683, 1512, 1457, 1316, 1267, 1219, 696; UV λmax (MeOH) nm (log ε): 434 (2.15), 389 (2.78), 260 (3.89), 211 (4.16); 1H-NMR (600 MHz, CDCl3): δ7.26 (2H, m, H-3′ and 5′), 7.18 (2H, m, H-2′ and 6′), 7.16 (1H, m, H-4′), 3.99, 4.00 (3H each, each s, –OCH3 at C-2 and C-5), 2.59 (2H, t, J=7.8 Hz, H2-16), 2.40 (2H, t, J=7.6 Hz, H2-7), 1.93 (3H, s, –CH3 at C-3), 1.61 (2H, m, H2-15), 1.39 (2H, m, H2-8), 1.28 (12H, m, H2-9–H2-14); 13C-NMR (150 MHz, CDCl3): Table 2; HR-ESI-MS (positive-ion mode) m/z: 421.2348 [M+Na]+ (Calcd for C25H34O4Na: 421.2349).
Methylation of Ardisiaquinone F (6)Ardisiaquinone G dimethyl ether (6a) (1.8 mg) was obtained from ardisiaquinone G (6) (5.2 mg) by the method used for the preparation of ardisiaquinone E dimethyl ether (5a). Ardisiaquinone F dimethyl ether (6a): yellow amorphous powder; IR νmax (film) cm−1: 3026, 2927, 1698, 1682, 1511, 1456, 1316, 1266, 1219, 697; UV λmax (MeOH) nm (log ε): 430 (2.37), 383 (2.93), 252 (3.87), 210 (4.13); 1H-NMR (600 MHz, CDCl3): δ7.26 (2H, m, H-3′ and 5′), 7.18 (2H, m, H-2′ and 6′), 7.16 (1H, m, H-4′), 3.99, 4.00 (3H each, each s, –OCH3 at C-2 and C-5), 2.59 (2H, t, J=7.8 Hz, H2-16), 2.40 (2H, t, J=7.6 Hz, H2-7), 1.93 (3H, s, -CH3 at C-3), 1.61 (2H, m, H2-15), 1.39 (2H, m, H2-8), 1.28 (12H, m, H2-9–H2-14); 13C-NMR (150 MHz, CDCl3): Table 2; HR-ESI-MS (positive-ion mode) m/z: 449.2661 [M+Na]+ (Calcd for C27H38O4Na: 449.2662).
Anti-Leishmania ActivityThe anti-Leishmania major activity toward promastigotes was determined by the colorimetric cell viability 3-(4,5-dimethylthiazol-2-yl)-2,5-diphenyltetrazolium bromide (MTT) assay. The promastigotes at the logarithmic growth phase were cultured in M199 medium supplemented with 10% heat-inactivated fetal bovine serum and 100 µg/mL of kanamycin. In a 96-well plate, 1 µL aliquot of sample solutions and L. major cells (1×10⁵ cells/well) in 100 µL medium were added to each well, and then the plate was incubated at 27°C under an ambient atmosphere for 72 h. A solution of MTT (100 µL) was then added to each well and the incubation was continued overnight. The formazan product of MTT reduction was then dissolved in dimethyl sulfoxide (DMSO) and then the absorbance was measured using a Molecular Devices Versamax tunable microplate reader. DMSO was used as a negative control and amphotericin B as a positive control. The experiment was performed in triplicate. The anti-Leishmania major activity was quantified as the percentage of the control absorbance of reduced dye at 540 nm. The inhibitory activity was calculated as:
where
Acontrol is the absorbance of the control (DMSO) well,
Atest the absorbance of the test wells, and
Ablank the absorbance of the cell-free wells.
Cytotoxic Activity toward Lung Adenocarcinoma, A549 CellsCytotoxic activity toward lung adenocarcinoma cells was determined by colorimetric cell viability assay using MTT. Lung adenocarcinoma cell line A549 was purchased from the JCRB Cell Bank, Japan. A549 cells were cultured in Dulbecco’s modified Eagle’s medium supplemented with 10% heat inactivated fetal calf serum, and kanamycin (100 µg/mL) and amphotericin B (5.6 µg/mL).
In a 96-well plate, 1 µL aliquots of sample solutions and the cancer cells (5×10³ cells/well) in 100 µL medium were added to each well, and then the plate incubated at 37°C under a 5% CO2 atmosphere for 72 h. A solution of MTT (100 µL) was then added to each well and the incubation was continued for a further 1 h. The absorbance of each well was measured at 540 nm using a Molecular Devices Versamax tunable microplate reader. DMSO was used as a negative control and doxorubicin as a positive control. The cytotoxic activity was calculated as:
where
Acontrol is the absorbance of the control (DMSO) well,
Atest the absorbance of the test wells, and
Ablank the absorbance of the cell-free wells.