Abstract
Dry powder inhalation (DPI) has attracted much attention as a treatment for respiratory diseases owing to the large effective absorption area in a human respiratory system. Understanding the drug particle motion in the respiratory system and the deposition behavior is necessary to improve the efficiency of DPI. We conducted computer simulations using a model coupling a discrete element method and a computational fluid dynamics method (DEM–CFD) to evaluate the particle deposition in human respiratory system. A simple artificial respiratory model was developed, which numerically investigated the effect of particle properties and inhalation patterns on the particle deposition behavior. The DEM–CFD simulations demonstrated that the smaller- and lower-density particles showed higher reachability into the simple respiratory model, and the particle arrival ratio to the deep region strongly depended on the aerodynamic diameter. The particle arrival ratio can be described as an exponential function of the aerodynamic diameter. Furthermore, the exponential relationship between the particle reachability into the depth of the simple respiratory model and the aerodynamic diameter predicted the particle aerodynamic diameter based on the required reachability. The particle shape also had an impact on the particle deposition behavior. The rod-like particles with a larger aspect ratio indicated higher reachability into the depth of the simple respiratory model. This was attributed to the high velocity motion of the particles whose long axis was in the direction of the deep region.
Introduction
Inhalation therapy is effective for treating respiratory diseases such as bronchial asthma and chronic obstructive pulmonary diseases.1,2) Compared to oral administration and injection, inhalation has the advantage of drug absorption because of the effective absorption area in the lung and the thin epithelial cells. Recently, it has attracted attention as a novel administration route for hardly absorbable drugs, such as peptide, which cannot be absorbed from the gastrointestinal tract.3) Inhalation can be broadly classified into metered dose inhalation4) and dry powder inhalation (DPI) depending on its mechanism and principle. Due to its high portability and environmental friendliness, DPI has been actively developed.5–9) DPI is a dosage form intended to deliver powdered drugs to the respiratory system through the patient’s inhaled air stream.10,11) To fully demonstrate the drug effect of inhalation therapy, the inhaled drugs must be effectively deposited in the respiratory system, such as the airway mucosa and the lung. The factors affecting DPI deposition in the respiratory system include the inhalation pattern and disease state of the patient, as well as the particle properties (aerodynamic diameter and shape). Regarding particle aerodynamic diameter, particles with different aerodynamic diameters deposit in different areas in the respiratory system: 30–70 µm particles in the nasal cavity, 20–30 µm in the pharynx, 10–20 µm in the larynx, 8–10 µm in the trachea, 5–8 µm in the bronchial tube, 3–5 µm in the bronchiole, and 0.5–3 µm in the alveoli.12) The particle shape affects the deposition of DPI particles. Some studies have reported that inertial collision is the dominant mechanism of the deposition phenomena in the human respiratory system in the case of fibrous particles (non-spherical particles).13–16) Moreover, the inhalation pattern plays an important role in particle deposition in the human respiratory system. The shallow tachypnea leads the particle deposition from the upper trachea to the pharynx because of turbulence in the trachea induced by an increase in the inhalation speed, while slow and deep breathing results in easy and uniform deposition at the alveoli.
Experimental studies have been conducted to improve the particle reachability into the human respiratory system. In the experimental investigation, a cascade impactor is generally used to evaluate the inhalation performance, which has a series of stages that collect the particles by using inertial collision.17–20) Because the cut-off diameter decreases for lower stages, the aerodynamic diameter distribution can be measured. In in vitro experiments conducted with a cascade impactor, a constant flow rate is suitable for the standard tests of formulations. The cascade impactor, however, faces difficulty in estimating the particle reachability into the human respiratory system of the individual patient because the human respiratory systems show complex geometric structures and individual differences. Analyses of the deposition phenomena and tracks of the drug particles are necessary to design the DPI with excellent particle reachability into the human respiratory system, leading to improvement in the inhalation treatment effect.
Numerical simulation is a powerful tool to analyze the particle motion and deposition in the respiratory system.21–23) Thus far, a multiphase flow model of computational fluid dynamics (CFD) has been applied to calculate particulate flows in the respiratory system. As the multiphase flow model, a method coupled with CFD and a discrete phase model (DPM)24,25) was frequently used. The CFD–DPM model enables us to analyze the particle motion in the fluid with a low calculation cost under the assumption that a particle is a mass point. As a simple model of the human respiratory system, Weibel proposed a network-like airway with symmetrical tracheas whose lengths and thicknesses were experimentally obtained.26) Analyses of the transport and particle deposition in the Weibel airway model revealed that the generated position of particles significantly affects the deposition behavior.27) Kleinstreuer et al.28) investigated the effect of gravity on the particle deposition behavior in bronchioles (G6–G9). The results suggested that the deposition pattern in the deep part of the human respiratory system changes due to particle sedimentation, especially when the inhalation flow rate is small. In addition, they analyzed the motion of micron- and nano-sized particles in the bronchi (G0–G15) and summarized the local concentration of the deposition particles.29) The result indicated that the deposition position and local concentration of micron- and nano-sized particles are significantly different and micron-sized particles are much affected by the model structure and airflow behavior. Recent studies have used the realistic model constructed by the computed tomography scan of the human respiratory system. Rahimi-Gorji et al.30,31) conducted a numerical analysis of fluid and particle deposition behavior under three respiratory conditions of light breathing, normal respiration, and heavy breathing. According to Kadota et al.,32,33) the CFD–DPM simulations with a realistic respiratory geometry demonstrated that smaller particles reach the deeper region. The effect of inhalation and exhalation on particle behavior was investigated by Oakes et al.34) They showed that approximately twice as many particles are deposited during inhalation than that during exhalation. They also revealed that most of the particles deposit on the branch of the bronchus in case of inhalation, while exhalation deposits particles uniformly in the direction depending on gravity.
The previous studies on computer simulations mainly employed the CFD–DPM model, which did not account for particle collision, aggregation, and breakage. Also, in the CFD–DPM investigation, the interaction between particle and surface of simulation model (both Weibel and realistic models) was ignored. The particle–wall interaction boundary condition was usually assumed to be a full trapped wall. It was explained that this boundary condition was based on the existence of mucus layers coated on the inner wall of human respiratory system. However, when the particles collide on the wet wall, the particles should be trapped on the wall only if the particle velocity was less than the critical collision velocity, ucr. Based on the Ennis’ paper,35) the ucr was given by
 | (1) |
where μ, d, mp, e, z, and za are the liquid viscosity coefficient, particle radius, particle mass, restitution coefficient, thickness of the liquid film, and particle surface roughness, respectively. Here, the values of the viscosity coefficient of the mucous membrane on the bronchus (mucin solution) and z/za were assumed from literatures (μ = 1.5 mPa·s, z/za = 20).35–37) The restitution coefficient was assumed as 0.2 in order to overestimate. Under these assumptions, ucr of a particle of 10 µm and 1000 kg/m3 was estimated to be 4.66 m/s. For example, the particle velocity in the previous study by Rahimi-Gorji31) was up to 7 m/s, and therefore it was estimated that the particle would not trap on the wall of the human respiratory system. It is necessary to consider the particle–wall interaction on the investigation of particle motions in the human respiratory system. Also, the consideration of particle size/shape, adhesion phenomenon, and inhalation pattern is very important for the analysis of the particle motion and evaluation of the particle reachability into the human respiratory system. In a recent study, a coupled model with a discrete element model (DEM) and CFD (DEM–CFD model) was used to evaluate the performance of DPI.38) DEM follows Newton’s second law to calculate an individual particle’s motion, which accounts for friction, contact plasticity, cohesion, and other interactions. Regarding particle behavior in the respiratory system, the deposition efficiency calculated by the DEM–CFD simulation with the Weibel's model obtained a good agreement with the experimental data compared to the CFD–DPM simulation.39,40) These results suggested that the consideration of particle–particle adhesion and rigid-body particles were important. However, in the previous DEM–CFD investigation, the particle–wall interaction was ignored. Moreover, the fluid behavior should affect the particle deposition because the drag force on the particles is the important factor for adhesion and removal of particles. The evaluation of the effect of particle–wall interaction during different inhalation conditions (large/small inhalation flows) on the particle deposition behavior in the human respiratory system is not sufficient. Furthermore, DEM–CFD model can also calculate the non-spherical particle motions, although it is difficult with the CFD–DPM model because of the assumption that a particle is a mass point.
In the present study, computer simulations with the DEM–CFD model are conducted to investigate the particle deposition behavior in the respiratory system and particle reachability. The DEM–CFD model quantitatively analyzes particle transportation considering the particle shape and adhesion between the particle and the surface of human respiratory system. As a first step, this paper tries to develop a simple respiratory structure and uses the adhesion force based on the Johnson–Kendall–Roberts (JKR) theory to simulate the particle motions and airflow behaviors in the respiratory system. The effects of particle sizes, particle densities, inhalation patterns, and particle shapes on particle reachability into the human respiratory system are investigated. This is the first study to numerically analyze the effect of the particle–wall interaction and particle shape on the deposition behavior in the human respiratory system, which can be investigated only by using DEM.
Simulation Method
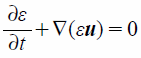
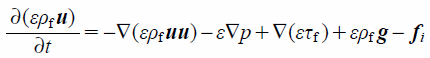
Simulation ModelThe particle motion behavior in the respiratory system was evaluated using the DEM–CFD model.41) The fluid phase was calculated as a nonsteady calculation of incompressible fluid. In the DEM–CFD model, the governing equations of the fluid based on the local volume average are expressed as
 | (2) |
 | (3) |
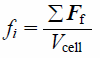
where ε, u, ρf, p, and τf indicate the local void fraction, fluid velocity vector, fluid density, fluid pressure, and stress–strain tensor, respectively. fi is the volumetric particle–fluid interaction force given by
 | (4) |
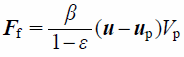
where Ff is the drag force exerted on the particle and Vcell is the volume of the cell. Using the local void fraction, ε, and the difference between the local average velocity of particles and fluid, Ff is calculated as
 | (5) |
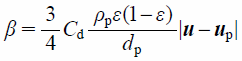
Here, the fluid–particle momentum-exchange coefficient, β, is calculated based on the Schiller–Naumann model42) as
 | (6) |
where Cd is the drag coefficient. In case of the spherical particle, Cd is defined as
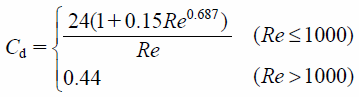 | (7) |
where Re is the relative Reynolds number, and is expressed as
 | (8) |
On the other hand, Cd in the calculation of aspherical particles is applied as the Ganser model,43) which is given by
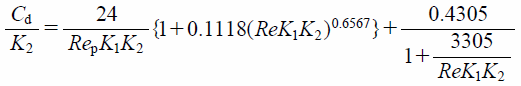 | (9) |
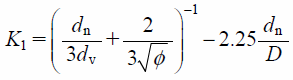 | (10) |
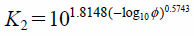 | (11) |
where K1 is the Stokes’ shape factor and K2 is the Newton’s shape factor. dn and dv are the diameter of a sphere with equivalent projected area and that of a sphere with equivalent volume, respectively. φ is given as φ = (ds/dn)−1, where ds is the diameter of a sphere with equivalent surface area.
The particle motion is governed by Newton’s second law as
 | (12) |
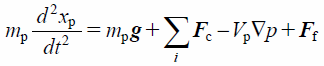
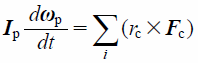 | (13) |
where mp, xp, g, Fc, Vp, p, Ip, ωp, and rc indicate the mass of the particle, position of the particle, gravitational force, contact force exerted on the particle, volume of the particle, pressure, rotational inertia of the particle, angular velocity of the particle, and distance of the contact point from the particle center, respectively. Note that −Vp∇p is a pressure gradient term. In the DEM–CFD method, the term of fluid drag, Ff, is added. Contact forces of particle–particle and particle–wall, Fc, were based on the JKR theory.44) The JKR theory is a model that can represent the general adhesion phenomenon. In the JKR model, the elastic and cohesive forces in the normal direction, Fc_n, are related to the surface energy, γ, and contact radius, a, which is written as
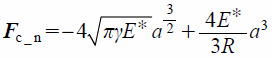 | (14) |
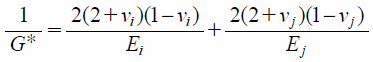
where R is the particle radius. The reduced Young’s modulus, E*, is defined as
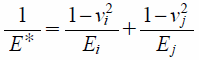 | (15) |
where E, ν, and subscripts (i and j) are Young’s modulus, Poisson’s ratio, and identified particles, respectively. The normal damping force, Fc_dn, is defined by
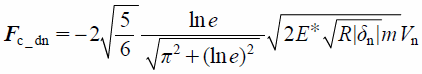 | (16) |
where e and Vn are the coefficient of restitution and the relative velocity of particles, respectively. The normal normal overlap, δn, is defined by
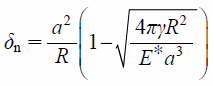 | (17) |
The contact force in the tangential direction includes the elastic and damping forces, Fc_t and Fc_dt, which are given by
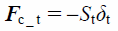 | (18) |
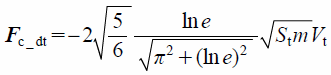 | (19) |
 | (20) |
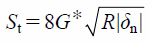
 | (21) |
where St, δt, Vt, and G* are the tangential stiffness, tangential overlap, tangential component of relative velocity, and equivalent shear modulus, respectively. The tangential contact force, Fc_t, is limited by Coulomb friction μsFc_n, where μs is the coefficient of static friction.
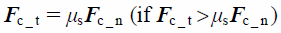 | (22) |
Although the appropriate adhesion force exerted between the particle and human respiratory system is the liquid bridge force, it is difficult to apply to DEM simulation due to the high calculation cost and difficulty of the estimation of liquid volume. As the first step, the JKR theory was applied to calculate the adhesion force between the particle–particle and particle–wall. So far, the JKR theory was just applied to DEM simulations of wet materials.45–48)
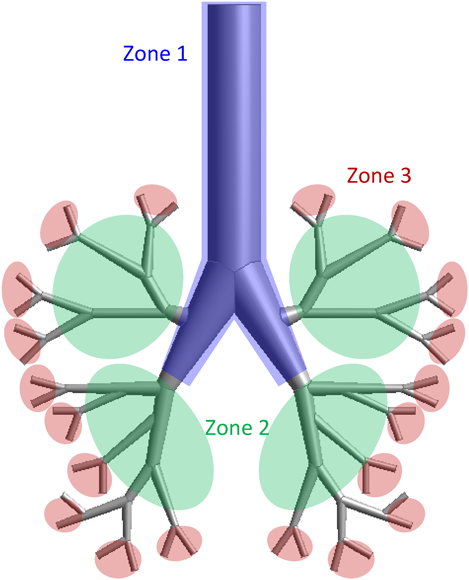
Model GeometryThe geometry of the respiratory system was generated using software (ANSYS Design Modeler Version 17.2, ANSYS Inc.). In this study, since the Weibel airway model was too simple to represent the real airways and the realistic model was too specific to perform the parametric study, the proposed respiratory model was a simple symmetrical model and a more realistic airway model (Fig. 1, simple respiratory model). The bronchi are maximally branched to six and narrowed with branching (2.8–20 mm). The calculation cells were prepared using a cell creation software (ANSYS Meshing Version 17.2, ANSYS Inc.). The simple respiratory model was meshed entirely tetrahedral control volume, and the cell size was 40–4000 µm. The cell number was approximately 220000. The model geometry, as shown in Fig. 1, was divided into three zones. Zone-1 and Zone-3 include the trachea and the end of the simple respiratory model geometry, respectively, and the remaining part corresponds to Zone-2. The diameter and branch number of Zone-3 corresponded to generation 5–6 in Weibel airway model. The ratio of the number of particles reaching each zone to the total number of particles was calculated, and the particle reachability into the simple respiratory model was evaluated by counting the number of particles reaching Zone-3.
Calculation ConditionThe DEM–CFD calculation was performed with a DEM simulation software (EDEM 2018, DEM Solutions Co., Ltd.) and a thermal fluid analysis software (ANSYS Fluent Ver. 17.2, ANSYS, Inc.).
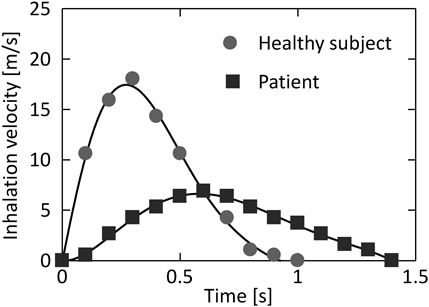
The fluid calculation was assumed the air. As the boundary condition of the fluid calculation, the inlet pressure was set to 101.325 kPa and the outflow rate was changed over time at the outlet. Two inhalation patterns for a healthy subject and a patient (Fig. 2) according to a previous study49) was used as a boundary condition of outlet flow velocities. Both inhalation patterns had the flow velocity changing over time, and the inhalation pattern of a healthy subject showed the stronger inhalation velocity than that of a patient. Since the maximum Re number under the simulation condition in this study reached to approximately 3600, the standard k-ω model was applied as a turbulence model. For the DEM simulations, the physical properties of the model geometry and particles referred another previous study.50) The surface energy, which is a parameter of adhesion force based on JKR theory, was set to 0.5 J/m2. The particles, with a total weight of 3.8 × 10⁻⁶ g, were introduced from the inlet of the simple respiratory model. A two-way coupling method for the DEM–CFD calculation was used because of the usage of the inhalation patterns in which the flow velocity changed over time. A SIMPLE method51) was used for the CFD simulation. The time steps for CFD and DEM calculations were 1 × 10⁻⁴ s and 5 × 10⁻⁸ s, respectively. Iterative calculation of CFD was terminated using the criterion that the error of the equation of continuity was less than 1 × 10⁻³ compared with that at the start of calculation. The typical simulation conditions are summarized in Table 1.
Table 1. Calculation Conditions of DEM–CFD Simulations
| Fluid pressure | 101.325 | kPa |
| Fluid density | 1.225 | kg/m3 |
| Fluid viscosity | 1.789 × 10⁻⁵ | Pa·s |
| Particle size | 5–20 | µm |
| Particle density | 330–1520 | kg/m3 |
| Number of particle | 1250–80000 | — |
| Coefficient of restitution | (particle-to-particle) | 0.5 | — |
| (particle-to-lung) | 0.9 | — |
| Coefficient of static friction | (particle-to-particle) | 0.5 | — |
| (particle-to-lung) | 0.7 | — |
| Coefficient of rolling friction | (particle-to-particle) | 0.01 | — |
| (particle-to-lung) | 0.7 | — |
| Poisson’s ratio of particle | 0.3 | — |
| Poisson’s ratio of lung | 0.3 | — |
| Young’s modulus of particle | 1 × 10⁸ | Pa |
| Shear modulus of lung | 5 × 10⁵ | Pa |
| Surface energy | 0.5 | J/m2 |
In the present study, the effects of particle sizes (5–20 µm), particle densities (330–1520 kg/m3), and particle shapes on the particle motion in the respiratory system were investigated. Regarding the particle shape, the DEM–CFD calculations were conducted using spherical (different particle size with the same aerodynamic diameter) and rod-like particles (aspect ratio = 2, 4). The rod-like particle was constructed by arranging several particles with overlapping manner (Fig. 3). When investigating the effect of particle shapes, the aerodynamic diameter was set to 8.5 µm.
Results and Discussion
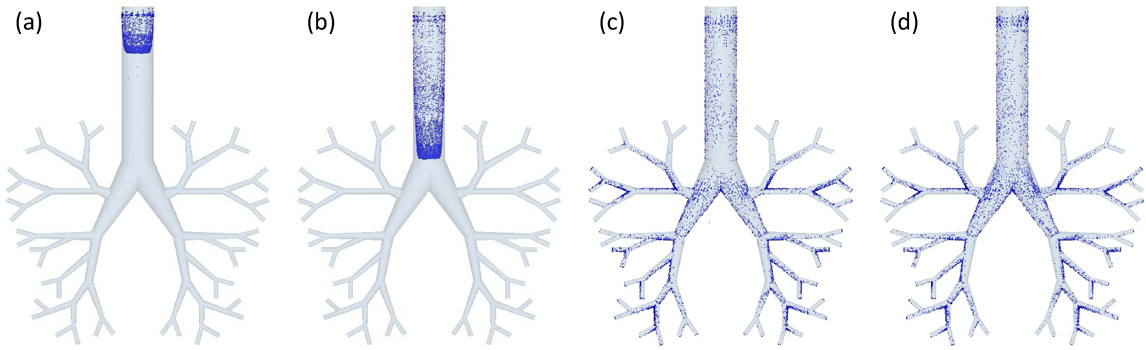
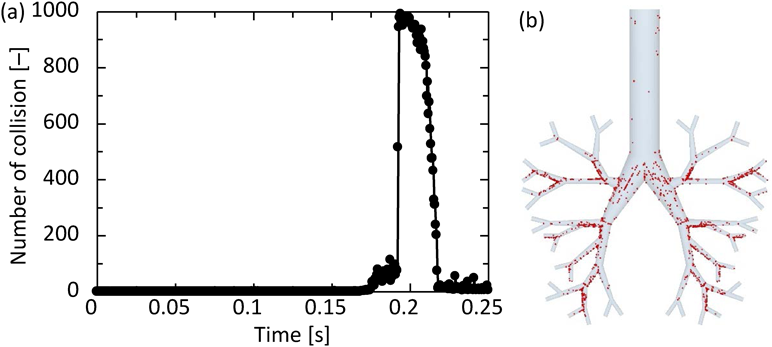
The Effect of Particle–Wall Interaction on the Particle Motion and Deposition Behaviors in the Simple Respiratory ModelUsing the DEM–CFD model, the particle motion in the simple respiratory model of the patient flow pattern under the particle condition of 10 µm and 720 kg/m3 was calculated. Figure 4 shows the temporal change in the particle arrival position. The particles were magnified 50 times. The particles introduced from the inlet moved through the simple respiratory model and reached its depth after approximately 0.25 s (Fig. 4d). Figure 5a shows the number of collisions between particles and the wall. The number of collisions reached to a peak at 0.2 s, and it decreased to approximately zero after 0.25 s. Since the number of particles introduced under the typical conditions was 10000, it was found that about 10% of the particles collided at around 0.2 s. In addition, from the collision position of particles (Fig. 5b), it can be seen that the larger number of particles collided in Zone 2 than in Zone 1 and 3. At 0.2 s, the Stokes numbers were about 0.027, 0.089, and 0.19 for Zone 1–3, respectively. The smaller Stokes number causes the more collision of particles on the lung wall because of the fast fluid flow to the simple respiratory model. On the other hand, the fluid flow was not directed toward the wall in Zone 1, so that it is thought that the number of colliding particles is small. After several collisions at bifurcations in the simple respiratory model, the particles adhered to the wall and never moved. The collision and deposition behavior of particles could be expressed in the calculation considering the adhesion force based on JKR theory. Although it will be necessary to experimentally determine the appropriate adhesion force between the particle and lung surface, the adhesion force based on JKR theory was appropriate as the first step of our purpose. When the particles were deposited in Zone-3, the Stokes number in the Zone-3 was approximately 0.2. The arrival ratio to each zone, defined in Fig. 1, was found to be 26.0, 56.8, and 17.2% for Zones-1–3, respectively. The Zone-3 in the simple respiratory model was almost corresponding to the G6 in Weibel airway model and the ending region in realistic model. Although it was difficult to compare with the literature accurately due to the slightly different calculation conditions, the arrival ratio into the Zone-3, 17.2%, was a bit larger than the reported data.28,31,32,40) This is because the adhesion force based on the JKR theory can be expressed the rebound and deposition depending on the contact radius between the particle and simple respiratory model, although all previous reported paper assumed that all particles contacted on the wall were trapped. This result suggests that the particle–wall interaction affects the particle deposition behavior and it is the important factor for the analysis of the particle deposition behavior in the human respiratory system.
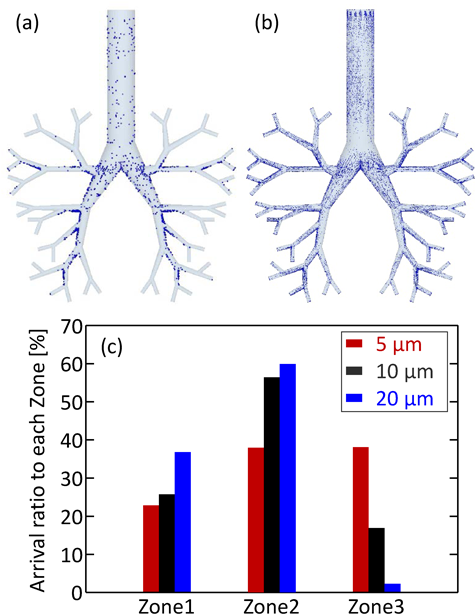
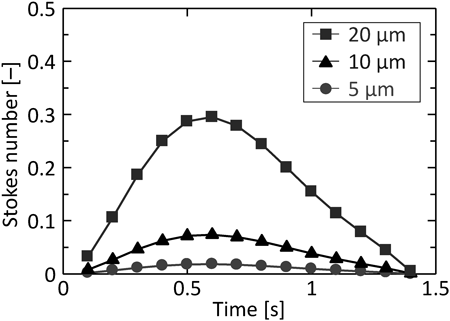
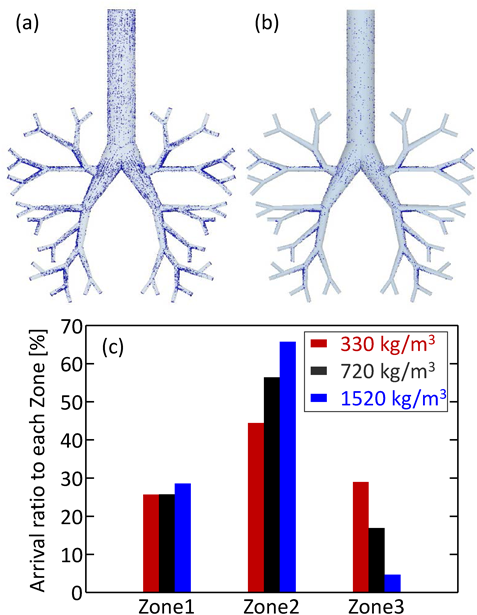
Effect of Particle Size and Density on the Particle ReachabilityThe effect of particle size on the arrival ratio to the depth of the simple respiratory model was investigated; Figs. 6a, b show the arrival position calculated with particle sizes of 5 and 10 µm. As the particle size increased, the arrival amount to the depth of the simple respiratory model decreased, although the deposition amount at the bottom of the simple respiratory model increased. As compared to the arrival ratio to each zone (Fig. 6c), the particles of 20 µm diameter showed high arrival ratio to Zone-1 and Zone-2, while those of 5 µm diameter showed the highest arrival ratio to Zone-3. In addition, the arrival ratio to Zone-3 increased with a decrease in particle size. This is because the motion of smaller particles almost agreed with the fluid streamline, while the larger particles moved in the direction of gravity regardless of the fluid flow. This explanation can also be confirmed through the calculation of Stokes number in Zone-1 for each particle size. Figure 7 shows the Stokes number of particles in Zone-1 over time. The representative length is the diameter of Zone-1 and the representative velocity is the average flow velocity of a certain face in Zone-1. The Stokes number increased with the particle size, indicating that the trajectory of smaller particles easily tends to match the streamline of the fluid. The particles with different densities also showed similar motion, as in the case of change in particle size. Figure 8 shows the particle arrival position with densities of 330 and 1520 kg/m3, and the arrival ratio to each zone for these densities. Larger density particles reached less to the depth of the simple respiratory model and deposited more at the bottom (Figs. 8a, b). Moreover, the arrival ratio to Zone-3 increased with a decrease in the particle density (Fig. 8c). These results indicated that the particles with smaller size and density, that is, a smaller aerodynamic diameter indicate higher arrival ratio to the depth of the simple respiratory model. This trend was almost similar to the previous CFD–DPM investigation without the consideration of particle–wall interaction, despite considering the particle–wall interaction in this study. In other words, it was revealed that the particle deposition behavior in the respiratory system strongly depended on the particle aerodynamic diameter even in the case of particle collision against the wall of respiratory system.
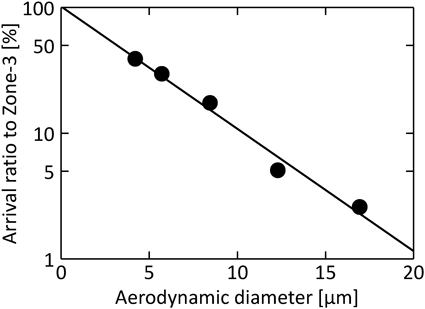
The aerodynamic diameters of different particle sizes and densities were calculated. Figure 9 indicates the arrival ratio to Zone-3, F3, as a function of aerodynamic diameter, Dae. The linear relation between F3 and Dae was confirmed. F3 can be represented by the empirical equation (Eq. (12)), and becomes exponentially higher as Dae decreases.
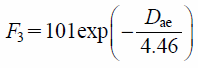 | (23) |
Using Eq. (12), the aerodynamic diameter required to satisfy the desired arrival ratio to the depth of the human respiratory system can be predicted. In many cases reported so far, the particle deposition frequency was summarized by Stokes number. Because of the non-constant inhalation speed in this study, it was difficult to summarize the particle arrival ratio to Zone-3 by the Stokes number. However, since the actual inhalation velocity is not a constant, the summary using Eq. (14) seems to be sufficient and appropriate. In addition, the slope of this line (4.46) is the characteristic particle size in the system of the present study, and depends on the individual respiratory system such as the inhalation volume, the structure of the human respiratory systems, the adhesion between particles, and the surface of the human respiratory system.
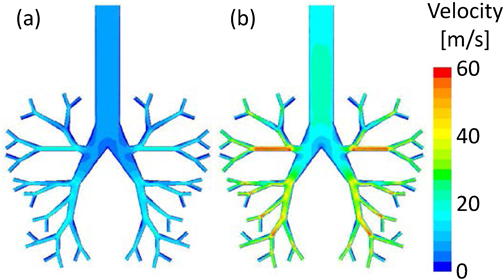
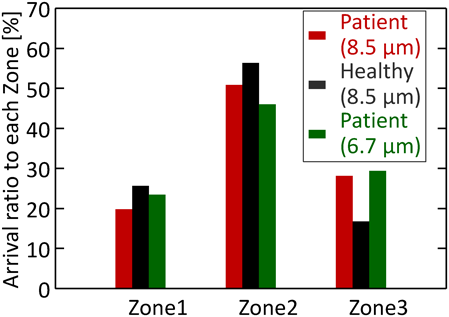
Effect of Inhalation Pattern on the Particle ReachabilityThe inhalation patterns of the healthy subject and patient were used for the simulations. This calculation was also aimed to confirm the utility of the Eq. (14). At first, only the CFD calculation with two different inhalation patterns was conducted. Figure 10 shows the velocity contour plots at the time of showing the maximum flow velocity in the simple respiratory model under various inhalation patterns of the patient (0.6 s, Fig. 10a) and the healthy subject (0.3 s, Fig. 10b). The time showing the maximum flow rate velocity for the patient was longer than that for the healthy subject, and the maximum flow rate velocity for the patient was smaller than that for the healthy subject. This is in accordance with the trend of inhalation patterns of the patient and healthy subject shown in Fig. 2. Thereafter, the particle motion behavior in the simple respiratory model of the healthy subject’s flow pattern under the particle condition of 10 µm and 720 kg/m3 (aerodynamic diameter is 8.5 µm) was calculated. Figure 11 compares the arrival ratio to each zone for the inhalation pattern of the healthy subject (red bar) with that for the inhalation pattern of the patient (blue bar). The arrival ratio to Zone-3 for the healthy subject was about twice that for the patient. This quantitatively indicates that patients have lower particle reachability into the human respiratory system than the healthy subject, because the healthy subject shows larger inhalation volume and faster inhalation speed. Here, Eq. (14) indicated that it was necessary to change the aerodynamic diameter of the particles from 8.5 to 5.1 µm to achieve the same arrival ratio to Zone-3 for patients as that for healthy subjects. Accordingly. calculated the arrival ratio to Zone-3 of the particles with an aerodynamic diameter of 5.1 µm for the patient’s inhalation pattern was calculated (green bar in Fig. 11). The arrival ratio to Zone-3 for the patient almost agreed with that for the healthy subject. This result demonstrated that it is possible to estimate the aerodynamic diameter of particles from the required arrival ratio to Zone-3. The exponential function of the aerodynamic diameter (Eq. (14)) would lead to the guide of particle design.
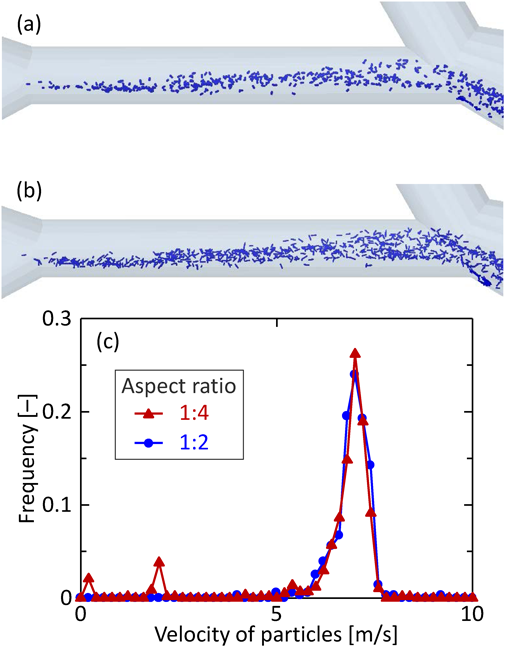
Effect of Particle Shape on the Particle ReachabilityTo investigate the effect of particle shape, the particle motion in the simple respiratory model of the patient flow pattern with spherical and rod-like particles was simulated. The solid (particle size is 10 µm and particle density is 720 kg/m3) and hollow particles (particle size is 15 µm and particle density is 330 kg/m3), whose aerodynamic diameters are almost the same, were used. Here, the drag force from the fluid to particles was calculated based on Eqs. (9–11). In terms of rod-like particles, the particles with different aspect ratios (aspect ratio = 2, 4) having the same aerodynamic diameters were prepared. Figure 12 shows the arrival ratio to each zone of the particles with different shapes. Comparing the solid particles with the hollow particles, the arrival ratios to Zone-3 are the same, although the particle sizes are different. This supports the results that the arrival ratio to Zone-3 strongly depends on the aerodynamic diameter, as described in “The Effect of Particle–Wall Interaction on the Particle Motion and Deposition Behaviors in the Simple Respiratory Model.” On the other hand, when focusing on rod-like particles, the arrival ratio to Zone-3 slightly increased with the aspect ratio. To investigate this reason, the orientation of the rod-like particles in Zone-2 was analyzed. Figures 13a and b show a snapshot of the rod-like particles in Zone-2 at 0.1745 s. The average angle of the rod-like particles for the direction of movement to the deep region was found to be 62.0° and 61.8° for the rod-like particles with an aspect ratio of 1 : 2 and 1 : 4, respectively. In addition, the particle velocity distributions of the snapshot (Fig. 13c) indicate that the velocity of the particles with a larger aspect ratio was slightly faster. These results suggest that the horizontal motion for the direction to the deep region with the high velocity was a factor for obtaining higher arrival ratio to Zone-3 for rod-like particles with a larger aspect ratio. Given that the aspect ratio of the actual rod-shaped DPI is more than 50, computer simulations predict that rod-like particles show much larger particle reachability into the human respiratory system than spherical particles. Incidentally, CFD–DPM model is difficult to analyze the effect of particle shape on the particle deposition behavior, which is only possible with DEM–CFD calculation.
Conclusion
In the present study, the particle motion behavior in a simple respiratory model was simulated using the DEM–CFD model and the effect of the inhalation patterns and particle properties on the arrival ratio to the deep region was investigated. Our investigation yielded the following conclusions:
1. The particles with a smaller size and lower density showed higher particle reachability into the human respiratory system; namely, the arrival ratio to Zone-3 strongly depended on the aerodynamic diameter. In addition, the arrival ratio to Zone-3 increased for a smaller aerodynamic diameter, and can be represented as the exponential function of the aerodynamic diameter.
2. The inhalation patterns of the healthy subject resulted in twice as high arrival ratio to Zone-3, compared to that of the patient. DEM–CFD simulation demonstrated that the exponential relation between the arrival ratio to Zone-3 and the aerodynamic diameter could estimate the aerodynamic diameter of particles from the required arrival ratio to Zone-3.
3. The rod-like particles with larger aspect ratio indicated a slightly higher particle reachability into the human respiratory system because of the particle motion in horizontal direction to the deep region with a high velocity.
In this paper, the DEM–CFD simulation quantitatively demonstrated that the particle–wall interaction and particle shape were important factor of the deposition behavior in the human respiratory system. These results were obtained through the investigation using DEM.
Acknowledgments
This work was financially supported by Hosokawa Powder Technology Foundation, and partially supported in part by Ansys Japan, Cybernet Systems, and DEM Solutions Japan.
Conflict of Interest
The authors declare no conflict of interest.
References
- 1) Dalby R., Suman J., Adv. Drug Deliv. Rev., 55, 779–791 (2003).
- 2) Sanders M., Prim. Care Respir. J., 16, 71–81 (2007).
- 3) Owens D. R., Zinman B., Bolli G., Diabet. Med., 20, 886–898 (2003).
- 4) Le Brun P. P. H., de Boer A. H., Frijlink H. W., Heijerman H. G. M., Pharm. World Sci., 22, 75–81 (2000).
- 5) Prime D., Atkins P. J., Slater A., Sumby B., Adv. Drug Deliv. Rev., 26, 51–58 (1997).
- 6) Islam N., Gladki E., Int. J. Pharm., 360, 1–11 (2008).
- 7) Daniher D. I., Zhu J., Particuology, 6, 225–238 (2008).
- 8) Laube B. L., Janssens H. M., de Jongh F. H., Devadason S. G., Dhand R., Diot P., Everard M. L., Horvath I., Navalesi P., Voshaar T., Chrystyn H., Eur. Respir. J., 37, 1308–1417 (2011).
- 9) Geller D. E., Weers J., Heuerding S., J. Aerosol Med. Pulm. Drug Deliv., 24, 175–182 (2011).
- 10) Staniforth J. N., Aerosol Sci. Technol., 22, 346–353 (1995).
- 11) Braun M. A., Oschmann R., Schmidt P. C., Int. J. Pharm., 135, 53–62 (1996).
- 12) Shekunov B. Y., Chattopadhyay P., Tong H. H., Chow A. H., Pharm. Res., 24, 203–227 (2007).
- 13) Su W. C., Cheng Y. S., Inhal. Toxicol., 18, 749–760 (2006).
- 14) Su W.-C., Cheng Y. S., J. Aerosol Sci., 37, 1429–1441 (2006).
- 15) Su W.-C., Cheng Y. S., Aerosol Sci. Technol., 39, 888–901 (2005).
- 16) Zhou Y., Su W. C., Cheng Y. S., Inhal. Toxicol., 20, 1191–1198 (2008).
- 17) Tee S. K., Marriott C., Zeng X. M., Martin G. P., Int. J. Pharm., 208, 111–123 (2000).
- 18) Larhrib H., Martin G. P., Marriott C., Prime D., Int. J. Pharm., 257, 283–296 (2003).
- 19) Kaialy W., Alhalaweh A., Velaga S. P., Nokhodchi A., Powder Technol., 227, 74–85 (2012).
- 20) Littringer E. M., Mescher A., Schroettner H., Achelis L., Walzel P., Urbanetz N. A., Eur. J. Pharm. Biopharm., 82, 194–204 (2012).
- 21) Kleinstreuer C., Zhang Z., Donohue J. F., Annu. Rev. Biomed. Eng., 10, 195–220 (2008).
- 22) Kleinstreuer C., Zhang Z., Annu. Rev. Fluid Mech., 42, 301–334 (2010).
- 23) Davoudi M., Colt H. G., Adv. Health Sci. Educ. Theory Pract., 13, 247–248 (2008).
- 24) Crowe C. T., Sharma M. P., Stock D. E., J. Fluids Eng., 99, 325–332 (1977).
- 25) Patankar N. A., Joseph D. D., Int. J. Multiph. Flow, 27, 1659–1684 (2001).
- 26) Weibel E. R., “Morphometry of the Human Lung,” Academic Press, New York, 1963.
- 27) Comer J. K., Kleinstreuer C., Kim C. S., J. Fluid Mech., 435, 55–80 (2001).
- 28) Kleinstreuer C., Zhang Z., Kim C. S., J. Aerosol Sci., 38, 1047–1061 (2007).
- 29) Kleinstreuer C., Zhang Z., J. Biomech. Eng., 131, 021007 (2009).
- 30) Rahimi-Gorji M., Pourmehran O., Gorji-Bandpy M., Gorji T. B., J. Mol. Liq., 209, 121–133 (2015).
- 31) Rahimi-Gorji M., Gorji T. B., Gorji-Bandpy M., Comput. Biol. Med., 74, 1–17 (2016).
- 32) Kadota K., Nishimura T., Nakatsuka Y., Kubo K., Tozuka Y., J. Pharm. Innov., 12, 249–259 (2017).
- 33) Kadota K., Imanaka A., Shimazaki M., Takemiya T., Kubo K., Uchiyama H., Tozuka Y. J. Taiwan. Inst. Chem. E, 90, 44–50 (2018).
- 34) Oakes J. M., Shadden S. C., Grandmont C., Vignon-Clementel I. E., Int. J. Numer. Meth. Bio., 33, 1 (2017).
- 35) Ennis B. J., Tardos G., Pfeffer R., Powder Technol., 65, 257–272 (1991).
- 36) Park M. S., Chung J. W., Kim Y. K., Chung S. C., Kho H. S., Oral Dis., 13, 181–186 (2007).
- 37) Liu L. X., Litster J. D., Iveson S. M., Ennis B. J., AlChE J., 46, 529–539 (2000).
- 38) Tong Z., Yu A., Chan H. K., Yang R., Curr. Pharm. Des., 21, 3966–3973 (2015).
- 39) Chen X., Feng Y., Zhong W., Sun B., Tao F., Powder Technol., 323, 284–293 (2018).
- 40) Feng Y., Kleinstreuer C., J. Aerosol Sci., 71, 1–15 (2014).
- 41) Tsuji Y., Kawaguchi T., Tanaka T., Powder Technol., 77, 79–87 (1993).
- 42) Shiller L., Naumann A., Zeitschrift des Vereins Deutscher Ingenieure, 77, 318–320 (1935).
- 43) Ganser G. H., Powder Technol., 77, 143–152 (1993).
- 44) Johnson K. L., Kendall K., Roberts A. D., Proc.- Royal Soc., Math. Phys. Eng. Sci., 324, 301–313 (1971).
- 45) Bortolotti C. T., Santos K. G., Francisquetti M. C. C., Duarte C. R., Barrozo M. A. S., The Canadian Journal of Chemical Engineering, 91, 1871–1880 (2013).
- 46) Behjani M. A., Rahmanian N., Adv. Powder Technol., 28, 2456–2464 (2017).
- 47) Umer M., Siraj M. S., Powder Technol., 328, 309–317 (2018).
- 48) Xia R., Li B., Wang X., Li T., Yang Z., Measurement, 142, 84–95 (2019).
- 49) Okuda T., Furudate T., Okamoto H., Drug Deliv. Syst., 24, 499–506 (2009).
- 50) Chen X., Zhong W., Zhou X., Jin B., Sun B., Powder Technol., 228, 309–318 (2012).
- 51) Patankar S. V., Spalding D. B., Int. J. Heat Mass Transfer, 15, 1787–1806 (1972).