Abstract
Quantitative structure–activity relationship (QSAR) techniques, especially those that possess three-dimensional attributes, such as the comparative molecular field analysis (CoMFA), are frequently used in modern-day drug design and other related research domains. However, the requirement for accurate alignment of compounds in CoMFA increases the difficulties encountered in its use. This has led to the development of several techniques—such as VolSurf, Grid-independent descriptors (GRIND), and Anchor-GRIND—which do not require such an alignment. We propose a technique to construct the prediction model that uses molecular interaction field grid potentials as inputs to convolutional neural network. The proposed model has been found to demonstrate higher accuracy compared to the conventional descriptor-based QSAR models as well as Anchor-GRIND techniques. In addition, the method is target independent, and is capable of providing useful information regarding the importance of individual atoms constituting the compounds contained in the chemical dataset used in the proposed analysis. In view of these advantages, the proposed technique is expected to find wide applications in future drug-design operations.
Introduction
Accurate prediction of biological and chemical properties, such as physiological activity, toxicity, and so on, through use of the chemical structure of compounds are expected to curb high costs of unnecessary biological and physical property evaluations. Quantitative structure–activity relationship (QSAR)-based approaches serve to accurately predict physiological activities. Modern-day QSAR techniques may be classified into two categories—descriptor-based QSAR and three-dimensional QSAR (3D-QSAR). In conventional descriptor-based QSAR methods, a number of descriptors representing the physical and chemical characteristics, such as molecular weight, log P values, and number of hydrogen bond donors or acceptors, are first calculated from the structure of compounds contained in the dataset. Subsequently, a quantitative model is created by using these descriptors as features and effects, such as physiological activity, toxicity, and so on, as response values. Despite the fact that this method is simple, effective, and widely accepted for use, it must be remembered that it suffers an inherent limitation of being dependent on the explanatory capabilities of descriptors calculated in the first step. For example, models created using two-dimensional (2D) descriptors are difficult to recognize differences in response variables arisen from differences in molecular chirality. This occurs on account of molecular chirality, which is not accounted for by most 2D descriptors. Also, the descriptors are merely specific properties of the compounds. As such, they may not be able to cover all factors needed to explain the response values. This explains the low explanatory capability of descriptors. In contrast, 3D-QSAR models are constructed using potential energy values calculated by force fields from the 3D structure of compounds. Such models are, therefore, able to avoid problems concerning the explanatory capability of descriptors, which are encountered by descriptor-based QSAR methods.
The comparative molecular field analysis (CoMFA)1) technique employs a typical 3D-QSAR model that adheres to the following sequence of operation.
-
1.
All compounds in the dataset are aligned using coordinates of atoms.
-
2.
A grid is generated around each compound.
-
3.
Virtual atoms, called probes, are placed at each grid point, and the net interaction energy between the probe and compound (termed as the molecular interaction field (MIF)) is calculated.
-
4.
Using partial least square (PLS) regression or other suitable regression schemes, a prediction model is created from the calculated MIF values calculated for each compound constituting the dataset.
By allocating various probes that possess different van der Waals’ parameters and partial atomic charge at each grid point, useful information concerning drug design—such as identification of a site where an increase or decrease in the value of response variables has been observed depending on the presence of a hydrogen-bond donor, acceptor, or hydrophobic group—may be obtained. CoMFA, therefore, is considered and employed as an important technique in medical and drug-related research applications. The disadvantage in its use, however, is the necessity of strictly superimposing compounds for the purpose of alignment, as mentioned in the first step of the above sequential procedure. This alignment, in turn, governs the prediction accuracy of the CoMFA technique. In most cases, such an alignment requires a series of compounds possessing similar, if not identical, skeletons (e.g. compounds having a steroid skeleton). Moreover, in order to achieve accurate alignment, an advanced chemical understanding is required for determining equivalent atoms amongst various chemical compounds contained in the dataset. Manual manipulation is also required during the training and prediction steps. To overcome this shortcoming of the CoMFA technique and reduce, if not eliminate, the need for manual manipulation, alternate QSAR methods, such as VolSurf,2) Grid-independent descriptors (GRIND),3) and Anchor-GRIND,4) have been proposed. However, these methods generate Grid-independent descriptors from MIFs, thereby making them susceptible to the limitations of descriptor-based QSAR techniques. Recently, the deep or multilayered neural network has been reported to demonstrate state-of-the-art performance in the fields of image5) and speech recognition,6) translation,7) and so on, and has also been underlined as a machine-learning technique. For image-recognition applications, the convolutional neural network (CNN) is mainly employed and has been a topic of active research.8–10) CNN falls within the deep-neural-network spectrum and comprises a layer that performs the convolution operation. This study reports a technique to construct the prediction model that uses MIF grid potentials as inputs to CNN. The proposed technique is capable of constructing models without the need for human intervention, and demonstrates higher prediction accuracy compared to previously reported MIF-based techniques and descriptor-based models. Moreover, the proposed technique demonstrates comprehension of the important aspects of activity contributed by each atom within compounds belonging to a particular dataset, thereby indicating its potential for wide application in drug-design operations.
Experimental
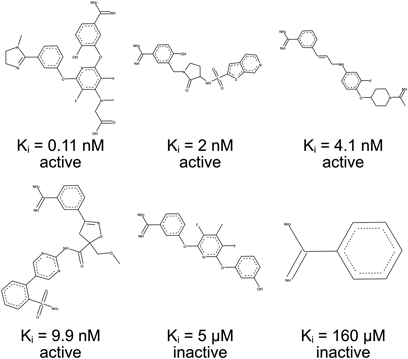
DatasetA dataset comprising a series of published inhibitors of Factor Xa of the benzamidine family,4) reported by Fontaine et al., was used for analysis in this study. This series of inhibitors contains 435 compounds with their respective inhibitory activities varying between 0.005 nM to 410 µM in inhibitory constant (Ki). The separation of active and inactive compounds according to the magnitude of inhibitory constant values was reported,4) and here we follow the results. Thus, there are 156 inactive (Ki > 1 µM) and 279 active (Ki < 10 nM) compounds in the dataset. Six examples are shown in Fig. 1. To construct prediction model, the dataset was randomly split into training (290 compounds) and test sets (145 compounds), which is also as the same as previously reported.4) Thus, we can compare directly the results of this study and the previous study. Numbers of active and inactive compounds in training and test data sets are summarized in Table 1. In their study,4) Fontaine et al. reported the Anchor-GRIND model demonstrating a prediction accuracy of 88%.
Table 1. Numbers of Active and Inactive Compounds in Training and Test Data Sets
| Active | Inactive | Total |
|---|
| Training | 191 | 99 | 290 |
| Test | 88 | 57 | 145 |
| Total | 279 | 156 | 435 |
The structure of each compound in the dataset was imported in the SMILES format. It is generally difficult to determine whether a compound carries a charge or not on account of the inability to accurately examine experimental conditions and surroundings in which individual compounds interact. In such cases, it is recommended to neutralize these compounds.11) In line with this argument, all compounds contained in the dataset employed in this study were neutralized as per recommendations. Subsequently, hydrogen atoms were added, and the 3D structure was embedded with 100 conformers set as the upper limit. Structural optimization by the Merck molecular force field (MMFF 94)12) was then performed for each structure using RDKit-2017_03_3.13) Lastly, a secondary structural optimization calculation was performed for all conformers by employing the PM7 method14) through use of the MOPAC 2016 software package.15) Amongst the conformers for each compound, the structure demonstrating the most stable energy in the PM7 analysis was adopted for further analysis.
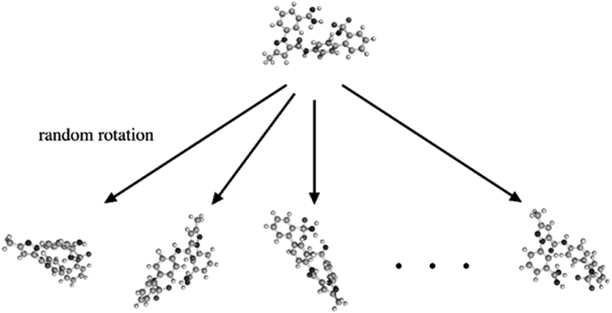
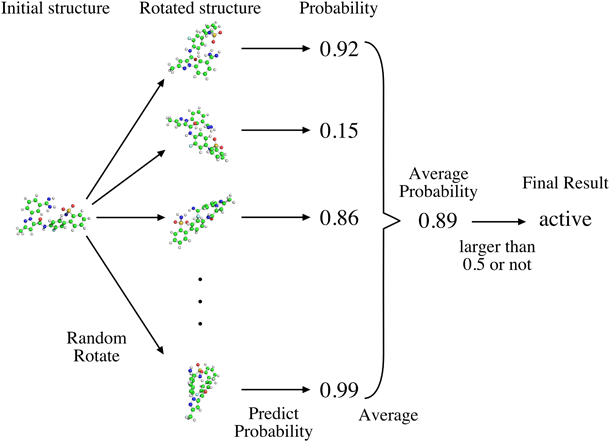
Data AugmentationIn the learning phase of deep neural networks, data augmentation, which increases data for the purpose of preventing over fitting, is often performed. Data rotation, clipping, translation, lateral inversion, scaling, etc. are well-known techniques of data augmentation. Unlike 2D images, some of these operations may cause a change in MIF attributes. For example, lateral inversion brings about a change in the enantiomer while scaling alters atomic properties, such as van der Waals’ radii. In this study, in order to avoid such changes in the shape of individual molecules, data rotation was applied exclusively. Each structure of the dataset was multiplied by a random rotation matrix M (Eq. 1). In this way, 100 such rotated structures were generated for each compound (Fig. 2) resulting in 29000, and 14500 structures, respectively, in the training and test datasets.
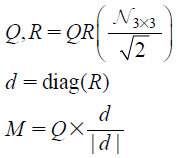 | (1) |
where QR(x) implies QR decomposition of matrix x; Nr × c is an r × c matrix of random numbers based on the standard normal distribution, and diag(x) represents diagonal elements of matrix x.
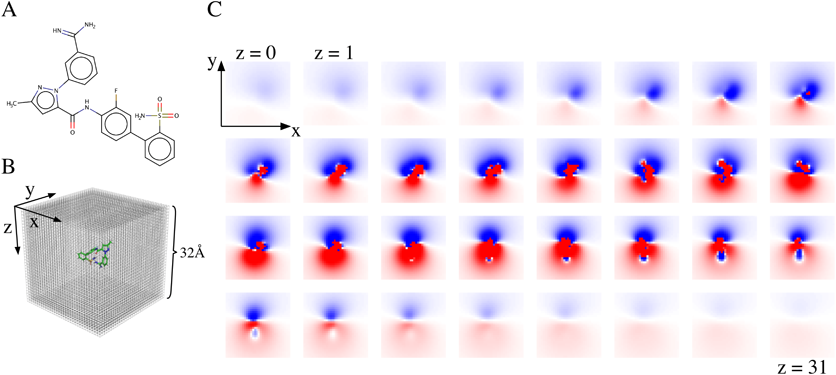
Grid GenerationThe grid used in the analysis was made large enough to contain all compounds comprising the dataset. In order to determine the grid size, principal component analysis (PCA) was performed on each structure in the training dataset. Lengths of compounds in the direction of the first principal component were obtained and that of the largest compound was determined to be 17 Å. The size of one voxel was set to 1 × 1 × 1 Å3, and one side of the grid was set to measure 32 Å in length, which was obviously larger than 17 Å. The center of mass of each compound was superposed on the center of the grid. To calculate grid potential, the van der Waals’ term (Evdwij) (Eq. 2) and electrostatic term (EQij) (Eq. 3) of MMFF 94, which incorporates 94 types of atoms, were employed. Terms, εij and R*ij, in Evdwij were calculated from van der Waals’ parameters for atom types i and j. Also, partial atomic charges (qi and qj in EQij) are calculated from the atom and connected bonds. In this study, oxygen atoms in water molecules—with an atom type identified as 70 and possessing a partial atomic charge of −0.86—were used as probing atoms. Equations 2 and 3 below give relationships to calculate the grid potentials.
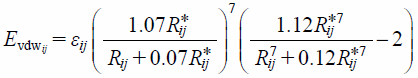 | (2) |
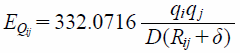 | (3) |
Grid potentials calculated in the above step cannot directly be used as inputs to CNN because the computational grid-potential domain covers the entire range from −∞ to ∞. Grid-potential scaling was, therefore, performed prior to initiation of the learning exercise. N-clipping (Eq. 4) or hyperbolic tangent (tanh) (Eq. 5) represent the initial scaling methods adopted in this study. Subsequently, an additional scaling (Eq. 6) was performed using the mean and standard deviation of the entire training set to adjust the average to 0 and variance to 1.
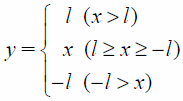 | (4) |
 | (5) |
 | (6) |
As an illustration of this scaling, potential energies of the grid generated for the compound depicted in Fig. 3A and included in the training dataset are shown in Fig. 3C.
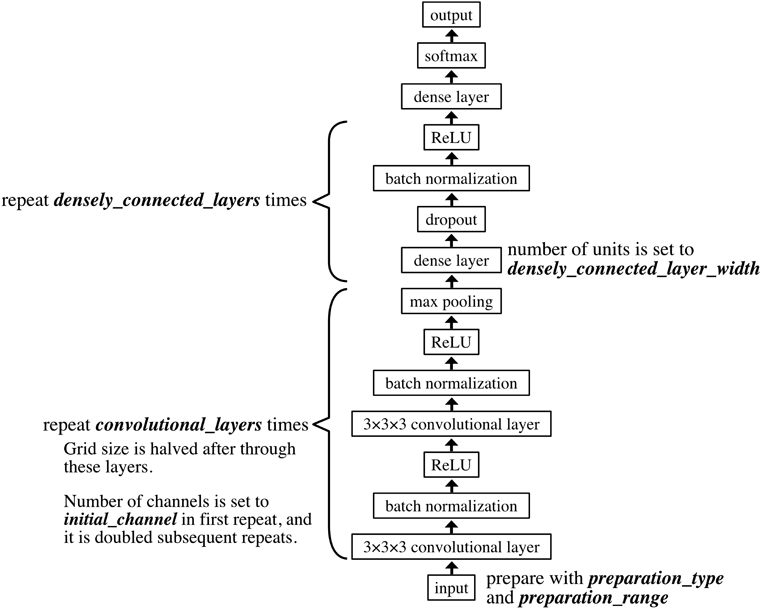
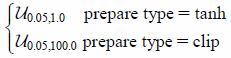
LearningThe network architecture employed in this study is depicted in Fig. 4, and was constructed with reference to the Visual Geometry Group (VGG) model10) using mxnet-0.10.0.16) Weight initialization was performed in a manner similar to the one previously reported by Glorot and Bengio17) Batch size and epoch were set to 100 and 500, respectively. The softmax cross-entropy error function was employed to account for losses along with use of the Adam optimization algorithm.18) Other hyper parameters were determined using the method described in the next section. Tuned hyper parameters, in Fig. 4, are indicated in italics. The input MIF was first prepared using the ‘preparation type’ and ‘preparation range’ hyper parameters. Convolutional layers were then added a number of times equal to the value of the layers parameter. The density layers are then repeated a number of times equal to the value of the ‘densely connected layers’ parameter. Finally, the softmax cross-entropy loss function is applied.
Hyper-Parameter TuningIn order to obtain optimum values for hyper parameters, 29 compounds, corresponding to 10% of the training set, were randomly selected as a validation set and a random search operation was performed. Each hyper parameter listed in Table 2 was randomly chosen, and subsequent learning was performed on the training set. This procedure was performed for 100 different hyper-parameter patterns, and the parameter demonstrating highest accuracy was selected for the validation test.
Prediction and Model EvaluationOne prediction was obtained from each of the hundred rotated structures corresponding to each compound, and the final prediction result was derived on the basis of majority vote with reference to the 10-crop testing.9) Figure 5 depicts a schematic of this operation, which is hereinafter referred to as 100-rotate testing (100-RT). The prediction accuracy of the model was evaluated by the test set.
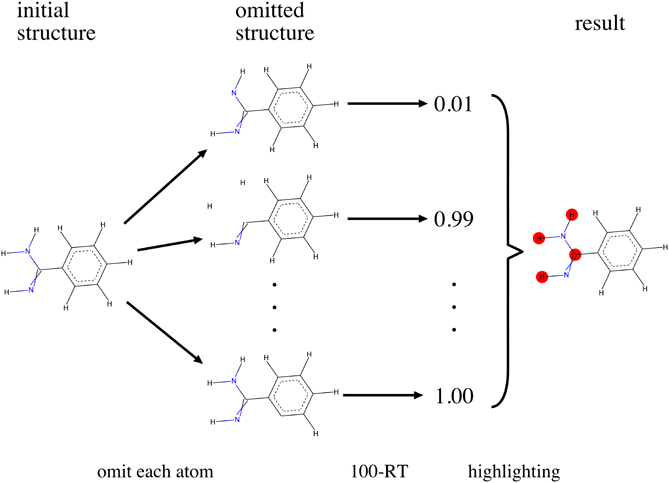
Inspection of Important AtomsAn analysis of the importance of each atom in activity prediction of the proposed model is expected to have an influence on drug design. Since most classical force fields, including the MMFF 94, formulate the total energy by summing up the energies of all atoms, importance of each individual atom could be determined by estimating the prediction probability of a compound when a certain atom is not present. In the proposed study, each atom constituting the compound to be inspected was omitted one at a time, and the corresponding grid potential was calculated. The 100-RT operation was then performed for each omitted atom. The decline of the predictive probability between the initial and atom-omitted structures indicates the importance of the omitted atom. Finally, all the atoms demonstrating high importance were highlighted according to the calculated atomic importance. Figure 6 shows an illustration of the above process.
QSAR with 2D DescriptorsFor the purpose of comparison, random forest (RF)19) and logistic regression (LR)20) models using 2D descriptors exclusively were constructed to form a baseline case. The Mordred-0.6.0 package21) was used for descriptor calculation while the scikit-learn-0.19.022) package was used for model construction. Hyper parameters were once again determined through a random search of 100 points in the ranges listed in Table 3. For evaluating hyper parameters, validation accuracy determined using the 10-fold cross-validation (10-CV) technique was used.
Results and Discussion
The proposed method was developed to investigate the feasibility of CNN—to which MIF potential grids serve as inputs—as a useful 3D-QSAR tool in contemporary drug design and related medical research. To demonstrate the applicability of the proposed method, this section compares its prediction capability against that of conventional descriptor-based models employing 2D descriptors and the previously reported Anchor-GRIND model. Subsequently, the contribution of hyper parameters involved in CNN is discussed. Lastly, the usefulness of the proposed analysis procedure to highlight the importance of individual atoms of a compound in activity prediction is discussed.
Comparison with Other MethodsTable 4 lists hyper parameters of the proposed, RF, and LR models along with corresponding accuracies of their respective validation (hold out validation of the propped method and 10-CV technique for RF and LR methods) and test sets.
Table 4. Comparison of Result of the Learning Exercise Performed on the Proposed and Baseline 2D Models
| Model | Validation accuracy (%) | Test |
|---|
| Accuracy (%) | Balanced accuracy (%) | F1 score |
|---|
| Proposed | 96.4 | 91.7 | 91.0 | 0.933 |
| RF | 94.1 | 85.5 | 83.7 | 0.885 |
| LR | 94.5 | 90.3 | 89.6 | 0.921 |
As seen in Table 4, the proposed method demonstrates a test-set accuracy of 91.7%, which is higher compared to the Anchor-GRIND (88%) and baseline models employing 2D descriptors (85.5% for RF and 90.3% for LR). Balanced accuracy and F1 score of the proposed model are also higher than those of 2D descriptor models. By directly performing the prediction for all 14500 rotated structures in the test set without invoking the 100-RT operation, the accuracy was found to be 90.2%, thereby suggesting that the 100-RT operation serves to achieve an improvement of roughly 1.5 percentage points in prediction accuracy.
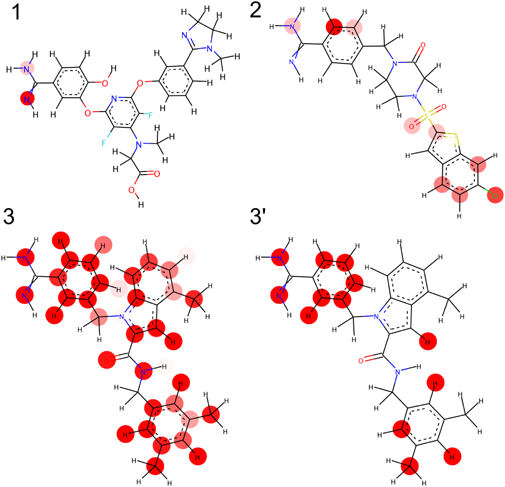
Explanation of the ModelExplanation of QSAR models is generally difficult. For the purpose of drug design, however, an explanation of the constructed model is necessary. As previously mentioned, the proposed model is capable of providing information regarding the importance of individual atoms in a compound by comparing prediction probability obtained via omission of individual atoms from the compound one-at-a-time. For the dataset considered in this study, three co-crystallographic structures of compounds with receptor Factor Xa were reported to the Protein Data Bank (PDB) (Table 5). All the three ligands are in active class. An illustration of the atomic importance of these compounds, as determined by the proposed model, is depicted in Fig. 7.
Table 5. Three Co-crystallographic Structures of Compounds with Receptor Factor Xa
| Ligand ID | PDB ID | Activity (FXa)/nM* |
|---|
| 1 | 1FJS | 0.11 |
| 2 | 1NFY | 1.3 |
| 3 | 1LQD | 9 |
* All the three ligands are in active class.
Each molecule is highlighted based on the significance of its constituent atoms, which is expressed by means of a color scale that varies from colorless to red with increase in significance. Since the activity of Ligand 3 is close to the active/inactive threshold and it is difficult to distinguish between active and inactive, most atoms in Ligand 3 are highlighted. Thus, the rescaled image (3′) is also shown.
The amidine substructure of benzimidazole in Ligands 1 and 3 was highlighted to be important but was not in Ligand 2 was not. To identify reason of this discrepancy, X-ray co-crystal structures of Ligands 1–3 (PDBID: 1FJS, 1NFY, and 1LQD) are superimposed and compared (Fig. 8). Ligands 1–3 are colored in red, green, and cyan, respectively. Residues demonstrating major interaction with compounds are also shown. Compared with Ligands 1 and 3, Ligand 2 is clearly showing different binding mode in the co-crystal structure. For Ligand 2, instead of benzamidine, chlorobenzene is positioned in the active site and one of nitrogen of benzamidine in Ligand 2 forms hydrogen bond with Glu97. In Fig. 7, chloro group in Ligand 2 is strongly highlighted and one of nitrogen of benzamidine is highlighted. The results consistent with X-ray crystal structures. The difference in activities of respective molecules was assumed to be attributed to the presence or absence of these atoms. The inspection of important atoms in low-activity compounds discussed in this paper is independent of the receptor-molecule structure. The proposed technique can, therefore, be expected to find applications in drug design procedures, especially for cases wherein the structure of target molecules is unknown.
Conclusion
This study proposes a 3D-QSAR technique that uses MIF grid potentials as input to CNN and reports an analysis to investigate its effectiveness in comparison to conventional descriptor-based 2D-QSAR methods. The proposed method does not require human manipulation, such as compound alignment or designation of anchor atoms required in the case of CoMFA and Anchor-GRIND, respectively. Furthermore, the proposed technique demonstrates higher prediction accuracies compared to previously reported 3D-QSAR techniques and models constructed using 2D descriptors. Since the model is constructed by exclusively using a force field that is well-tested for physical and chemical properties, it is expected that problems concerning explanatory capabilities of the model are much reduced in this method compared to conventional descriptor-based QSAR techniques. This is because the proposed technique does not involve use of descriptors that extract only specific properties, such as molecular weight, log P values, and the number of hydrogen-bond donor or acceptor. Additionally, this study proposes a method to analyze the constructed model. The proposed method of analysis not only helps to confirm which part of the structure contains compounds that may be adjudged as being active or inactive, based on the presence or absence of particular atomic species, but also provides information regarding the most important atoms responsible for binding to the receptor. The authors, therefore, believe that their proposed method could find wide acceptability in drug-design applications. However, this method includes several limitations. Firstly, this study is designed for constructing a model of a series of compounds with targets or co-crystal structures unknown. Although this method can be applied to a data set of co-crystal structures solved, in those cases, other approaches using crystal structure are recommended for effectiveness. Secondly, to simplify the procedure, in the current study atoms are used as an occluding unit in model interpretation, but the more descriptive result may be able to obtain using other occluding units such like functional groups. Lastly, all compounds in this dataset contain benzimidazole. Although most compounds in the dataset have a large non-benzimidazole moiety, strictly speaking, they are congeneric compounds. By increasing the varieties of skeletons in the dataset, a more robust model may be constructed. Resolution of these limitations may enhance the worthiness of this method.
Acknowledgments
This work was partially supported by the Hirose International Scholarship Foundation for fellowship to Yu-Shi Tian.
Conflict of Interest
The authors declare no conflict of interest.
References
- 1) Cramer R. D., Patterson D. E., Bunce J. D., J. Am. Chem. Soc., 110, 5959–5967 (1988).
- 2) Cruciani G., Pastor M., Guba W., Eur. J. Pharm. Sci., 11 (Suppl. 2), S29–S39 (2000).
- 3) Pastor M., Cruciani G., McLay I., Pickett S., Clementi S., J. Med. Chem., 43, 3233–3243 (2000).
- 4) Fontaine F., Pastor M., Zamora I., Sanz F., J. Med. Chem., 48, 2687–2694 (2005).
- 5) He K., Zhang X., Ren S., Sun J. ArXiv151203385 Cs (2015).
- 6) Amodei D., Anubhai R., Battenberg E., Case C., Casper J., Catanzaro B., Chen J., Chrzanowski M., Coates A., Diamos G., Elsen E., Engel J., Fan L., Fougner C., Han T., Hannun A., Jun B., LeGresley P., Lin L., Narang S., Ng A., Ozair S., Prenger R., Raiman J., Satheesh S., Seetapun D., Sengupta S., Wang Y., Wang Z., Wang C., Xiao B., Yogatama D., Zhan J., Zhu Z. ArXiv151202595 Cs (2015).
- 7) Wu Y., Schuster M., Chen Z., Le Q. V., Norouzi M., Macherey W., Krikun M., Cao Y., Gao Q., Macherey K., Klingner J., Shah A., Johnson M., Liu X., Kaiser Ł., Gouws S., Kato Y., Kudo T., Kazawa H., Stevens K., Kurian G., Patil N., Wang W., Young C., Smith J., Riesa J., Rudnick A., Vinyals O., Corrado G., Hughes M., Dean J. ArXiv160908144 Cs (2016).
- 8) Gehring J., Auli M., Grangier D., Yarats D., Dauphin Y. N. ArXiv170503122 Cs (2017).
- 9) Krizhevsky A., Sutskever I., Hinton G. E., Proc. 25th Int. Conf. Neural Inf. Process. Syst., 1, 1097–1105 (2012).
- 10) Simonyan K., Zisserman A. ArXiv14091556 Cs (2014).
- 11) Fourches D., Muratov E., Tropsha A., J. Chem. Inf. Model., 50, 1189–1204 (2010).
- 12) Halgren T. A., J. Comput. Chem., 17, 490–519 (1996).
- 13) Landrum G., RDKit: Open-source cheminformatics.: ‹http://www.rdkit.org›.
- 14) Stewart J. J. P., J. Mol. Model., 19, 1–32 (2013).
- 15) J. P. Stewart J. MOPAC2016.: ‹http://openmopac.net/›.
- 16) Chen T., Li M., Li Y., Lin M., Wang N., Wang M., Xiao T., Xu B., Zhang C., Zhang Z. ArXiv151201274 Cs (2015).
- 17) Glorot X., Bengio Y., Proc. Thirteen. Int. Conf. Artif. Intell. Stat., 9, 249–256 (2010).
- 18) Kingma D. P., Ba J. L. ArXiv14126980 Cs (2014).
- 19) Breiman L., Mach. Learn., 45, 5–32 (2001).
- 20) Cox D. R., J. R. Stat. Soc., B, 20, 215–242 (1958).
- 21) Moriwaki H., Tian Y.-S., Kawashita N., Takagi T., J. Cheminformatics, 10, 4 (2018).
- 22) Pedregosa F., Varoquaux G., Gramfort A., Michel V., Thirion B., Grisel O., Blondel M., Prettenhofer P., Weiss R., Dubourg V., Vanderplas J., Passos A., Cournapeau D., Brucher M., Perrot M., Duchesnay E., J. Mach. Learn. Res., 12, 2825–2830 (2011).