Abstract
The aim of this study was to demonstrate the usefulness of T2 measurements conducted with a time-domain NMR (TD-NMR) for the characterization of active pharmaceutical ingredients (APIs) containing solid dosage forms. A solid dispersion (SD) and a physical mixture (PM) consisting of indomethacin (IMC) and polyvinylpyrrolidone (PVP) were prepared at different weight ratios as test samples, and then their T2 relaxation curves were measured by TD-NMR. The T2 relaxation curve of IMC was quite different from that of PVP by nature. T2 values of the SD and PM samples became gradually shortened with increasing IMC content. No difference in T2 relaxation curves was observed between SD and PM. By analyzing the T2 relaxation curves in detail, we succeeded in precisely quantifying the IMC contents incorporated in the samples. Next, this study evaluated the T2 relaxation curves of amorphous and crystalline states of powdered IMC. T2 relaxation rate of crystalline IMC was slightly but significantly higher than that of amorphous IMC, proving that the T2 measurement was sensitive enough to detect these differences. Finally, a thermal stress was imposed on SD and PM samples at 60°C for 7 d, and then an amorphous-to-crystalline transformation occurred in IMC in the PM sample and was successfully monitored by T2 measurement. We believe that T2 measurement by TD-NMR is a promising analysis for the characterization of APIs in solid dosage forms, including SD-based pharmaceuticals.
Introduction
Various technical approaches have been applied in the pharmaceutical industry to improve the solubility of active pharmaceutical ingredients (APIs).1–5) Amorphization using the solid dispersion (SD) technique is regarded as a promising pharmaceutical technology.5) We recently used the time-domain NMR (TD-NMR) method to evaluate the crystalline state of APIs incorporated into solid oral dosage forms including amorphous SDs.6,7) TD-NMR is a benchtop instrument used for measuring the 1H-NMR relaxation.8) Instead of the molecular structure analysis performed with solid-state NMR spectroscopy,9) TD-NMR enables easy and rapid measurement of the T1 and T2 relaxation times (T1 and T2, respectively) of the samples. Moreover, TD-NMR can be used to evaluate both solid and liquid samples.10,11)
In a previous study, we demonstrated that T1 was an effective parameter for distinguishing between amorphous and crystalline APIs (e.g., indomethacin (IMC) and carbamazepine). The crystalline state of APIs can be evaluated even if the APIs are incorporated into solid dosage forms such as SD. We further analyzed the T1 relaxation curves of a physical mixture (PM) consisting of APIs and a carrier polymer for SD, and then precisely quantified the API contents in the samples.6) In the course of the studies, we have investigated a wide range of aspects of T1 measurement for use in the evaluation of the crystalline state of APIs. In contrast to the abundant knowledge on T1 measurement, the study of T2 measurement remains limited. In a previous study, we measured the T2 of amorphous and crystalline APIs; however, these T2 relaxation curves appeared to be similar to each other. Thus, at present, it remains uncertain whether T2 is applicable for evaluating the crystalline state of APIs. Besides our work, there are several reports suggesting that T2 measurement is effective for this purpose. For example, in polymer research, T2 is frequently used to identify the amorphous and crystalline regions of polymers.12) In pharmaceutical research, Yoshioka and colleagues13) investigated the crystalline state of APIs containing F atoms based on the 19F T2 measurement using low-frequency NMR. Moreover, they investigated the molecular mobility of hydrated water in various APIs based on T1 and T2 measurements,14) and reported that the molecular states of sodium phosphates (Na2HPO4·12H2O and Na2HPO4·2H2O) differed from each other in terms of not only T1, but also T2. In general, it is considered that the regions of interest of T1 and T2 are different: the monitored area of T2 is larger than that of T1. Thus, it is our opinion that, like T1, T2 could be a sensitive parameter for characterizing the crystalline state of APIs; T1 and T2 are suitable for investigating “microscopic” and “macroscopic” molecular motions, respectively.
Against these issues, this study focused on the usefulness of T2 measurements by TD-NMR for the evaluation of the crystalline state of APIs in solid dosage forms, including SD-based pharmaceuticals. The present study used IMC and polyvinylpyrrolidone (PVP) as a model API and a carrier polymer of SD. The first objective of the present study was to determine whether T2 measurement could quantify the IMC contents in samples. The second objective was to determine whether T2 measurement could characterize the crystalline state of APIs, such as the difference between the amorphous and crystalline forms. As a result of this study, we clarified that, like T1, T2 is a powerful tool for evaluating the crystalline state of APIs in solid dosage forms.
Experimental
MaterialsIMC (minimum purity 98.0%) was purchased from Tokyo Chemical Industry (Tokyo, Japan). PVP K30 (Kollidon® 30) was kindly supplied at no charge by BASF (Ludwigshafen, Germany). Other chemicals used were of reagent grades.
Sample Preparation of Amorphous IMC and PMsAmorphous IMC was prepared by the melt-quenching method.15) IMC crystals were placed on a heated Teflon-coated glass plate at ca. 190 and 160°C for a few minutes. The melts were then quench-cooled by immersion in liquid nitrogen. The resulting samples were lightly ground in a mortar, and then passed through a 500 µm sieve. For preparation of physical mixture samples, the amorphous APIs were mixed with PVP at weight ratios (w/w) of 20 : 80, 40 : 60, 60 : 40, and 80 : 20.
Sample Preparation of Amorphous SDsSDs containing amorphous IMC were prepared by the melt-quenching method15) following the solvent evaporation method. Designated amounts of IMC and PVP (20 : 80, 40 : 60, 60 : 40, 80 : 20, 85 : 15, 90 : 10, 95 : 5, and 99 : 1 (w/w)), were dissolved in ethanol–dichloromethane, 1 : 1 (v/v), at a total concentration of 100 mg/mL, and the solvent was removed using an evaporator (Rotavapor® R-134; Büchi, Flawil, Switzerland) at 40–50°C. The resulting samples were further treated by the melt-quenching method to ensure that all incorporated IMC would be amorphous. Namely, all the obtained samples were placed on a heated polytetrafluoroethylene sheet at ca. 160°C for a few minutes, and then the melts were quench-cooled by immersion in liquid nitrogen. The resulting samples were lightly ground in a mortar, and then passed through a 500 µm sieve. As a comparative control, PVP and amorphous API were also prepared by the same method as for the SDs.
Powder X-Ray Diffraction (PXRD) MeasurementPXRD patterns of all samples were obtained using a D8 DISCOVER apparatus (Bruker BioSpin Corp., Billerica, MA, U.S.A.) with Cu-Kα radiation (λ = 0.154 nm). The count scanning rate was 10°/min and the scanning angle was from 2θ = 5° to 50°.
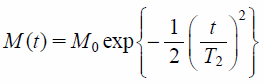
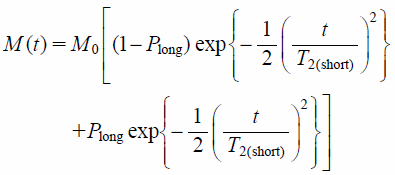
TD-NMR MeasurementThe 1H T2 relaxation curves of the samples were measured by TD-NMR using a Bruker minispec mq20 instrument (Bruker BioSpin Corp.) at a 1H frequency of 20 MHz at 25°C. The solid echo sequence was used for the measurement. The following parameters were applied: scans = 16, recycle delay = 10 s, gain = 60 dB, and dummy shots = 4. The 1H T2 relaxation time (T2) was calculated from the free induction decay using TD-NMR Analyze software (Bruker BioSpin Corp.). After removing the offset value from intact T2 relaxation curves, the T2 relaxation data were calculated according to Gaussian curve fitting (Eq. 1)13,14,16):
 | (1) |
 | (2) |
where M(t) and M0 are the transverse magnetization at times t and 0 with Gaussian decay, t is the acquisition time, and T2 is the T2 relaxation time. The terms T2(short) and T2(long) are T2s that have fast or slow relaxation speeds, respectively, and Plong is the fraction of protons with T2(long).
Results and Discussion
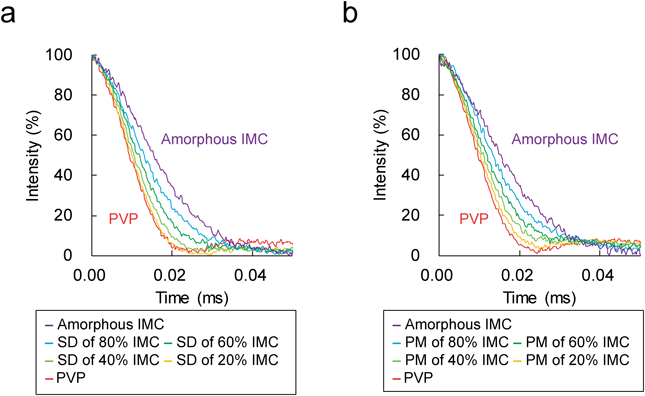
Quantification of IMC Contents in SDs and PMs by Analysis of T2 Relaxation CurvesFigure 1 shows the T2 relaxation curves of the samples consisting of amorphous IMC and PVP at the designated weight ratio. These curves have clearly changed with the change in the weight ratio of IMC and PVP; the decay of the NMR signal became slower with an increase in IMC content. The T2 values were calculated from these curves. For this calculation, Gaussian curve fitting (Eq. 1) was used because of the better approximation. T2 values increased with increasing IMC content: 8.4 ± 0.0 and 8.4 ± 0.0 µs for SD and PM containing 20% IMC and 11.8 ± 0.1 and 11.5 ± 0.0 µs for those containing 80% IMC, respectively (Table 1). The T2 relaxation curves between SDs and PMs were completely consistent: almost the same T2 values were observed from SD and PM for the same weight ratios of IMC and PVP. In addition to the single-Gaussian curve fitting, the present study analyzed the T2 relaxation curves using bi-Gaussian curve fitting (Eq. 2) to estimate the IMC content in the samples. Based on our previous studies,6,7) T2(short) and T2(long) were considered to correspond to the T2 values of PVP and IMC incorporated into the samples, respectively. The IMC content was estimated from the fraction of protons with T2(long) (Plong). Although the binary fitting was applicable to the obtained T2 relaxation curves of Fig. 1, the precise estimation of IMC content appeared to be difficult in particular for the samples containing a lower amount of IMC. For instance, for the SD and PM samples containing 20% IMC, the estimated IMC contents were much lower than the actual contents—namely, 4.5 and 10.6%—and 99.8 and 131.4 µs of their T2(long) values were much larger than the value obtained for amorphous IMC, 13.8 µs (Table 1). As is the case with single-Gaussian curve fitting analysis, almost the same T2 values were calculated from the bi-Gaussian curve fitting analysis between SD and PM.
Table 1. Gaussian Curve Fitting Analysis of
T2 Relaxation Curves for SDs and PMs
| Samples | Designated IMC content | Single-Gaussian fitting analysisa) | Bi-Gaussian fitting analysisb) |
|---|
| T2 (µs) | Plong | Estimated IMC content (%) | T2(short) (µs) | T2(long) (µs) | Plong | Estimated IMC content (%) |
|---|
| Solid dispersions (SDs) | 20% | 8.4 ± 0.0 | 0.14 ± 0.02 | 22.5 ± 2.3 | 8.3 ± 0.0 | 99.8 ± 9.1 | 0.03 ± 0.00 | 4.5 ± 0.3 |
| 40% | 9.1 ± 0.0 | 0.30 ± 0.00 | 44.3 ± 0.2 | 8.9 ± 0.0 | 53.9 ± 7.8 | 0.03 ± 0.00 | 5.1 ± 0.3 |
| 60% | 10.2 ± 0.0 | 0.53 ± 0.01 | 66.8 ± 0.9 | 9.5 ± 0.1 | 24.7 ± 2.4 | 0.08 ± 0.02 | 13.6 ± 2.5 |
| 80% | 11.8 ± 0.1 | 0.78 ± 0.01 | 86.2 ± 0.6 | 9.0 ± 0.5 | 16.1 ± 0.9 | 0.42 ± 0.09 | 56.1 ± 8.4 |
| Physical mixtures (PMs) | 20% | 8.4 ± 0.0 | 0.15 ± 0.01 | 24.7 ± 0.9 | 8.3 ± 0.0 | 131.4 ± 4.3 | 0.06 ± 0.00 | 10.6 ± 0.1 |
| 40% | 9.2 ± 0.0 | 0.34 ± 0.02 | 48.4 ± 1.7 | 8.9 ± 0.0 | 36.5 ± 3.8 | 0.04 ± 0.00 | 7.6 ± 0.8 |
| 60% | 10.1 ± 0.0 | 0.54 ± 0.02 | 67.7 ± 1.4 | 9.2 ± 0.2 | 22.6 ± 3.5 | 0.11 ± 0.03 | 18.8 ± 4.4 |
| 80% | 11.5 ± 0.0 | 0.76 ± 0.01 | 85.0 ± 1.0 | 8.9 ± 0.2 | 16.5 ± 0.5 | 0.37 ± 0.02 | 51.6 ± 2.4 |
| Amorphous IMC | 100% | 13.8 ± 0.0 | — | — | — | — | — | — |
| PVP | 0% | 7.9 ± 0.0 | — | — | — | — | — | — |
a) Calculated according to Eq. 1 and 3. b) Calculated according to Eq. 2. Each value represents the mean ± standard deviation (S.D.) (n = 3).
We previously evaluated the T1 relaxation curves of SDs and PMs consisting of IMC and PVP, and found a significant difference between them; SDs showed monophasic relaxation curves, whereas PMs showed biphasic curves. These differences were caused by the distinct mixed state of IMC and PVP in the samples. SD was produced by uniformly mixing IMC with PVP on a nanometer scale; thus, the monophasic behavior indicated that T1 measurement recognized the SDs as having a homogeneous structure. Furthermore, the calculated T1 values of the SDs were quite different from pure IMC and PVP, indicating that the uniform SD structures were regarded as being distinct from the pure components. By contrast, the T1 measurement could distinguish between individual IMC and PVP particles incorporated into PM samples, because the initial rapid relaxation curve was close to that of PVP, while the slow relaxation curve of the latter was close to that of IMC. Furthermore, for each type of PM, the weight ratios of IMC and PVP calculated by the binary analysis were highly consistent with the actual ratios. We thought that both IMC and PVP particles in PMs were large enough to be recognized by the T1 measurement, resulting in the biphasic relaxation curves.
It is our opinion that the T2 measurement SD and PM was similar to the T1 measurement of SD rather than that of PM. There was no obvious difference between the T2 relaxation curves of SD and PM. This indicates that the T2 measurement could not recognize IMC and PVP particles in PMs as the individual component because these particles were too small for T2 measurement. Moreover, good fitting of the T2 relaxation curves of SD and PM was achieved with the single-Gaussian approximation: the monophasic relaxation curve also indicated that the T2 measurement recognized the both samples as having a uniform structure. Furthermore, the area monitored by the T2 measurement was supposed to be much larger than that monitored by the T1 measurement, because the proton resonance frequency of T2 is lower than that of T1. The binary analysis can be working under the condition that the sample consisted of two distinct domains, and they could be separately detected by the measurement. From these issues, we do not think that binary analysis is suitable for the T2 measurement to evaluate the IMC contents in the test samples.
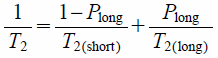
To estimate the IMC contents precisely, we next analyzed the T2 values calculated from the single-Gaussian fitting in detail (Eq. 1). In NMR studies of a relative liquid, two distinct protons that are rapidly exchanging are frequently expressed as follows.17)
 | (3) |
where T2 is the observed overall T2 relaxation time, T2(short) and T2(long) are the T2 relaxation times of the distinct protons, and Plong is the fraction of proton having T2(long). The reciprocal of T2, 1/T2, is defined as the T2 relaxation rate. Thus, the T2 relaxation rate is supposed to proportionally related to Plong.
Cooper et al.18,19) used Eq. 3 to evaluate the molecular mobility of water molecules in a silica nanosuspension. They assumed that water molecules, solvent molecules of the test nanosuspension, were divided into two molecular states of free and bound water molecules interacting with the silica nanoparticles. As these water molecules were rapidly exchanged, the T2 relaxation curve showed a monophasic relaxation behavior. From these experiments, the authors successfully identified the distinct water molecules in the suspension by using Eq. 3. As far as the present study is concerned, it is unlikely that protons of IMC and PVP were rapidly exchanged because of the solid sample; however, the observed T2 relaxation curves appeared to have a monophasic behavior. Thus, we thought that there was a good possibility that this equation was applicable. Namely, T2 relaxation rate was supposed to change proportionally as a function of the weight ratio of IMC and PVP.
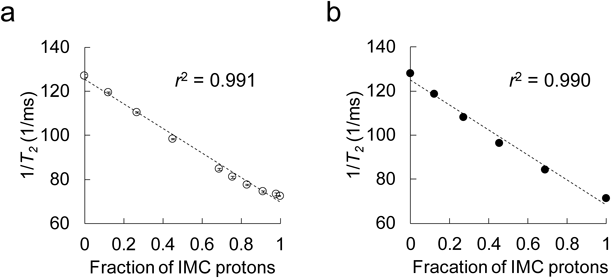
The changes in T2 relaxation rate as a function of IMC contents are shown in Fig. 2. As expected, the observed values of the SDs and PMs became proportionally shorter with increasing IMC content in a dose-dependent manner (Figs. 2a, b); their determination coefficients were very high (r2 = 0.991 and 0.990). Next, the IMC content in the samples was estimated using Eq. 3. Namely, T2 values of amorphous IMC and PVP were plugged in for T2(long) and T2(short), and then the Plong values, the fractions of the IMC proton, were calculated. Next, experimental IMC contents were estimated by taking the following parameters into account: Plong, proton mass, molecular weight, and the weight ratio of components in PMs (the parameters of PVP were calculated from its monomer unit, vinylpyrrolidone). As a result of the analysis, precise estimation of IMC contents in the sample was successfully achieved (Table 1). The estimated IMC content calculated from the results of PMs containing 20, 40, 60, and 80% IMC were 24.7, 48.4, 67.7, and 85.0%, respectively; the estimation was much higher than that obtained from the binary analysis (Table 1). We further stress that the same T2 relaxation rates can be obtained regardless of SD or PM: e.g., 8.4 ± 0.0 and 8.4 ± 0.0 ms−1 for SD and PM containing 20% IMC, compared with 11.8 ± 0.1 and 11.5 ± 0.0 ms−1 for SD and PM containing 80% IMC, respectively. From these findings, we concluded that this analysis has achieved precise estimation of IMC contents in the test samples. As mentioned in the Introduction, TD-NMR enables the measurement of T2 rapidly and easily. Furthermore, the measurement is carried out nondestructively. Thus, this technique could be powerful for component analysis of solid dosage forms, including SD-based pharmaceuticals.
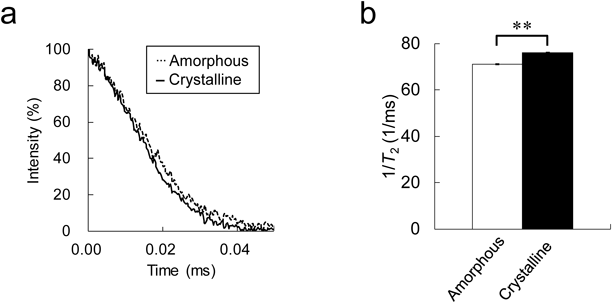
Evaluation of the Crystalline State of IMC Based on T2 Relaxation CurvesIn the next stage of this study, the crystalline state of IMC was evaluated. The T2 relaxation curves of crystalline and amorphous IMC were measured, and the T2 relaxation rates calculated by the single-Gaussian curve fitting (Eq. 1) were compared. Although the T2 relaxation curves appeared to be almost the same (Fig. 3a), the calculated values of crystalline IMC were significantly higher than those for amorphous IMC: 76.2 ± 0.2 and 71.0 ± 0.3 ms−1 for the crystalline and amorphous forms, respectively. We note that the same result was observed from carbamazepine and ursodeoxycholic acid (see Supplementary Materials, Fig. S1). It is well known that the relationship between relaxation time and rotational time reflects the molecular mobility of a compound.20) In general, the lower the molecular mobility, the shorter the T2. Thus, the findings in this study are quite reasonable. As mentioned in Introduction, we have previously verified that the T1 value measured by TD-NMR was an effective parameter for evaluating the crystalline state of API powders: the T1 of crystalline APIs was clearly longer than that for amorphous forms. By contrast, at that time, from the T2 measurement, we could not notice any difference between them. However, in the present study, we confirmed that there were slight but significant differences in T2 relaxation rate between amorphous and crystalline APIs (Fig. 3b and Fig. S1). Our findings led us to suggest that the T2 measurement is also useful for the evaluation of the crystalline state of API powers.
Continuous Monitoring of the Crystalline State of IMC in PMs and SDs during the Thermal Stress TestIn the final phase of this study, we monitored the IMC amorphous-to-crystalline transformation accompanied by the change in T2 relaxation rate behavior. A thermal stress test was conducted at 60°C for 7 d to enhance the crystalline transformation. SDs and PMs containing 20% of amorphous IMC were used for this experiment as a test sample. In a preliminary study, we conducted a thermal stress test at 60°C for several weeks on the same SD and PM samples. The SD was quite stable, and no crystalline transformation was observed throughout the experimental period. As for the PM sample, a clear crystalline amorphous-to-crystalline IMC transformation started to be detected after only 3 d of storage. Based on these findings, the present study considered the SD and PM as being stable and unstable samples, respectively. At the designated intervals, the T2 relaxation rates and the PXRD spectra of the sample were continuously monitored.
From the continuous monitoring of PM, a clear prolongation of the T2 relaxation rates could be observed during the thermal stress test; the values increased from 117.0 ± 0.4 to 120.9 ± 0.2 ms−1 after storage for 7 d. By contrast, the T2 relaxation rates of the SDs were almost constant throughout the experimental period; the values at the initial point and after 7 d of storage were 119.5 ± 0.4 and 119.7 ± 0.3 ms−1, respectively (Fig. 4a). The amorphous IMC and PVP were also monitored as reference samples. Similar to PM, an obvious change in T2 relaxation rate was observed from the amorphous IMC powder; the values expanded from 74.3 ± 0.4 to 76.2 ± 0.5 ms−1 until the end of the 7-d experimental period (Fig. 4b). As for PVP, no change in T2 relaxation rate was observed throughout the experimental period, similar to the SD sample: 127.1 ± 0.6 and 126.6 ± 0.4 ms−1 for the samples at the initial point and after 7 d of storage, respectively (Fig. 4c).
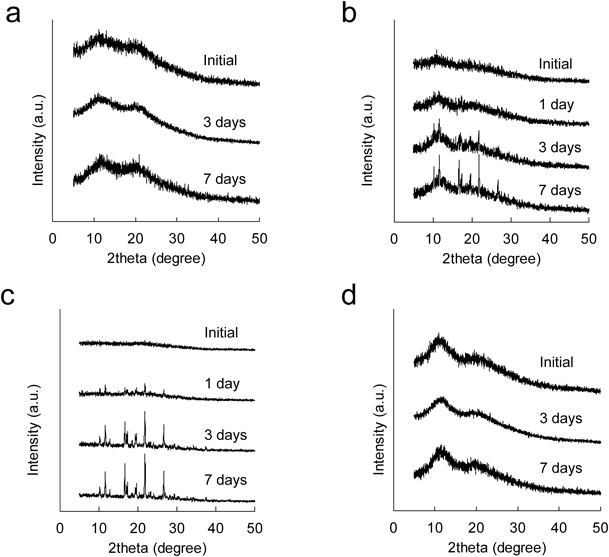
The PXRD patterns during the thermal stress test are shown in Fig. 5. The PM sample began to show clear crystalline diffraction peaks after 3 d of storage (Fig. 5b), and then the peak intensity clearly increased after 7 d of storage, indicating that a crystalline transformation steadily developed with prolonging storage period. By contrast, the SD showed a halo pattern during the test (Fig. 5a). In addition, a reasonable change can be observed from comparative controls, amorphous IMC and PVP. The amorphous IMC showed clear crystalline diffraction peaks after 3 d (Fig. 5c), whereas PVP showed a halo pattern during the test (Fig. 5d). From these findings, we concluded that the amorphous-to-crystalline transformation occurring in PM and SD samples of IMC can be evaluated by T2 measurement.
In general, monitoring the crystalline state of APIs in SD by TD-NMR is very difficult with T1 measurements because the spin diffusion of protons on average equals the T1 relaxation of neighboring protons. However, T2 is not affected by the spin diffusion of protons. This property of T2 relaxation enables quantification of the API in both SD and PM (see Fig. 2). The APIs could be quantified regardless of the miscibility of the two components. For example, if a small amorphous domain appeared in the crystalline API powder because of some external factor, the T1 relaxation would be averaged and could not be quantified. Additionally, even with conventional PXRD, the halo pattern would be too small to quantify the amorphous API. However, because the quantification of the T2 relaxation does not depend on miscibility, the amorphous part can be quantified from the API powder by T2 measurement. Moreover, compared with T1 measurements, more detailed and precise data analysis can be achieved by T2 measurements because they allow the acquisition of a massive amount of data points compared with the T1 relaxation curves. In this study, we confirmed that the differences in T2 between crystalline and amorphous APIs were slight but significant; thus, we believe that T2 measurement could be a promising technique to evaluate the crystalline state of APIs incorporated into solid dosage forms as well as T1 measurements.
Conclusion
In the first part of this study, we focused on the estimation of IMC contents in SD and PM samples. As a result of the detailed analysis of the T2 relaxation curves measured by TD-NMR, a precise estimation of the IMC content in the sample was successfully achieved. In the latter part of this study, we confirmed that T2 measurement could detect the difference between the amorphous and crystalline IMC; furthermore, it was effective in monitoring the transformation from amorphous to crystalline during a thermal stress test. In conclusion, the T2 relaxation behaviors measured by TD-NMR could offer profound insights into the characterization of APIs incorporated in solid dosage forms.
Acknowledgments
This work was supported by JSPS KAKENHI Grant Number JP16K08192 and JSPS Core-to-Core Program, B. Asia-Africa Science Platforms.
Conflict of Interest
The authors declare no conflict of interest.
Supplementary Materials
The online version of this article contains supplementary materials.
References
- 1) Berge S. M., Bighley L. D., Monkhouse D. C., J. Pharm. Sci., 66, 1–19 (1977).
- 2) Rabinow B. E., Nat. Rev. Drug Discov., 3, 785–796 (2004).
- 3) Loftsson T., Duchêne D., Int. J. Pharm., 329, 1–11 (2007).
- 4) Rautio J., Kumpulainen H., Heimbach T., Oliyai R., Oh D., Järvinen T., Savolainen J., Nat. Rev. Drug Discov., 7, 255–270 (2008).
- 5) Vasconcelos T., Sarmento B., Costa P., Drug Discov. Today, 12, 1068–1075 (2007).
- 6) Okada K., Hirai D., Kumada S., Kosugi A., Hayashi Y., Onuki Y., J. Pharm. Sci., 108, 451–456 (2019).
- 7) Okada K., Hirai D., Hayashi Y., Kumada S., Kosugi A., Onuki Y., Chem. Pharm. Bull., 67, 265–270 (2019).
- 8) Metz H., Mäder K., Int. J. Pharm., 364, 170–175 (2008).
- 9) Yuan X., Sperger D., Munson E. J., Mol. Pharm., 11, 329–337 (2014).
- 10) Stueber D., Jehle S., J. Pharm. Sci., 106, 1828–1838 (2017).
- 11) Kuentz M., Rothenhäusler B., Röthlisberger D., Drug Dev. Ind. Pharm., 32, 1165–1173 (2006).
- 12) Spiess H. W., Macromolecules, 50, 1761–1777 (2017).
- 13) Aso Y., Yoshioka S., Miyazaki T., Kawanishi T., Chem. Pharm. Bull., 57, 61–64 (2009).
- 14) Yoshioka S., Aso Y., Osako T., Kawanishi T., J. Pharm. Sci., 97, 4258–4268 (2008).
- 15) Strachan C. J., Taday P. F., Newnham D. A., Gordon K. C., Zeitler J. A., Pepper M., Rades T., J. Pharm. Sci., 94, 837–846 (2005).
- 16) Schumacher S. U., Rothenhäusler B., Willmann A., Thun J., Moog R., Kuentz M., J. Pharm. Biomed. Anal., 137, 96–103 (2017).
- 17) Cooper C. L., Cosgrove T., van Duijneveldt J. S., Murray M., Prescott S. W., Soft Matter, 9, 7211–7228 (2013).
- 18) Cooper C. L., Cosgrove T., van Duijneveldt J. S., Murray M., Prescott S. W., Langmuir, 28, 16588–16595 (2012).
- 19) Cooper C. L., Cosgrove T., van Duijneveldt J. S., Murray M., Prescott S. W., Langmuir, 29, 12670–12678 (2013).
- 20) Bloembergen N., Purcell E. M., Pound R. V., Phys. Rev., 73, 679–712 (1948).