Notes
Detection of Selenocyanate in Biological Samples by HPLC with Fluorescence Detection Using König Reaction
2019 年 67 巻 8 号 p. 884-887
詳細
2019 年 67 巻 8 号 p. 884-887
We developed a simple and sensitive HPLC method for the determination of selenocyanate (SeCN−). The König reaction, which is generally used for the determination of cyanide and thiocyanate, was applied for the post-column detection, and using barbituric acid as a fluorogenic reagent made it possible to detect SeCN− with high sensitivity. The limits of detection (LOD) and quantification (LOQ) were 73.5 fmol and 245.1 fmol, respectively. Subsequently, the amounts of SeCN− in human blood and in cultured cell samples were analyzed, and no SeCN− was detected in human whole blood. Interestingly, we have found that some of the spiked SeCN− decomposed to cyanide in human whole blood. Ascorbic acid suppressed the decomposition of SeCN− to cyanide by reducing the ferric ion, which is typically involved in SeCN− decomposition. Then, SeCN− was detected in cultured HEK293 cells exposed to selenite. The established HPLC method with fluorescence detection of SeCN− is useful for investigating small amounts of SeCN− in biological samples.
Recently, selenocyanate (SeCN−) was suggested as another metabolite of selenium.1) Excess selenium is toxic, while a small amount of it is essential to mammals. A major metabolite of selenium is selenosugar, which is excreted into urine.2–4) Anan et al. reported that SeCN− was generated in cells exposed to selenite (SeO32−). Since the toxicity of SeCN− to mammalian cells is less than that of selenite, Anan et al. pointed out that SeCN− must be one of the metabolites of selenium. To date, the roles of SeCN− in mammalian cells are still unknown.
To investigate the biological roles of SeCN−, a simple, highly sensitive and selective analytical method for SeCN−is required. Some relevant analytical methods have been reported.1,5–7) Anan et al. used inductively coupled plasma mass spectrometry (ICP-MS) to detect SeCN− in mammalian cells but the method is time- and cost-intensive. On the other hand, Vasuki et al. have reported that the König reaction, which is used for the determination of cyanide and thiocyanate,8–10) is applicable to SeCN− detection.5) We have already reported the simultaneous HPLC determination method of cyanide and thiocyanate coupled with the König reaction using barbituric acid as a fluorogenic reagent.8)
In this study, we developed a simple, highly selective, and sensitive method for the fluorescence detection of SeCN− in biological samples by using the König reaction. To the best of our knowledge, this is the first report of an analytical method for SeCN− optimized for biological samples that involves HPLC and fluorescence detection using the König reaction.
Potassium selenocyanate and glutathione (reduced form) were provided by Merck (Darmstadt, Germany). Sodium cyanide, sodium acetate, sodium perchlorate, and ascorbic acid were purchased from FUJIFILM Wako Pure Chemical Corporation (Osaka, Japan). Methanol (HPLC grade), ethanol, chloramine T, pyridine, hydrochloric acid, sodium carbonate, sodium hydrogen carbonate, iron(III) chloride hexahydrate, Dulbecco’s modified Eagle’s medium (DMEM, high glucose), and penicillin–streptomycin mixed solution were provided by Nacalai Tesque (Kyoto, Japan). Sodium thiocyanate was obtained from Kanto Chemical (Tokyo, Japan). Barbituric acid was purchased from Tokyo Chemical Industry (Tokyo, Japan). Fetal bovine serum was obtained from Thermo Fisher Scientific (Waltham, MA, U.S.A.). Purified water was prepared by the Milli-Q system (Merck).
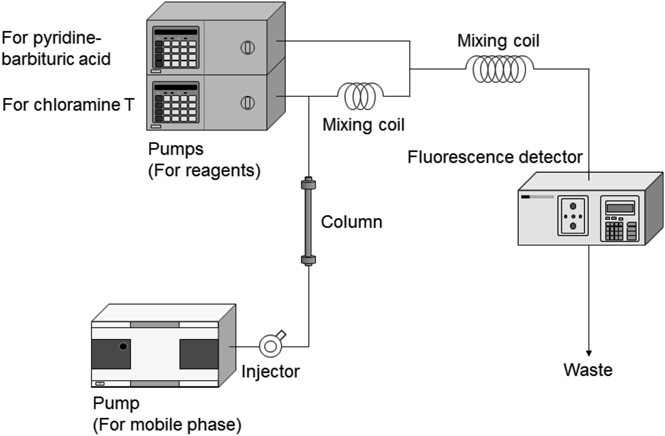
HPLC ConditionsThe HPLC system (Fig. 1) is essentially the same as that we previously reported.8) The system consisted of the Agilent 1100 Series (Agilent Technologies, Santa Clara, CA, U.S.A.), which contained a degasser, a pump (delivering mobile phase) and an autosampler. LC-10Ai and LC-10ATvp pumps (Shimadzu, Kyoto, Japan) were used to pump chloramine T solution and pyridine-barbituric acid solution, respectively. The fluorescent products were detected by an FP-1520S fluorescence detector (Jasco, Tokyo, Japan). The mobile phase was 0.1 M acetate buffer (pH 5.0) containing 12.5 mM sodium perchlorate/methanol (90/10, by volume) and its flow rate was 0.5 mL/min. A Scherzo SS-C18 column (3 µm, 250 × 4.6 mm i.d., Imtakt, Kyoto, Japan) with a guard column was used as the analytical column. 0.1% chloramine T aqueous solution was chosen as the chlorination reagent. The pyridine-barbituric acid solution consisted of 5% (w/v) barbituric acid, 15% (v/v) pyridine, and 3% (v/v) concentrated hydrochloric acid. Each reagent was pumped at a flow rate of 0.1 mL/min. The excitation and emission wavelengths were set at 583 and 607 nm, respectively.
Potassium selenocyanate was dissolved in water to produce a 1 M aqueous solution. Then, the solution was diluted with 0.1 M bicarbonate buffer (pH 10.0)/ethanol (80/20, by volume). To evaluate the linearity, six different concentrations of selenocyanate (0, 1, 5, 10, 50, and 100 pmol) were prepared. The limit of detection (LOD) and quantification (LOQ) were calculated as three and ten standard deviations, respectively, of the lowest calibrant concentration divided by the slope of the calibration curve. Each experiment was repeated five times.
Blood Sample and Sample PreparationBlood samples were collected from healthy non-smoking volunteers. Heparin was used as the anticoagulant agent.
A whole blood sample (100 µL) was mixed with the same volume of water. After 10 min, 200 µL of ethanol was added to the solution. After 10 min, the suspension was centrifuged at 8000 × g for 5 min. An aliquot (80 µL) of the supernatant was mixed with 120 µL of 0.1 M bicarbonate buffer (pH 10.0) and the solution was filtered through a Millex-LH membrane filter (pore size: 0.45 µm). The filtrate (10 µL) was injected into the HPLC.
Effect of Ascorbic Acid on Decomposition of SelenocyanateIron(III) chloride hexahydrate was dissolved in methanol and diluted to 10 mM. The solution (170 µL) was mixed with 20 µL of 1 M ascorbic acid or water. Then, 10 µL of 10 mM potassium selenocyanate aqueous solution was added. This mixture (10 µL) was injected into the HPLC.
Blood containing 200 mM ascorbic acid or phosphate buffered saline (PBS(−)) was used to investigate the decomposition of selenocyanate. The blood was spiked with 10 µM sodium cyanide for the control or with 10 µM sodium cyanide and potassium selenocyanate for the selenocyanate-added group. Sample preparation for cyanide and selenocyanate analysis was performed as described above.
Cell CultureHuman embryonic kidney cells (HEK293) were obtained from the America Type Culture Collection (Manassas, VA, U.S.A.). Cells were cultured in DMEM supplemented with 10% fetal bovine serum and 100-fold diluted penicillin–streptomycin mixed solution at 37°C under 5% CO2.
Exposure of HEK293 Cells to Selenite and Sample PreparationExposure of HEK293 cells to selenite was done according to the method described by Anan et al.1) HEK293 cells were exposed to 10 µM sodium selenite for 24 h. The exposed cells were collected and suspended in 100 µL of PBS(−). The cells were homogenized with a 27G needle. Ethanol (200 µL) was added to this homogenate to remove proteins and the subsequent procedure was the same as that for blood samples. The HPLC injection volume in each experiment was 50 µL.
The König reaction can be used to detect not only selenocyanate, but also cyanide and thiocyanate. Therefore, the separation of these anions is needed to analyze them appropriately. As we have previously used a TSK-gel SAX column to separate cyanide and thiocyanate,11) we attempted to separate selenocyanate from cyanide and thiocyanate on this system. Unfortunately, the selenocyanate ion strongly absorbed onto the column under the conditions reported previously. A Scherzo SS-C18 column was subsequently selected from among the columns such as ODS and weak anion exchange (WAX) we tested. An acetate buffer solution (0.1 M, pH 5.0) containing 12.5 mM sodium perchlorate/methanol (90/10, by volume) was selected as the mobile phase for selenocyanate analysis using the Scherzo SS-C18 column. Under these conditions, cyanide, thiocyanate, and selenocyanate could be separated within 20 min (Fig. 2).
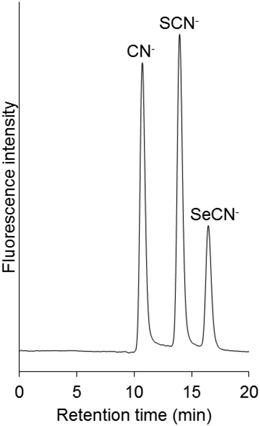
Standard solution containing 10 pmol each anion was injected.
To confirm whether selenocyanate can be determined by these conditions, we obtained a calibration curve (y = 355736x − 67790, R2 = 0.994) by the analysis of standard solutions with six different concentrations (0, 1, 5, 10, 50, 100 pmol) of selenocyanate. The correlation coefficient was more than 0.99. The calculated limits of detection (LOD, 3σ/slope: σ means the standard deviation of the peak areas of the lowest calibrant (1 pmol) and slope means the slope of the calibration curve) and quantification (LOQ, 10σ/slope) based on this calibration curve were 73.5 and 245 fmol, respectively. These results show that this method can analyze selenocyanate with high selectivity and sensitivity.
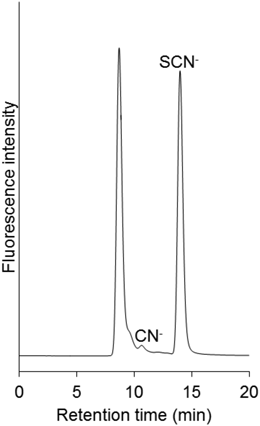
Analysis of BloodFirst, we tried to analyze selenocyanate in human whole blood, which is the most commonly used biological fluid, by the present HPLC method. However, selenocyanate was not detected, while cyanide and thiocyanate were detected in the samples obtained from healthy volunteers (Fig. 3). Contaminant peaks were also observed. We confirmed that the contaminant peak that appeared first was derived from glycine and glutathione by the injection of standard solutions of these compounds (data not shown). Cyanide is generated from glycine by the reaction with chlorination reagents, such as chloramine T or hypochlorous acid.12) Glutathione is a peptide containing glycine. Cyanide generated by this reaction may be detected.
When we used a blood sample spiked with selenocyanate standard and analyzed it by the above method, the cyanide peak was increased (Table 1). There are some reports which show the conversion of thiocyanate to cyanide in the presence of red blood cells.8,13) It has been suggested that the ferric ion (Fe3+) from methemoglobin mediates the degradation reaction of thiocyanate into cyanide. To examine if selenocyanate could be decomposed into cyanide in the same manner as thiocyanate, selenocyanate solution was added to iron(III) chloride methanolic solution. In the solution, most of the selenocyanate was converted to cyanide (Fig. 4A). In the next experiment, the excess amount of ascorbic acid was added (see Experimental) to the iron(III) chloride solution before the addition of selenocyanate in order to reduce the ferric ion to the ferrous ion (Fe2+). As expected, the decomposition of selenocyanate into cyanide was almost suppressed (Fig. 4B), and we observed quite similar results with the addition of ascorbic acid into blood before analysis (Table 1). These results strongly indicate that selenocyanate is decomposed to cyanide in biological fluids containing the ferric ion or other oxidative reagents.
| Ascorbic acid (−) | Ascorbic acid (+, 200 mM) | |
|---|---|---|
| Peak area of cyanide (vs. 10 µM SeCN− (—)) | 161.4 ± 2.6% | 96.3 ± 6.3% |
Peak areas between control and selenocyanate-added were compared. Data are shown as the means ± S.D. (n = 3).
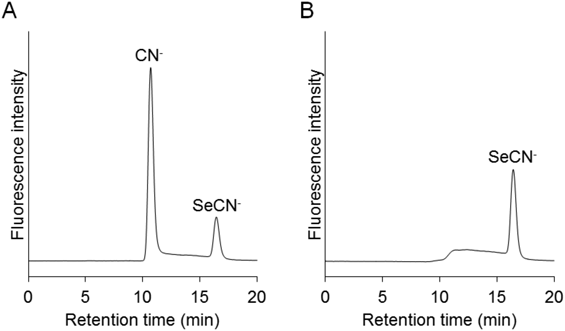
(A) Potassium selenocyanate was added to iron(III) chloride solution. (B) Potassium selenocyanate was added to iron(III) chloride solution after addition of ascorbic acid.
Selenocyanate in cultured HEK293 cells was analyzed as described in the previous paper.1) In this experiment, HEK293 cells were exposed to selenite by its addition to the culture medium. The detection of selenocyanate in the cultured cells has already been reported in a previous paper1) in which ICP-MS was used to detect the selenium atom. Figure 5 shows the presence of selenocyanate in the exposed sample, while there was no selenocyanate in the cell sample produced without the addition of selenite. Thiocyanate was also detected, but it might be derived from the fetal bovine serum added to the medium. Consequently, it is clear that our established method enables the detection of small amounts of selenocyanate in cells.
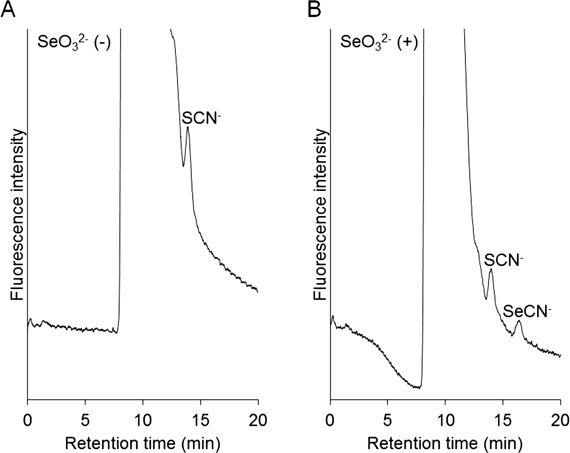
(A) HEK293 cells were not exposed to selenite. (B) HEK293 cells were exposed to 10 µM sodium selenite for 24 h.
Additionally, the large peak at the void volume was observed and it must be considered to identify it and, should be diminished for more accurate determination of selenocyanate in biological samples. It is now under investigation and may be possible for publication in the near future.
We successfully established a new analytical method for selenocyanate in biological samples. Deproteinized samples were analyzed by a post-column HPLC system coupled with highly sensitive detection based on the König reaction using pyridine and barbituric acid as the fluorogenic reagents. This method is simple, highly selective and sensitive compared with previous photometric methods. We found that some of the spiked selenocyanate was decomposed to cyanide in human whole blood, and ascorbic acid could suppress this. The ferric ion may be involved in this decomposition. The established method enables the detection of a small amount of selenocyanate in HEK293 cells, which was detected by ICP-MS at the same levels, as reported previously. The method established in this paper is useful and is a potential tool for the elucidation of the roles of selenocyanate in biological activity.
The authors declare no conflict of interest.