Abstract
Ceftiofur (CEF) is a third-generation and the first animal-specific cephalosporin that is widely used in animal husbandry. As a heat-labile antibiotic, the cytotoxicity of CEF after thermal treatment has been reported. This study seeks to investigate the potential toxicity of thermally treated CEF (TTC) in vivo based on acute oral toxicity studies and acute intraperitoneal studies in mice. Our data indicated that TTC exhibited significant increased toxicity in mice compared with CEF. TTC resulted in weight gain, hypercholesterolemia, hepatocyte steatosis and hepatocyte mitochondrial damage, and downregulated β-oxidation-related genes in mice in acute oral toxicity studies. In addition, TTC caused acute pulmonary congestion, increased levels of reactive oxygen species (ROS), prolonged coagulation time, and even death in mice in acute intraperitoneal toxicity studies. Our data showed that thermal treatment enhanced the toxicity of CEF in vivo. Lung and liver are the main target organs in the pathological damage process mediated by TTC. These findings suggested that residual CEF in animal-derived food may represent a potential food safety risk and pose a potential threat to human health.
Introduction
The consumption of antibiotics in livestock farming is vast. Approximately 70% of antibiotics were used in food producing animals to prevent disease and promote growth worldwide.1–3) Ceftiofur (CEF), a significant and effective veterinary-specific cephalosporin, is widely used in food animals, especially in the treatment of mastitis by intramammary (IMM) infusion.4–8) However, the concentration of CEF in milk may be greater than the tolerance set by the U.S. Food and Drug Administration (FDA),9) given the decrease of drug metabolism rate in diseased cows.10,11) The United States Department of Agriculture had reported that CEF was the predominant violative residue, accounting for 29% of residues in the United States.12) Previous studies have shown that antibiotic residues in animal-derived products could cause serious public health and food safety problems,13,14) such as resistance and allergy. Thus, the influence of CEF residue in animal-derived products should be well studied.
Heating is an important method to eliminate residual antibiotics in food, especially for heat-labile β-lactams and tetracyclines.15,16) However, some of the new degradation byproducts exhibit potential acute or chronic toxicity. The potential toxicity of Benzylpenicillin G in mice has been reported after heating treatment and the toxicity was increased 3.75-fold compared with benzylpenicillin G.17) CEF is an unstable antibiotic under acidic, alkaline, enzyme-catalyzed hydrolysis and high temperature conditions.16,18–20) Our previous studies have confirmed that thermally treated CEF (TTC) could induce cytotoxicity in vitro via apoptosis and that ceftiofur-aldehyde was the only toxic byproduct of TTC.21) Thus, residual CEF in animal-derived food could degrade during the cooking process, and the potential toxicity of TTC in vivo is worthy of further study. This study aimed to investigate the potential toxicity of TTC through acute oral toxicity studies and acute intraperitoneal studies in mice.
Experimental
Chemicals and ReagentsCeftiofur sodium (CEF, purity > 98%, CAS# 104010-37-9) was purchased from North China Pharmaceutical Group Corporation Veterinary Co., Ltd. (Shijiazhuang, China). The mouse reactive oxygen species (ROS) enzyme-linked immunosorbent assay (ELISA) kit was commercially obtained from Nanjing Jiancheng Bioengineering Institute (Nanjing, China). Veterinary coagulation test reagent and veterinary liver function test reagent were purchased from Chengdu Seamaty Technology Co., Ltd. (Chengdu, China). Tissue OCT-Freeze Medium (OCT) was purchased from Sakura Finetek U.S.A., Inc. (Torrance, U.S.A.). SYBR Green PCR Master Mix was commercially obtained from DBI Bioscience (Shanghai, China).
Preparation of Test SubstancesCEF was diluted in saline to yield a 500 mg/mL stock solution that was stored in the dark at −20 °C. The stock solution was diluted with milk or saline to the concentration required for the acute oral toxicity study or acute intraperitoneal toxicity study. Diluted solutions were transferred into glass vials and heated in a boiling water bath for 30 min (TTC30) and 60 min (TTC60), respectively.
AnimalsThe experimental procedures complied with the guidelines of the Jilin University Institutional Animal Care Committee and were approved by the Jilin University Experimental Animal Welfare Ethics Committee (permit number SY202904014). ICR mice (8 weeks old) were obtained from Liaoning Changsheng Biotechnology Co., Ltd. Mice were acclimatized to laboratory conditions with a temperature of 22 ± 2 °C and humidity of 55 ± 5% under light/dark (12 : 12) cycle for 7 d with free intake of feed and water.
Acute Oral Toxicity StudyTreatmentsThe acute oral toxicity study was performed according to the OECD Guideline for the Testing of Chemicals (No. 420) Acute Oral Toxicity fixed dose procedure. Briefly, twenty female mice were randomly divided into four groups (Control, CEF, TTC30 and TTC60, n = 5 in each group). All mice were fasted for 12 h before the experiment. The first mouse of the CEF, TTC30 or TTC60 group was orally administered CEF, TTC30 or TTC60 at a limited dose of 5000 mg/kg body weight and 20 mL/kg volume. The first mouse of the control group was orally administered the same volume of milk that was boiled and cooled to room temperature. The mice were observed for toxic symptoms within the first four hours after the administration and fasted during this time. Regardless of whether the first mouse survived, the same treatment was performed to the second mouse. If the second mouse survived, three additional mice were dosed at 5000 mg/kg. If the second mouse died, the test was immediately terminated. Behavior changes, toxic symptoms and mortality of mice in each group were observed and recorded daily after dosing for 14 d. Body weights of mice in each group were recorded before oral administration and at the end of the study to calculate the weight alterations.
Measurements of Organ Weight, Macroscopic Observation and Histopathological ExaminationMice were euthanized under ether anesthesia at the end of the study. Vital organs, including the heart, the liver, the lungs, the spleen, the kidney, the perirenal and retroperitoneal white fat tissues, and the reproduction organs (uterus and ovaries) were removed and weighed. The relative weight of each organ was calculated using the following formula:
In macroscopic observation, the gross pathology or lesions of the organs in all mice were recorded, including the nasal, thoracic, abdominal, pelvic cavities and viscera. Organs were stored in 10% formaldehyde for hematoxylin–eosin (H&E) staining. In addition, the livers were fixed in OCT at −80 °C for Oil Red O staining, and histological changes were observed.
Microstructure Observation of Liver CellsFresh livers obtained from “Measurements of organ weight, macroscopic observation and histopathological examination” were obtained for ultrastructural observation. Livers were cut into small pieces and fixed in 2.5% glutaraldehyde solution at 4 °C overnight. All samples were washed thrice with phosphate buffer saline (PBS) (pH 7.2) and then placed in 1% osmium tetroxide for 1 h. After washing with PBS, samples were dehydrated in a graded concentration of ethanol (30, 50, 70, 80, 90, and 100%) for 20 min each time followed by acetone twice for 25 min. Samples were embedded in epon product and sectioned with an ultramicrotome. Ultrathin sections were stained with uranyl acetate and lead citrate for 20 min and 10 min, respectively. The liver samples were examined by transmission electron microscopy to evaluate the morphology of nuclei and organelles.
Determination of Liver Function ParametersIn this part, sixteen female mice were randomly divided into four groups (Control, CEF, TTC30 and TTC60, n = 4 in each group) and treated with CEF, TTC30, TTC60 or milk as described as “Treatments.” Blood samples were collected from the submandibular vein into ethylenediaminetetraacetic acid (EDTA) tubes on day 14 and detected using veterinary liver function test reagent by Veterinary Point-of-Care Chemistry Analyzer (Seamaty, SMT-120 V). Liver function was evaluated by analyzing serum levels of albumin (ALB), total protein (TP), globulin (GLO), total bilirubin (TBIL), glutamyl transpeptidase (GGT), aspartate aminotransferase (AST), alanine aminotransferase (ALT), alkaline phosphatase (ALP), total bile acid (TBA) and total cholesterol (TC).
Real-Time PCRMice were treated as described in “Treatments,” and livers were collected after 14 d. Total RNA was isolated using TRIzol (Invitrogen, Carlsbad, U.S.A.) method and then reverse transcribed to cDNA using a TaKaRa RNA PCR kit (AMV) ver 3.0 (TaKaRa, Kyoto, Japan). The PCR was initiated at 95 °C for 10 min followed by 40 cycles of 95 °C for 15 s and 50 °C for 30 s. The expression levels of tested genes were calculated using the 2−ΔΔCt method, and β-actin was used as a reference gene. The PCR primers were listed in Table 1.
Table 1. Primer Sequences of Genes
| Gene | Primer | Sequence 5′ to 3′ |
|---|
| β-Actin | Forward | TAAAGACCTCTATGCCAACACAGT |
| Reverse | AGTAACAGTCCGCCTAGAAGC |
| PPAR α | Forward | AACATCGAGTGTCGAATATGTGG |
| Reverse | CCGAATAGTTCGCCGAAAGAA |
| CPT1 α | Forward | TATGGTCAAGGTCTTCTCGGGTCG |
| Reverse | AGTGCTGTCATGCGTTGGAAGTCTC |
| Acads | Forward | TATCAGTGCCTTCCTGGTTC |
| Reverse | AGGGTTTGCATGGCTATTT |
| Acadm | Forward | TGACGGAGCAGCCAATGA |
| Reverse | TCGTCACCCTTCTTCTCTGCTT |
| Acadl | Forward | GCCTGTGAGTTCATGTTTG |
| Reverse | TTCAGATGCCCAGTATTT |
| Acadvl | Forward | GGCTCTGCAAGGCTGTAT |
| Reverse | GATTCCTGTCCTCCGTCTC |
For the acute intraperitoneal toxicity study, doses of CEF, TTC30 or TTC60 were set as 1000, 1200, 1440, 1728 and 2073.6 mg/kg according to the principle of the modified Karber method. Female mice were randomly divided into sixteen groups (Control, CEF, TTC30 and TTC60, n = 6 in each group). All mice were fasted for 12 h before the experiment. Saline in the same volume was used intraperitoneally as control. After intraperitoneal administration of each dose of CEF, TTC30 and TTC60, mice were observed for 14 d and especially during the first 4 h. Behavior changes, symptoms of toxicity and mortality of mice in each group were observed and recorded. The weight gain of mice at dose of 1000 mg/kg groups was calculated. The LD50 values and 95% confidence intervals were obtained using the formulae according to the modified Karber method.
Xm: dose logarithm for the maximal dosage; P: death rate of the mice in each group; i: the difference in the dose logarithm between the two nearest groups; S: standard error of the mean; X: 95% confidence interval; n: number of the mice in each group.
Macroscopic Observation and Histopathological ExaminationIn this experiment, 24 female mice were randomly divided into four groups (Control, CEF, TTC30 and TTC60, n = 6 in each group). CEF, TTC30 or TTC60 was administered by intraperitoneal injection at a dose of 1500 mg/kg. The same volume of saline was intraperitoneally administered as control. After 1 h of intraperitoneal administration, 3 mice in each group were euthanized under ether anesthesia. The methods of macroscopic observation and histopathological examination were as same as those reported in “Measurements of organ weight, macroscopic observation and histopathological examination.”
Determination of ROS in Blood and Bronchoalveolar Lavage FluidThe blood and bronchoalveolar lavage fluid (BALF) of the other three mice in each group in “Macroscopic observation and histopathological examination” were collected at 1 h post dosing. Serum obtained from each mouse was separated after blood centrifugation. Serum and BALF samples were assessed using the mouse ROS ELISA kit according to the manufacturer’s instructions.
Blood Coagulation AnalysisIn the process of blood collection described in “Determination of ROS in blood and bronchoalveolar lavage fluid,” each blood sample was divided into two parts. One portion was used for the determination of ROS in “Determination of ROS in blood and bronchoalveolar lavage fluid” and the other were placed in 4% sodium citrate tubes for blood coagulation analysis. Serum obtained from each mouse was separated after blood centrifugation and analyzed using the veterinary blood coagulation test reagent with the Veterinary Point-of-Care Chemistry Analyzer (Seamaty, SMT-120V).
Statistical AnalysesStatistics were analyzed using the GraphPad Prism 5 program. Data are presented as the means ± standard deviation (S.D.). Significant differences were analyzed by one-way ANOVA followed by Newman–Keuls test or Dunnett’s t test. The results were considered statistically significant at p < 0.05.
Results
Acute Oral Toxicity StudyClinical Signs and LD50In the acute oral toxicity study, all mice survived to the end of the study and exhibited normal behavior during the study. No apparently abnormal clinical signs of toxicity were observed in all groups. Thus, the LD50 was greater than 5000 mg/kg. Significant weight gain was noted in both of the TTC30 group and the TTC60 group compared with the CEF group and the control group (Fig. 1A).
The results of relative organ weights are shown in Table 2. In this assay, the relative liver weights in the CEF, TTC30 and TTC60 group were significantly increased compared with control group, which is consistent with the data presented in Fig. 1A.
Table 2. Organ Weights of Mice Treated with CEF, TTC30 or TTC60 in Acute Oral Toxicity Studies
| Organ | Control | CEF | TTC30 | TTC60 |
|---|
| Liver | 4.02 ± 0.23 | 4.71 ± 0.15* | 4.85 ± 0.23* | 5.25 ± 0.55** |
| Abdominal adipose | 4.04 ± 0.89 | 3.98 ± 0.75 | 4.07 ± 0.41 | 3.10 ± 0.69 |
| Kidney | 1.14 ± 0.08 | 1.26 ± 0.12 | 1.23 ± 0.09 | 1.21 ± 0.11 |
| Lung | 0.50 ± 0.06 | 0.52 ± 0.01 | 0.50 ± 0.02 | 0.60 ± 0.06* |
| Spleen | 0.34 ± 0.05 | 0.41 ± 0.03 | 0.37 ± 0.01 | 0.42 ± 0.06 |
| Reproductive organs | 0.36 ± 0.27 | 0.45 ± 0.11 | 0.48 ± 0.06 | 0.48 ± 0.19 |
| Heart | 0.45 ± 0.06 | 0.48 ± 0.05 | 0.42 ± 0.03 | 0.44 ± 0.05 |
Data were presented as the mean ±S.D.; n = 4 per group. The relative organ weights were calculated using organ weight/body weight ×100. Significant differences were analyzed by one-way ANOVA followed by a Dunnett’s t test. * p < 0.05 or ** p < 0.01 compared with the control group.
No significant pathological changes were noted in all groups based on macroscopic examinations. However, histopathological examination results showed that the livers of mice from both the TTC30 group and the TTC60 group exhibited obvious pathological changes (Fig. 1B). Many vacuoles of varying sizes appeared in the cytoplasm and were clearly demarcated. Hepatocytes were enlarged and swollen with obvious nuclei and unclear boundaries between cells. Based on Oil Red O staining (Fig. 1C), the vacuoles were identified as lipid droplets. Histopathological results showed that hepatocyte steatosis occurred in mice of the TTC30 group and the TTC60 group, whereas lipid droplets that were significantly reduced in number and size were noted in the CEF group compared with the TTC groups. The results of the liver function of all mice were mentioned in Table 3. In the TTC30 group and the TTC60 group, TC levels in mice were obviously increased compared with the control group (p < 0.05 and p < 0.01, respectively). No significant differences were noted between the CEF group and the control group. In addition, the difference in TP levels between the CEF group and the control group was significant. Other liver function parameters did not significantly differ among the four groups. These results indicated that the weight alterations in Fig. 1A may be caused by hepatocyte steatosis and hypercholesterolemia in mice from both the TTC30 group and TTC60 group.
Table 3. Effect of Oral Administration of CEF, TTC30 or TTC60 on Liver Function Parameters in Mice
| Parameters | Control | CEF | TTC30 | TTC60 |
|---|
| ALB | 25.95 ± 0.74 | 27.53 ± 1.58 | 25.25 ± 1.05 | 27.40 ± 0.91 |
| TP | 56.50 ± 2.13 | 62.30 ± 0.79* | 55.88 ± 4.11 | 58.95 ± 2.55 |
| GLO | 30.55 ± 2.12 | 31.27 ± 3.20 | 30.63 ± 3.23 | 31.55 ± 2.16 |
| TBIL | 3.00 ± 0.00 | 7.40 ± 5.20 | 6.38 ± 3.70 | 3.97 ± 1.23 |
| GGT | <2.00 | <2.00 | <2.00 | <2.00 |
| AST | 112.50 ± 28.86 | 166.00 ± 65.46 | 103.00 ± 16.02 | 83.25 ± 42.45 |
| ALT | 93.00 ± 18.68 | 146.67 ± 60.27 | 91.75 ± 11.23 | 99.75 ± 7.76 |
| ALP | 96.50 ± 10.59 | 110.67 ± 9.29 | 90.50 ± 7.63 | 85.75 ± 10.35 |
| TBA | 12.43 ± 3.06 | 14.39 ± 4.07 | 11.15 ± 0.78 | 18.10 ± 5.22 |
| TC | 2.52 ± 0.33 | 2.84 ± 0.57 | 3.39 ± 0.34* | 3.90 ± 0.32** |
ALB = albumin (g/L), TP = total protein (g/L), GLO = globulin (g/L), TBIL = total bilirubin (µmol/L), GGT = glutamyl transpeptidase (U/L), AST = aspartate aminotransferase (U/L), ALT = alanine aminotransferase (U/L), ALP = alkaline phosphatase (U/L), TBA = total bile acid (µmol/L), TC = total cholesterol (mmol/L). Data are expressed as the mean ± S.D. (n = 4 per group). Significant differences were analyzed by one-way ANOVA followed by a Dunnett’s t test. * p < 0.05 or ** p < 0.01 compared with the control group.
Transmission electron microscopy (TEM) examination was further employed to observe the changes in hepatocyte ultrastructure. Consistent with the light microscopy observations, hepatocytes in the TTC30 and TTC60 groups showed obvious lipid droplets. Moreover, the morphology of hepatocyte mitochondria in the TTC groups was significantly changed as noted by TEM observation. The control group and the CEF group exhibited well-developed mitochondria with integral membranes and cristae. However, the mitochondrial morphology of the TTC30 and the TTC60 group was changed as demonstrated by increases in shapes, swelling and ridge fractures. In the TTC groups, the nuclear membranes edges were irregular, and chromatin became dense (Fig. 1D). These results suggested that TTC could induce hepatocyte mitochondrial damage.
TTC Downregulated the Relative Expression of β-Oxidation-Related GenesIn “TTC induced hepatocyte mitochondrial damage in mice,” mitochondrial damage was observed in livers from TTC groups. To evaluate the mitochondrial function, expression levels of β-oxidation-related genes were detected through RT-PCR assays. As shown in Fig. 2, the gene expression of CPT1 α and Acadm was significantly lower in the TTC60 group compared with the control and CEF groups. These data indicated that the downregulation of CPT1 α and Acadm mediated by TTC may inhibit β-oxidation in mitochondria. In addition, the expression of peroxisome proliferator-activated receptor (PPAR) α and Acads was also downregulated, but no significant differences were detected.
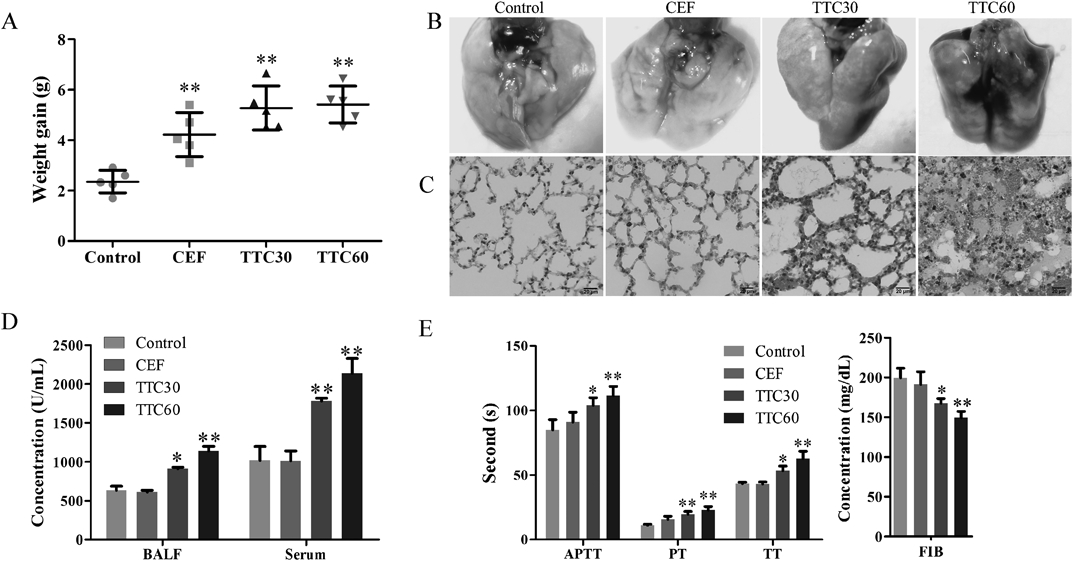
Acute Intraperitoneal Toxicity StudyClinical Signs and LD50Intraperitoneal administration is commonly used in toxicology experiments to assess the toxicity of chemicals entering the blood. Mice in the TTC30 group and the TTC60 group exhibited dyspnoeic symptoms, congestion of the tail vein, exophthalmos, convulsions and even death after intraperitoneal administration. The calculated LD50 values of TTC30 and TTC60 were 1484.44 mg/kg (95% confidence intervals were 1450.45–1519.22 mg/kg) and 1275.20 mg/kg (95% confidence intervals were 1168.17–1392.04 mg/kg), respectively, whereas the LD50 value of CEF was 1781.32 mg/kg (95% confidence intervals were 1662.93–1908.13 mg/kg). Detailed results are presented in Table 4. Significant weight gain was noted in the CEF, TTC30 and TTC60 groups at a dose of 1000 mg/kg compared with the control group (Fig. 3A).
Table 4. Survival Number and LD
50 Values of CEF, TTC30 and TTC60 in the Acute Intraperitoneal Toxicity Study
| Dose (mg/kg) | Survival number (live/total) |
|---|
| CEF | TTC30 | TTC60 |
|---|
| 1000 | 6/6 | 6/6 | 6/6 |
| 1200 | 6/6 | 6/6 | 4/6 |
| 1440 | 6/6 | 3/6 | 1/6 |
| 1728 | 4/6 | 1/6 | 0/6 |
| 2073.6 | 0/6 | 0/6 | 0/6 |
| LD50 (mg/kg) | 1781.32 | 1484.44 | 1275.20 |
| 95% Confidence intervals | 1662.93–1908.13 | 1450.45–1519.22 | 1168.17–1392.04 |
In macroscopic examinations, the lungs of mice in TTC groups appeared dark red, whereas the lungs of mice in the control group and CEF group were light pink (Fig. 3B). Significant pathological changes in other organs were not found in macroscopic examinations in all groups. Histopathological examination of the lungs revealed that mice in the control group and CEF group exhibited normal alveolar structures. In the TTC30 group and TTC60 groups, the lungs exhibited a compact texture with signs of significant alveolar septum widening, pulmonary vascular congestion and the presence of mass red blood cells. These characteristics were associated with pulmonary congestion. Notably, in the TTC60 group, pink proteinaceous materials were observed in the alveolar space, indicating that the lung tissues in the TTC60 group exhibited pulmonary edema that developed from pulmonary congestion (Fig. 3C).
TTC Induced Increased ROS in BALF and SerumTo further explore the effects of TTC on lung injury in mice, we detected ROS levels in BALF and serum after intraperitoneal injection for 1 h. Our data showed that significantly increased ROS in BALF and serum of the TTC30 and TTC60 groups compared with the control group (Fig. 3D). No significant difference between those in CEF group and control group. The results demonstrated that TTC could cause oxidative stress.
TTC Prolonged the Coagulation Time in MiceTo further investigate the toxicity of TTC, we analyzed blood coagulation function in mice after intraperitoneal injection for 1 h. As shown in Fig. 3E, the activated partial thromboplastin time (APTT), prothrombin time (PT), and thrombin time (TT) in the TTC30 and TTC60 groups were significantly increased compared with the control group. Fibrinogen (FIB) levels in the TTC30 and TTC60 groups were significantly reduced compared with the control group. All blood coagulation function parameters in the CEF group were not different compared with the control group. The results indicated that TTC could prolong the coagulation time.
Discussion
As an unstable antibiotic that is sensitive to temperature, time, pH and light, CEF could degrade in many conditions.16,19,20,22–24) Ribeiro et al. demonstrated that CEF produced ecotoxicity after phototransformation.25) In addition, our previous studies reported the cytotoxicity of CEF after thermal treatment.21,25) Here, we reported that the toxicity of CEF significantly increased after thermal treatment in vivo.
Under physiological conditions, seventy-five percent of the liver’s blood comes from the gastrointestinal tract and spleen through the portal vein, and the remaining 25% comes from the hepatic artery. Therefore, drugs are absorbed by the digestive tract after oral administration, and portal vein blood enriched with drugs is delivered to the liver at high drug concentrations. The drug further undergoes a series of complex biochemical reactions in liver.26) Liver is susceptible to drug injury given its unique vascular and metabolic characteristics. Thus, liver damage and weight gain were observed in mice of the TTC groups. Significant pathological changes caused by TTC around the blood vessels were observed in mice in the acute oral toxicity study.
As known, mitochondrial function is essential for maintaining lipid balance. Hepatotoxicants may alter the lipid balance by inhibiting mitochondrial β-oxidation, leading to the accumulation of intracellular fatty acids and triacylglycerol.27–29) According to TEM observations, TTC caused hepatocyte mitochondrial damage, and the damage to hepatocyte mitochondria may involve a mechanism of hepatocyte steatosis induction. Therefore, we hypothesized that hypercholesterolemia and obesity caused by TTC may be due to mitochondrial damage.
CPT1 α is a key enzyme of β-oxidation, which is required for transport of long-chain fatty acids into mitochondria. Downregulation of CPT1α expression led to decreased transport of long-chain fatty acids (LCFAs) into mitochondria, further causing LCFAs to be deposited in the cytoplasm and thereby aggravating hepatic lipid accumulation.30) β-Oxidation in mitochondria is the main catabolic pathway of most fatty acids in the liver.31) In mitochondria, four different dehydrogenases participate in the complete degradation of fatty acids: short-chain acyl-CoA dehydrogenase (SCAD, encoded by acads), medium-chain acyl-CoA dehydrogenase (MCAD, encoded by acadm), long-chain acyl-CoA dehydrogenase (LCAD, encoded by acadl), and very long-chain acyl-CoA dehydrogenase (VLCAD, encoded by acadvl). These enzymes exhibit difference in the acyl chain lengths of their preferred substrates.32) Downregulation the expression levels of these four genes can inhibit mitochondrial β-oxidation of fatty acids and induced hepatic lipid accumulation.33) PPAR α is a ligand-activated transcription factor that controls the expression of genes related to fatty acid uptake and fatty acid-oxidation.34) Studies showed that inactivation of PPAR α induced weight gain and hepatic lipid accumulation.35,36) Thus, downregulation of PPAR α may suppress reduction of fatty acid-oxidation enzymes in livers and finally led to excessive hepatic lipid accumulation. In summary, our data demonstrated that the downregulation of β-oxidation-related genes mediated by TTC may inhibit β-oxidation in mitochondria, affect mitochondrial function, induce hepatic lipid accumulation and eventually lead to hepatocyte steatosis.
In the acute intraperitoneal toxicity study, the LD50 value of TTC30 was increased 1.2-fold compared with that of CEF, whereas the LD50 of TTC60 was increased 1.4-fold compared with CEF, suggesting that the in vivo toxicity of CEF after thermal treatment was increased. TTC also causes acute pulmonary congestion. The symptoms of mice intraperitoneally treated with TTC indicated that the mice exhibited severe hypoxia and hypertension.37,38) During hypoxia, the pulmonary vasculature experiences hypoxic pulmonary vasoconstriction (HPV).39) However, on a sustained basis, HPV could increase pulmonary vascular resistance and right heart afterload, ultimately leading to pulmonary hypertension. The end-stage phase of pulmonary arterial hypertension results in severe dyspnoea and promotes coagulation.40) In this study, changes in blood coagulation parameters indicated a trend of disseminated intravascular coagulation (DIC) production.
Previous research has demonstrated that CEF caused acute toxicity to Daphnia magna after phototransformation, which may be related to the process of ROS generation.41) Here, we showed that mice in TTC30 and TTC60 groups exhibited increased levels of ROS. Based on previous studies, ROS is essential in the pathogenesis of acute pulmonary edema, and ROS can also trigger HPV.39,42–44) Therefore, we hypothesized that TTC mediated increases in ROS levels was the main cause of all of the changes in the symptoms. In a preliminary acute intraperitoneal toxicity study, we found that some mice in the TTC30 and TTC60 groups died 1 h after intraperitoneal administration (data not shown). This rapid death may be the main reason why no significant pathological changes in other organs were caused by ROS.
To summarize, TTC caused oxidative stress and increased ROS levels, resulting in pulmonary congestion and further development of pulmonary edema. Then, pulmonary edema produced HPV and pulmonary hypertension and further triggered blood circulation disorders. Circulatory disorders resulted in reduced blood flow velocity, which subsequently induced coagulation and prolonged coagulation time. These changes led to the production of DIC, which eventually caused death in mice. However, the mechanism by which TTC caused elevated ROS levels remains unclear.
The impact of antibiotics residue in animal-derived foods on public health has been a global concern. Residual antibiotics could cause adverse effects on the human body and antibiotic-resistant issues even upon exposure to low concentrations of antibiotics.14,45) Exposure to some types of antibiotics is associated with an increased risk of obesity in school children and severe dysglycemia among diabetic patients.46,47) Cooking is an important method that eliminates residual antibiotics.48,49) The degradation of β-lactam antibiotics is temperature dependent, and the relative degradation percentages were inversely proportional to initial concentration.16,50) CEF is a heat-labile antibiotic20) that could be eliminated by cooking. Previously, Junza et al. reported that a single product resulting from β-lactam ring cleavage, namely, ceftiofur-aldehyde, was produced after CEF was dissolved in water or milk during high temperature treatment.51) In our previous study, ceftiofur-aldehyde was confirmed to be the only degradation byproduct of CEF, and the relative content of ceftiofur-aldehyde in TTC30 and TTC60 was approximately 10.03 and 12.20%, respectively, which suggested that a relatively low proportion of ceftiofur-aldehyde could result in more serious tissue damage than CEF.21) Thus, the toxicity of residual TTC in animal-derived food may pose a potential threat to human health and pose a risk to food safety.
Conclusion
Our data indicated that thermal treatment can enhance the toxicity of CEF in vivo. In mouse acute oral toxicity assays, TTC induced hepatocyte mitochondrial damage, hepatocyte steatosis and hypercholesterolemia. In acute intraperitoneal toxicity assays, TTC caused increased levels of ROS, which led to pulmonary congestion, prolonged coagulation time, and ultimately mouse death.
Acknowledgments
This work was supported by the National Key Research and Development Program of China (Grant No. 2018YFD0500504) and the National Natural Science Foundation of Jilin Province, P. R. China (Grant No. 20170101035JC).
Author Contributions
Hong Zhang, Shiying Lu and Zengshan Liu designed the study and wrote the manuscript; Hong Zhang, Ke Zhao, Yansong Li, Yuting Guan, Hanxiao Li and Yu Zheng performed the experiments; Hong Zhang, Honglin Ren and Pan Hu analyzed the data.
Conflict of Interest
The authors declare no conflict of interest.
Supplementary Materials
The online version of this article contains supplementary materials.
References
- 1) Mathew A. G., Cissell R., Liamthong S., Foodborne Pathog. Dis., 4, 115–133 (2007).
- 2) Van Boeckel T. P., Brower C., Gilbert M., Grenfell B. T., Levin S. A., Robinson T. P., Teillant A., Laxminarayan R., Proc. Natl. Acad. Sci. U.S.A., 112, 5649–5654 (2015).
- 3) Landers T. F., Cohen B., Wittum T. E., Larson E. L., Public Health Rep., 127, 4–22 (2012).
- 4) Cameron A., McAllister T. A., J. Anim. Sci. Biotechnol., 7, 68 (2016).
- 5) Hornish R. E., Kotarski S. F., Curr. Top. Med. Chem., 2, 717–731 (2002).
- 6) Espadamala A., Pereira R., Pallares P., Lago A., Silva-Del-Rio N., J. Dairy Sci., 101, 9608–9616 (2018).
- 7) Ganda E. K., Gaeta N., Sipka A., Pomeroy B., Oikonomou G., Schukken Y. H., Bicalho R. C., Microbiome., 5, 74 (2017).
- 8) Reppert E. J., Vet Clin N., Am-Food A., 31, 139–149 (2015).
- 9) Smith G. W., Gehring R., Riviere J. E., Yeatts J. L., Baynes R. E., Javma-J Am Vet Med A., 224, 1827–1830 (2004).
- 10) Han R., Li S., Wang J., Yu Z., Wang J., Zheng N., PLOS ONE, 12, e0187261 (2017).
- 11) Lin Z., Vahl C. I., Riviere J. E., Sci Rep., 6, 27907 (2016).
- 12) United States Department of Agriculture. “UNITED STATES National Residue Program for Meat, Poultry, and Egg Products.”: ‹https://www.fsis.usda.gov/wps/wcm/connect/d6baddf7-0352-4a0e-a86d-32ba2d4613ba/2018-redbook.pdf?MOD=AJPERES›, cited 10 May, 2019.
- 13) Baynes R. E., Dedonder K., Kissell L., Mzyk D., Marmulak T., Smith G., Tell L., Gehring R., Davis J., Riviere J. E., Food Chem. Toxicol., 88, 112–122 (2016).
- 14) Chen J., Ying G. G., Deng W. J., J. Agric. Food Chem., 67, 7569–7586 (2019).
- 15) Mitchell S. M., Ullman J. L., Teel A. L., Watts R. J., Sci. Total Environ., 466, 547–555 (2014).
- 16) Tian L., Khalil S., Bayen S., Crit. Rev. Food Sci. Nutr., 57, 3760–3770 (2017).
- 17) Cui C., Zhang X., Wang Y., Lu S., Lu H., Hui Q., Ahmad W., Cai Y., Liu X., Liu L., Shi F., Liu Y., Zhao K., Zhai F., Xiang Y., Hu P., Li Y., Ren H., Jin N., Liu Z., Chemosphere, 202, 757–767 (2018).
- 18) Roca M., Villegas L., Kortabitarte M. L., Althaus R. L., Molina M. P., J. Dairy Sci., 94, 1155–1164 (2011).
- 19) Ribeiro A. R., Lutze H. V., Schmidt T. C., Water Res., 134, 253–260 (2018).
- 20) Sunkara G., Navarre C. B., Kompella U. B., J. Pharm. Pharmacol., 51, 249–255 (1999).
- 21) Cullen W. R., Chem. Res. Toxicol., 27, 457–461 (2014).
- 22) Wang X. H., Lin A. Y. C., Environ. Sci. Technol., 46, 12417–12426 (2012).
- 23) Jiang M., Wang L., Ji R., Chemosphere, 80, 1399–1405 (2010).
- 24) Li X., Zheng W., Machesky M. L., Yates S. R., Katterhenry M., J. Agric. Food Chem., 59, 10176–10181 (2011).
- 25) Ribeiro A. R., Sures B., Schmidt T. C., Sci. Total Environ., 619, 866–873 (2018).
- 26) Malhi H., Guicciardi M. E., Gores G. J., Physiol. Rev., 90, 1165–1194 (2010).
- 27) Jones D. P., Lemasters J. J., Han D., Boelsterli U. A., Kaplowitz N., Mol. Interv., 10, 98–111 (2010).
- 28) Angrish M. M., Kaiser J. P., McQueen C. A., Chorley B. N., Toxicol. Sci., 150, 261–268 (2016).
- 29) Kaiser J. P., Lipscomb J. C., Wesselkamper S. C., Int. J. Toxicol., 31, 551–563 (2012).
- 30) Wong B. W., Wang X., Zecchin A., et al., Nature (London), 542, 49–54 (2017).
- 31) Dai J., Liang K., Zhao S., Jia W., Liu Y., Wu H., Lv J., Cao C., Chen T., Zhuang S., Hou X., Zhou S., Zhang X., Chen X. W., Huang Y., Xiao R. P., Wang Y. L., Luo T., Xiao J., Wang C., Proc. Natl. Acad. Sci. U.S.A., 115, E5896–E5905 (2018).
- 32) Lea W., Abbas A. S., Sprecher H., Vockley J., Schulz H., Biochim. Biophys. Acta, 1485, 121–128 (2000).
- 33) Houten S. M., Violante S., Ventura F. V., Wanders R. J., Annu. Rev. Physiol., 78, 23–44 (2016).
- 34) Yoon M., Pharmacol. Res., 60, 151–159 (2009).
- 35) Jeong S., Kim M., Han M., Lee H., Ahn J., Kim M., Song Y. H., Shin C., Nam K. H., Kim T. W., Oh G. T., Yoon M., Metabolism, 53, 607–613 (2004).
- 36) Jeong S., Yoon M., Obesity (Silver Spring)., 15, 1430–1440 (2007).
- 37) Lawley J. S., Alperin N., Bagci A. M., Lee S. H., Mullins P. G., Oliver S. J., Macdonald J. H., Ann. Neurol., 75, 890–898 (2014).
- 38) Moniaga N. C., Griswold C. A., Aviat. Space Environ. Med., 80, 485–488 (2009).
- 39) Sommer N., Strielkov I., Pak O., Weissmann N., Eur. Respir. J., 47, 288–303 (2016).
- 40) Savale L., Weatherald J., Jais X., Vuillard C., Boucly A., Jevnikar M., Montani D., Mercier O., Simonneau G., Fadel E., Sitbon O., Humbert M., Eur. Respir. Rev., 26, 170092 (2017).
- 41) Ribeiro A. R., Sures B., Schmidt T. C., Sci. Total Environ., 619–620, 866–873 (2018).
- 42) Li P. C., Wang B. R., Li C. C., Lu X., Qian W. S., Li Y. J., Jin F. G., Mu D. G., Int. J. Mol. Med., 41, 2505–2516 (2018).
- 43) Liu X. J., Chen Z. H., J. Transl. Med., 15, ••• (2017).
- 44) Korde A. S., Yadav V. R., Zheng Y. M., Wang Y. X., Free Radic. Biol. Med., 50, 945–952 (2011).
- 45) Boobis A., Cerniglia C., Chicoine A., Fattori V., Lipp M., Reuss R., Verger P., Tritscher A., Crit. Rev. Toxicol., 47, 885–899 (2017).
- 46) Wang H., Wang N., Wang B., Fang H., Fu C., Tang C., Jiang F., Zhou Y., He G., Zhao Q., Chen Y., Jiang Q., Environ. Int., 89–90, 204–211 (2016).
- 47) Chou H. W., Wang J. L., Chang C. H., Lee J. J., Shau W. Y., Lai M. S., Clin. Infect. Dis., 57, 971–980 (2013).
- 48) Katz S. E., Brady M. S., Food Biotechnol., 14, 147–171 (2000).
- 49) Canton L., Alvarez L., Canton C., Ceballos L., Farias C., Lanusse C., Moreno L., Food Addit Contam A., 36, 1055–1067 (2019).
- 50) Grunwald L., Petz M., Anal. Chim. Acta, 483, 73–79 (2003).
- 51) Junza A., Montane A., Barbosa J., Minguillon C., Barron D., J. Chromatogr. A, 1368, 89–99 (2014).