Abstract
Oiling-out is a unique phenomenon that the liquid phase is separated into two parts during crystallization. The emergence of new liquid phase changes the environment where crystals nucleate and grow, we call “mother phase,” because target material and impurities become distributed to each phase according to their own particular distribution ratios. In our previous study on crystallization of an intermediate compound with impurities (denoted Imp-A, -B, and -C), we found that when oiling-out was formed, incorporation of Imp-C was inhibited, because Imp-C was distributed to the mother phase less than Imp-A and -B. In this study, we explored the effect of EtOH solution composition on impurity profile of the crystallized product in oiling-out crystallization, and found that the low content of Imp-B in the EtOH solution, the higher content of Imp-C in the crystallized product. Our finding revealed that not only oiling-out but also Imp-B played a key role in inhibiting the incorporation of Imp-C into the crystals.
Introduction
In pharmaceutical manufacturing, a target material is commonly isolated and purified by crystallization from a reaction mixture.1,2) In order to ensure the patient safety, impurity levels in isolated active pharmaceutical ingredients (APIs) have to be strictly controlled.3,4) Controlling the impurities in intermediate compounds under the acceptable levels is also important, because these impurities can be changed in later chemical reaction steps and remain in the final API. In crystallization, the content of impurities in the crystallized product depends on locations where impurities are incorporated: surface adhesion/adsorption, liquid inclusions (pockets of liquid within the crystal), and incorporation into the crystal lattice.5) Therefore, it is important for purification strategy to know where the impurities locate. If they locate on the crystal surface, crystal wash may remove them efficiently. If they locate in crystals as liquid inclusions, modifications on process parameters, such as seeding, slow cooling or slow anti-solvent addition, may give the higher purified crystallized product. In the case of thermodynamical lattice incorporation, such as solid solutions, it can be challenging to achieve purification by parameter changing. In addition to the impurity locations, the environment where crystals nucleate and grow, we call “mother phase,” can affect the content of impurities in the crystallized product: the higher impurity contents in the mother phase, the lower purity of crystallized product may be obtained. If condition of the mother phase can be changed, the better purified (or worse purified) crystallized product may be obtained. The one of phenomenon to change the condition of mother phase is oiling-out. It is known that some compounds crystallize from solution via oiling-out, also called “de-mixing” or “liquid–liquid phase separation (LLPS).” Oiling-out is a unique phenomenon that the liquid phase is separated into two parts during crystallization.6–10) When the liquid phase is separated, the composition of the mother phase can change from that of the original single phase solution, because the compounds are distributed to each liquid phase by their own particular distribution ratio. According to literatures, oiling-out can hinder primary and secondary nucleation, stick to reactor walls, and cause high impurity integration in the crystallized product, because impurities can be concentrated in the solute rich phase.9) For these reasons, usually oiling-out is considered undesirable. Some researchers have reported that purifications of their target materials were achieved by avoiding oiling-out.11,12) However, if impurities are less distributed to the mother phase, oiling-out can be utilized as a purification method. In our previous study on an intermediate compound (2) of alectinib hydrochloride (1)13) (Fig. 1), we found that oiling-out can potentially contribute to its purification.14) In the manufacturing, compound 2 is synthesized by several chemical reactions, and Imp-A, -B, and -C are generated as side products. Imp-A, -B, and -C are the related compounds of 2, and they have different substituents or atoms. As shown in Table 1, Imp-C has higher polarity than Imp-A and -B. Compound 2 is crystallized from an EtOH–water system via oiling-out. In our previous study, we carried out crystallization using the prepared EtOH solution including compound 2 and these impurities as a quasi-process mixture, and found that when oiling-out was formed, incorporation of Imp-C was inhibited, because Imp-C was distributed to the mother phase less than Imp-A and -B.
Table 1. Properties of Compound
2 and Imp-A, -B and -C
| Compound | Different structure from 2 | State at room temperature | Solubility in EtOH–water system (mg/mL)a) | Distribution ratio in EA–water system | Relative retention time on HPLC |
|---|
| 2 | — | Solid | 1.6 | 6822 | 1.00 |
| Imp-A | Atom | Solid | 2.3 | — c) | 1.06 |
| Imp-Bb) | Additional electron withdrawing group | Oil | — | 69 | 0.88 |
| Imp-Cb) | Additional electron withdrawing group | Solid | 10.7 | 13 | 0.83 |
a) EtOH–water (10 : 3, v/v) at 20°C. b) Including tetra-alkyl ammonium. c) No peak was detected in the aqueous layer. EA: ethyl acetate.
To understand our oiling-out system more deeply, in this study we focused on the solution composition because it might affect the distribution of compound 2 and impurities between liquid phases, and impurity profile of the crystallized product might be changed. We prepared the EtOH solution, impurity content of which was adjusted, and analyzed the contents of impurities in the crystallized product. We found that the Imp-C content in the crystallized product increased as the Imp-B content in the EtOH solution was lowered. On the other hand, the Imp-B content in the crystallized product was not affected by the Imp-C content in the EtOH solution.
Experimental
MaterialsThe intermediate compound 2 was provided from the manufacturing at Chugai Pharmaceutical Co., Ltd. 2 included slight amounts of Imp-A, -B, and -C originally, and the purity was more than 98 area%. The ground crystals of 2 were used as seeds. Imp-B and -C for spiking with the EtOH solution were isolated from the mother liquors and rinse solutions of the crystallizations which were carried out in other experiments. Flash column chromatography isolated Imp-B as a sticky brown oil including approximately 0.4 equivalent (eq.) of tetraalkylammonium ion. Precipitation isolated Imp-C as a white solid including 1 eq. of tetraalkylammonium ion. EtOH, a rich-solvent, was provided from Imazu Chemical Co., Ltd. (Tokyo, Japan). Ultrapure water, an anti-solvent, was provided by a Milli-Q Integral 5 Water Purification System (Merck Millipore, Burlington, MA, U.S.A.).
Crystallization with/without Addition of ImpuritiesCrystallization process was operated by EasyMax 102, an automated batch reactor (Mettler Toledo, Columbus, OH, U.S.A.). Crystal and droplet behaviors were monitored by focused-beam reflectance measurement (FBRM) (ParticleTrack G400; Mettler Toledo) and particle vision and measurement (PVM) (PVM819; Mettler Toledo). An EtOH solution of 2 was prepared by adding 5 g of 2 to 50 mL of EtOH. The contents of Imp-B and -C in the EtOH solution were adjusted by spiking with the isolated Imp-B and -C. The impurity profiles of the EtOH solutions used are summarized in the Table of the section “Results and Discussion.” Impurity content of Exp. 6 was same as that of conditions in our previous study. Crystallization proceeded as shown in Fig. 2: The EtOH solution was stirred at 300 rpm by overhead stirrer at 60°C. 5 mL of water (the first addition) was added dropwisely by the dosing unit, and then the ground seeds (0.5 w%) were added. After 1 h aging at 60°C, 10 mL of water (the second addition) was added dropwisely by the dosing unit over a period of 0.5 h. After the slurry had be cooled to 20°C, the crystals were isolated by filtration with a Kiriyama Rohto glass funnel and filter paper. In order to remove the mother liquor completely from the obtained wet cake, crystal rinsing was carried out with 20 mL of EtOH–water mixture (3 : 2, v/v). The wet cake was dried in vacuo at 50°C and the crystallized product were submitted to HPLC analysis to obtained the impurity profile. Midway during the crystallization process (before and after the second water addition), the slurry was sampled and filtered by CHIBITAN-R, a centrifugal filtration unit (Merck Millipore, Burlington, MA, U.S.A.). The wet cake was rinsed with 200 µL of EtOH–water mixture (3 : 2, v/v). The impurity profiles of the obtained crystals were also analyzed by HPLC.
Investigation on Effect of Long Water Addition in Crystallization without Imp-B SpikingAn EtOH solution was prepared from 5 g of 2 and 50 mL of EtOH. Only Imp-C was spiked. The impurity profile of the EtOH solution is shown in the Table of the section “Results and Discussion.” The crystallization proceeded exactly as above except that the length of the second water addition was extended to 4 h. Impurity profiles of the crystallized product and the crystals which obtained midway during the crystallization process (before and after the second water addition) were analyzed by HPLC.
HPLC MethodImpurity profiles of the EtOH solutions and the crystals were analyzed by HPLC (Nexera; Shimadzu Co., Kyoto, Japan) under gradient conditions. Mobile phases, MeOH and water; additive, ammonium acetate (10 mM); Column, ODS C18 (4.6 × 50 mm, 3.5 µm; Waters Corporation, Milford, MA, U.S.A.); flow rate, 1 mL/min; wavelength, 210 nm. The content of each impurity (%) was calculated by (HPLC peak area of the impurity)/(HPLC peak area of 2) × 100.
Results and Discussion
Crystallization with/without Addition of ImpuritiesPVM detected droplets in all experiments (Fig. 3), indicating that oiling-out occurred under all conditions. Impurity contents and yields of the crystallized product under each condition are shown in Table 2. The content of Imp-A in the crystallized product was affected slightly by the contents of Imp-B and -C in the EtOH solution. Imp-B content in the crystallized product was not changed, even when Imp-C content in the EtOH solution was increased (Exp. 2, 3, 6). On the other hand, Imp-C content in the crystallized product was lowered as Imp-B content in the EtOH solution was increased (Exp. 4, 5, 6).
Table 2. Impurity Profiles and Yields of the Prepared EtOH Solutions of
2 and the Crystallized Product
| Exp. | EtOH solution of 2 | Crystallized product |
|---|
| Imp-A (%) a,b) | Imp-B (%) a,b) | Imp-C (%) a,b) | Imp-A (%) | Imp-B (%) | Imp-C (%) | Yield (%) |
|---|
| 1 | 1.4 | 0.42 | 0.17 | 0.98 | ND | ND | 93 |
| 2 | 1.4 | 9.7 | 0.16 | 1.13 | 0.46 | ND | 92 |
| 3 | 1.4 | 9.8 | 1.6 | 1.13 | 0.44 | 0.11 | 91 |
| 4 | 1.4 | 0.54 | 3.0 | 1.06 | ND | 0.25 | 93 |
| 5 | 1.4 | 5.2 | 3.1 | 1.09 | 0.23 | 0.22 | 92 |
| 6 | 1.4 | 9.8 | 3.0 | 1.08 | 0.44 | 0.20 | 90 |
a) Calculated as (HPLC peak area of the impurity)/(HPLC peak area of 2) × 100. b) Imp-A, -B, and -C came from spiking and contents in 2 originally. ND: not detected.
Figure 4 shows the contents of Imp-A, -B, and -C in the crystals measured at various stages during the crystallization process. The differences affected by impurity content in the EtOH solution were also observed impurity content in the crystals after the second water. Imp-B content in the crystals after the second water addition was not affected by Imp-C content in the EtOH solution. However, Imp-C content in the crystals after the second water addition increased as the Imp-B content in the EtOH solution decreased. In our previous study, Imp-C content in the crystals after the second water addition increased when oiling-out was suppressed by large amount of seeds, however, in this study, oiling-out was formed. Therefore, we assumed that these differences on impurity contents in the crystals resulted from differences in their contents in the mother phase: Imp-C content in the mother phase was increased when Imp-B content in the EtOH solution was lowered (Fig. 5). Our finding in the previous study that when oiling-out was formed, Imp-B was distributed to the mother phase more than Imp-C, supports our assumption.14) Imp-B may change the characteristics of the mother phase, such as polarity and concentration, and distribution of Imp-C to the mother phase may be lowered. As a result, more Imp-C can be distributed to the mother phase and be incorporated into the crystals when Imp-B content in the EtOH solution is lowered. On the other hand, Imp-C cannot affect the incorporation of Imp-B, because it was distributed less than Imp-B to the mother phase.
Distribution coefficients (DImp) of Imp-A, -B, and -C were calculated from the HPLC peak areas, presuming that Imp-A, -B, and -C and 2 all have the same molar absorbance coefficients5) (Table 3):
Furthermore, we calculated the relative distribution coefficients of Imp-B and -C against Imp-A, because distribution of Imp-A was also affected by contents Imp-B and Imp-C in the EtOH solution (Table 3):
Table 3. Distribution Coefficients and Relative Distribution Coefficients
| Exp. | Distribution coefficienta) | Relative distribution coefficientb) |
|---|
| Imp-A | Imp-B | Imp-C | Imp-B | Imp-C |
|---|
| 1 | 0.062 | — | — | — | — |
| 2 | 0.18 | 0.0021 | — | 0.012 | — |
| 3 | 0.19 | 0.0024 | 0.0039 | 0.012 | 0.020 |
| 4 | 0.12 | — | 0.0035 | — | 0.028 |
| 5 | 0.16 | 0.0021 | 0.0036 | 0.013 | 0.023 |
| 6 | 0.19 | 0.0026 | 0.0039 | 0.014 | 0.020 |
a) Calculated as (HPLC peak area of impurity per HPLC peak area of 2 in crystals)/(HPLC peak area of impurity per HPLC peak area of 2 in filtrate). b) Calculated as (distribution coefficient of Imp-B or -C)/(distribution coefficient of Imp-A).
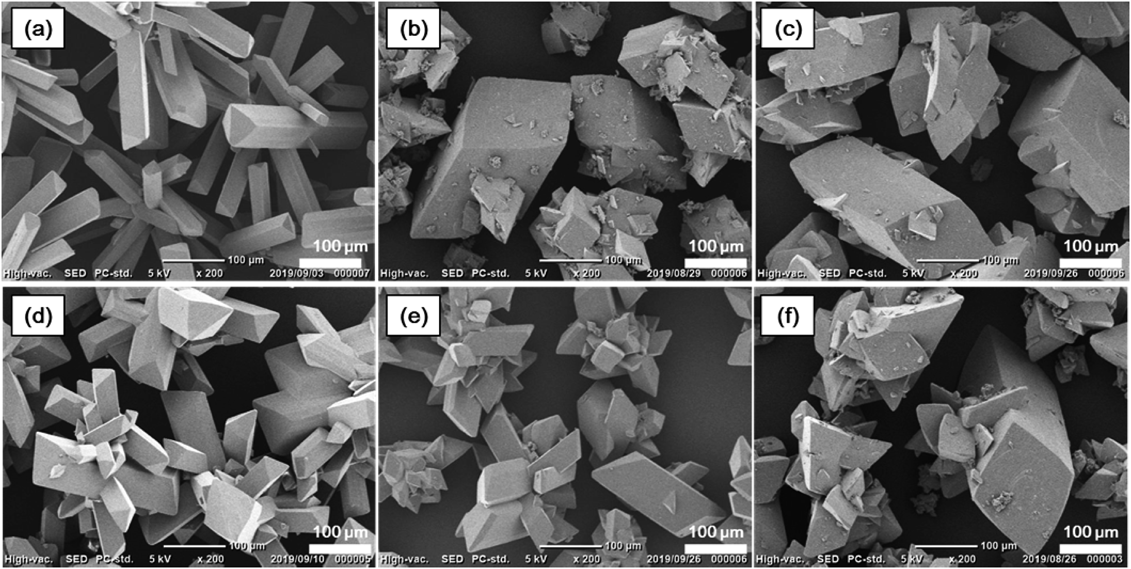
The relative distribution coefficients were plotted against Imp-B or -C content in the EtOH solution (Fig. 6). It is interesting to note that the relative distribution coefficients of Imp-C were negatively correlated with Imp-B content in the EtOH solution, on the other hand, the relative distribution coefficients of Imp-B were scarcely changed by Imp-B and -C in the EtOH solution. These results suggest that distribution of Imp-B affected by impurity contents in the EtOH solution similarly to Imp-A, however, distribution of Imp-C was not. These results might be caused by the findings in the previous study that Imp-A was also distributed to the mother phase more than Imp-C.14) SEM images of the crystallized product (Fig. 7) show that Imp-B and Imp-C can affect their morphologies, interestingly.
Investigation on Effect of Long Water Addition in Crystallization without Imp-B SpikingIn our previous study, where the EtOH solution included the same contents of Imp-A, -B, and -C as in Exp. 6, the longer second water addition time, the lower residual EtOH, the major solvent in the crystallization system, and the lower contents of Imp-A and Imp-B in the crystallized product.14) Because a part of Imp-A and Imp-B was incorporated into crystals as inclusions, when inclusions were lowered by the extending addition time, their contents were also lowered. On the other hand, Imp-C content in the crystallized product was not affected by the extended addition time, because Imp-C was less distributed to the mother phase, and it was rarely incorporated as an inclusion. If more Imp-C can be distributed to the mother phase by lowering Imp-B content in the EtOH solution, Imp-C can be incorporated as an inclusion. Furthermore, Imp-C content can be lowered by extending the length of the second water addition. To demonstrate our assumption, we extended the second water addition time from 0.5 to 4 h, using the EtOH solution with same contents of impurities as in Exp. 4 (condition without Imp-B spiking). As a result, Imp-C contents in the crystallized product and in the crystals after the second water addition were lowered (Table 4, Fig. 8). This result is consistent with our assumption that more Imp-C can be distributed to the mother phase and some of the Imp-C can be incorporated as inclusions when the EtOH solution includes a low content of Imp-B.
Table 4. Impurity Profiles and Yield of the Prepared EtOH Solution of
2 and the Crystallized Product
| Exp. | EtOH solution of 2 | Crystallized product |
|---|
| Imp-A (%) a,b) | Imp-B (%) a,b) | Imp-C (%) a,b) | Imp-A (%) | Imp-B (%) | Imp-C (%) | Yield (%) |
|---|
| 7 | 1.4 | 0.53 | 3.0 | 0.98 | ND | 0.19 | 92 |
a) Calculated as (HPLC peak area of the impurity)/(HPLC peak area of 2) × 100. b) Imp-A, -B, and -C came from spiking and contents in 2 originally.
Conclusion
In this study, we explored the effect of EtOH solution composition on impurity profile of the crystallized product in oiling-out crystallization. We found the following: (a) Imp-B contents in the crystallized product and the crystals after second water addition were scarcely changed by Imp-C content in the EtOH solution; (b) Imp-C contents in the crystallized product and the crystals after second water addition were increased as Imp-B content in the EtOH solution was lowered; and (c) when using an EtOH solution with a low Imp-B content, extending the length of the second water addition lowered the Imp-C content in the crystallized product, in contrast to the results of our previous study where it did not affect the Imp-C content.14) Our findings suggest that content of Imp-B, which was distributed in the mother phase more than Imp-C, in the EtOH solution can affect distribution of Imp-C to the mother phase. For that reason, when Imp-B in the EtOH solution is low, more Imp-C can be distributed to the mother phase and incorporated partially in the crystals as liquid inclusions. To conclude, in our crystallization system, not only oiling-out but also Imp-B played a key role in inhibiting the incorporation of Imp-C into the crystals.
Acknowledgments
We would like to thank Dr. Kenji Maeda and Mr. Satoru Arimoto for their kind support. We also thank all of the project members.
Conflict of Interest
The authors declare no conflict of interest.
References
- 1) Tung H.-H., Org. Process Res. Dev., 17, 445–454 (2013).
- 2) Tung H.-H., Paul E. L., Midler M., McCauley J. A., “Crystallization of Organic Compounds: An Industrial Perspective,” 1st ed., Wiley, Hoboken, NJ, 2009.
- 3) ICH Q3A(R2), Step 4, October 2006, International Conference on Harmonisation, Geneva, 2006.
- 4) Moynihan H. A., Horgan D. E., Org. Process Res. Dev., 21, 689–704 (2017).
- 5) “Crystallization: Basic Concepts and Industrial Applications,” ed. by Beckmann W., 1st ed., Wiley-VCH, Weinheim, Germany, 2013.
- 6) Bonnett P. E., Carpenter K. J., Dawson S., Davey R. J., Chem. Commun., 0, 698–699 (2003).
- 7) Veesler S., Lafferrère L., Garcia E., Hoff C., Org. Process Res. Dev., 7, 983–989 (2003).
- 8) Veesler S., Revalor E., Bottini O., Hoff C., Org. Process Res. Dev., 10, 841–845 (2006).
- 9) Derdour L., Chem. Eng. Res. Des., 88, 1174–1181 (2010).
- 10) Sun M., Tang W., Du S., Zhang Y., Fu X., Gong J., Cryst. Growth Des., 18, 6885–6890 (2018).
- 11) Lu J., Li Y.-P., Wang J., Li Z., Rohani S., Ching C.-B., Org. Process Res. Dev., 16, 442–446 (2012).
- 12) Du Y., Wang H., Du S., Wang Y., Huang C., Qin Y., Gong J., Fluid Phase Equilib., 409, 84–91 (2016).
- 13) Kinoshita K., Asoh K., Furuichi N., Ito T., Kawada H., Ishii N., Sakamoto H., Hong W. S., Park M.-J., Ono Y., Kato, Y., Morigami K., Emura T., Oikawa N., WO2010143664 A1 (2012).
- 14) Tanaka K., Takiyama H., Org. Process Res. Dev., 23, 2001–2008 (2019).