Regular Articles
Simple and Rapid Evaluation of the Unique Manuka Factor in Manuka Honey Using Fluorescence Fingerprints and Principal Component Analysis
2020 年 68 巻 8 号 p. 762-765
詳細
2020 年 68 巻 8 号 p. 762-765
The excellent antibacterial activity of manuka honey has been well-documented and is often evaluated according to the unique manuka factor (UMF) index. UMF is determined by an assay based on a bacterial culture, which is time-consuming and does not allow for quantitative analysis. This study developed a simple and rapid method for UMF evaluation using fluorescence fingerprints, principal component analysis (PCA), and partial least squares (PLS) regression. Manuka honey samples were diluted four times with water and fluorescence was observed at three wavelength combinations, namely 260–300 (excitation; ex) to 370 (emission; em) nm, 340 (ex) to 480 nm (em), and 440 (ex) to 520 nm (em), that are mainly attributed to lepteridine, leptosperin, 2-methoxybenzoic acid, and N-methyl phenazinium. Analyzing fluorescence fingerprints using PCA and PLS regression provided a reliable evaluation of the UMF in manuka honey and could be used to differentiate between manufacturers.
Honey produced from manuka trees (Lepospermum scoparium or Leptospermum polygalifolium) in New Zealand has exceptionally high antibacterial activity1–3) and was recognized as an approved medicine for wound care by the Food and Drug Administration (FDA) in 2008.4) The unique manuka factor (UMF) is an index developed for grading the antibacterial activity of manuka honey and is widely used by producers. UMF is determined by comparing the antibacterial activity of manuka with phenol solution, a common antiseptic solution used in hospitals, where UMF20+ manuka honey exhibits antibacterial activity similar to 20% phenol solution.5,6) Commercial manuka honey can be classified into four grades based on UMF (5+, 10+, 15+, and 20+) to determine a fair market price, where UMF20+ manuka honey is generally more than four times the price of UMF5+ manuka honey. However, UMF measurement is determined using a bacterial culture-based assay that is not suitable for quantitative analysis; this can cause difficulty in classifying UMF grade. Furthermore, the completion of the assay requires several days. Alternatively, HPLC and HPLC-MS may be used for the quantitative analysis of antibacterial compounds in honey.7–10) However, these techniques are complicated, evaluation is often time-consuming and laborious, and the instrumental and operating costs are high. Thus, a simple, rapid, and inexpensive analytical method for the determination of UMF in manuka honey would be extremely useful for the industry.
The fluorescence fingerprint (excitation/emission matrix) technique measures a fluorescence spectrum over a wide excitation and emission wavelength range. The current commercially available fluorescence spectrophotometers are capable of rapid fluorescence fingerprint acquisition, where the fingerprints of several 100 µL samples can be measured in 2 to 3 min by selectively detecting fluorescent compounds with high sensitivity.11) This technique is suitable for the analysis of matrix samples comprising multiple compounds and is therefore particularly applicable to food and environmental samples.12–14)
Honey is produced by bees during the digestion of nectar and the components within honey are highly dependent on the bee and the origin of the nectar. Previous studies have focused on distinguishing the production area and have performed fluorescence-based analysis of the active chemical components in honey.15,16) Combining fluorescent fingerprint with principal component analysis (PCA) has proven useful in the distinction of honey production areas.17,18) Since fluorescence fingerprint is effective for the analysis of the components and production areas of honey, we expected that UMF, which is an indicator of antibacterial activity specific to manuka honey, could also be evaluated by fluorescence fingerprint, however, no studies have reported the relationship between UMF and the fluorescence fingerprint. Hence, this study aimed to determine the UMF of manuka honey samples by analyzing fluorescence fingerprint data using PCA and partial least squares (PLS) regression.
Manuka honey samples from three manufacturers (Comvita, Manuka Health and Puriti) and with four UMFs (5+, 10+, 15+, and 20+) were kindly provided by Mr. T. Iwasaki et al., Medical Incubation System Co., Ltd. (Tokyo, Japan). Phenazine methyl sulfate (PMS) and 4-hydroxyphenyl lactic acid (HPLA) were obtained from Tokyo Chemical Industry Co., Ltd. (Tokyo, Japan). Leptosperin (LS) was purchased from Healthcare Systems Co., Ltd. (Aichi, Japan). Hydrogen peroxide (H2O2), dihydroxyacetone (DHA), glucose (Glu), and fructose (Fru) were purchased from Wako Pure Chemical Corporation, Ltd. (Osaka, Japan). Methylglyoxal (MGO), 3-phenyl lactic acid (PLA), 2-methoxyacetophenone (MAP), 2-methoxybenzoic acid (MBA) and hydroxymethyl furfural (HMF) were purchased from Sigma-Aldrich (St. Louis, MO, U.S.A.).
Sample PreparationThe high viscosity of honey samples was reduced by diluting 2 g of honey with water to a volume of 4 mL, equivalent to a approx. 2-fold dilution. The solution was sonicated for 5 min and diluted with water to produce a range of samples with total dilution ratios of 2, 2.5, 4, 10, 20, and 200. A 400 µL upper layer was transferred to a 96-well microplate for fluorescence fingerprint analysis.
Fluorescence AnalyzesThe fluorescence fingerprints were measured at room temperature (around 20°C) using a fluorescence spectrometer (F7100, Hitachi High-Technologies Corporation, Tokyo, Japan). The emission spectra were recorded in the range of 250 to 600 nm with a 10 nm interval. The scan speed and slit width were 60000 nm/min and 5 nm, respectively.19) The SpectAlyze software package (Dynacom, Ciba, Japan) was used to conduct PCA, PLS analysis, and parallel factor analysis.
The fluorescence fingerprints of UMF20+ manuka honey at various dilution ratios are shown in Fig. 1, where warmer shading (red) indicates strong fluorescence intensity, cooler shading (blue) indicates weak intensity, and white areas were masked due to first- and second-order Rayleigh and Raman scattering. Fluorescence signals (excitation-emission) were detected in three main spectral regions, specifically 260 (excitation; ex) to 370 nm (emission; em) (Region 1), 340 (ex) to 480 nm (em) (Region 2), and 440 (ex) to 520 nm (em) (Region 3). Regions 1 and 2 corresponded to the fluorescence signals of two specific marker compounds in manuka honey, LS and lepteridine (LD).15,20–24) Although the 2-fold dilution sample exhibited the strongest signal in Region 1, the 2.5-fold dilution sample exhibited the strongest signal in Region 2. The signal intensity and the relative standard deviation of the intensity (n = 3) in Region 2 were investigated (Table 1) because Region 2 exhibited strong fluorescence signals across all samples. The signal from the 2.5-fold dilution sample was the strongest of all the samples despite the higher concentration of honey in the 2-fold dilution sample. The concentration of the honey in the 2-fold dilution sample was potentially too high, resulting in saturation of the spectral response. While the signal intensity of the 2.5-fold dilution sample was high, the reproducibility of the signal was low and not suitable for quantitative analysis. The signal intensity reproducibility of the 4-fold dilution sample was acceptable and exhibited a stronger signal than the more diluted samples (10-, 20-, and 200-fold). Thus, the 4-fold dilution sample was used in further experiments.

| Dilution ratio | Signal intensity | RSD |
|---|---|---|
| 2 | 2560 | 3.1 |
| 2.5 | 4960 | 13 |
| 4 | 4190 | 2.9 |
| 10 | 3520 | 3.2 |
| 20 | 3100 | 5.7 |
| 200 | 2450 | 7.1 |
The fluorescence fingerprints of UMF5+ honey from three manufacturers (Fig. 2) exhibited the same three strong fluorescence signals observed in the UMF20+ samples (Fig. 1). However, the signal intensities and ratios were different for each sample. Although the fingerprints from manufacturers A and C were similar, the samples from manufacturer B exhibited strong fluorescence signals across a wider area. These results indicate that fluorescence fingerprints can be used to differentiate between manufacturers.

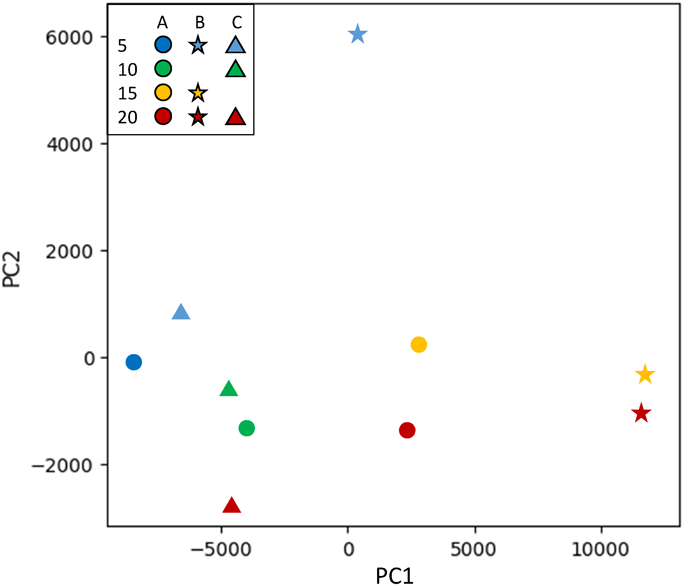
PCA was used to explore the correlated variations between the many variables within the fluorescence fingerprints of 10 manuka honey samples from three manufacturers (manufacturers A, B, and C) and with four UMFs (5+, 10+, 15+, and 20+). The score plot for principal components (PC) 1 and 2 exhibited even distribution of samples (Fig. 3). The samples from manufacturers A and C were distributed to the bottom left, while the samples from manufacturer B were distributed to the right half, indicating that separation based on manufacturer is possible using PCA. By examining the fluorescence fingerprints of samples from a single manufacturer, separation based on differences in UMF was observed. Samples with a higher UMF had higher PC 1 and lower PC 2 score values were consequently projected in the lower right region of the PC 1 vs. PC 2 score plots, regardless of manufacturer (Fig. 3). Thus, honey with different UMF values from a single manufacturer can be distinguished using PCA.
The excitation and emission wavelengths with large factor loadings by parallel factor analysis are given in Figs. 4a and 4b, where the ranges 340 to 480, 260 (300) to 370, and 440 to 520 nm correspond to Regions 2, 1, and 3 in Fig. 1, respectively. Twelve major chemicals (LS, MGO, PLA, HPLA, N-methyl phenazinium (NMP), MAP, MBA, H2O2, HMF, DHA, Glu, and Fru) attributed to the antibacterial activity of honey were investigated to establish which chemical components gave rise to the fluorescence signals in these areas. The fluorescence fingerprint of each chemical was measured at three concentrations, 0.01, 0.1, and 1 mM. Seven of these chemicals (MGO, PLA, HPLA, H2O2, HMF, DHA, and Fru) did not exhibit fluorescence in this concentration range and the fluorescence fingerprints of the remaining five chemicals (LS, MBA, MAP, NMP, and Glu) are shown in Supplementary Fig. 1. The fluorescence signal of LS was the largest, followed by MBA, MAP, NMP, and Glu, and the corresponding excitation and emission wavelengths were 260 (ex) to 370 (em), 300 (ex) to 380 (em), 340 (ex) to 430 (em), 340 (ex) to 520 (em), and 340 (ex) to 440 (em) nm, respectively. The fluorescence spectra of LS and MBA corresponded to Region 1 and the excitation wavelength of LS was slightly shorter than that of MBA. The fluorescence spectra of MAP, Glu, and NMP corresponded to Region 2, where the emission wavelengths of MAP and Glu were shorter than LD and the emission wavelength of NMP was longer than LD. The fluorescence spectrum of NMP was also observed in Region 3 (Fig. 4c). Although more than one ingredient (MAP, Glu, LD, and NMP) exhibited fluorescence in Region 2, the fluorescence spectrum of LD best matched the fluorescence spectrum of Region 2. Thus, the main component contributing to the fluorescence spectrum in Region 2 was LD. PCA revealed that the manufacturer and UMF can be distinguished based on the quantity or ratio of LD, LS, MBA, and NMP in a manuka honey sample.

The fluorescence fingerprints of samples from a single manufacturer were used to calibrate a PLS regression model for predicting UMF. The 11 cross symbols shown in Fig. 5 are from a PLS regression model using 11 different lots of honey (three lots of each of 5+, 10+, and 20+, and two lots of 15+). The fingerprints of three manuka honey samples from different lots from the same manufacturer with UMFs of 5+, 10+, and 20+ were predicted to be 5.7, 9.1, and 22, respectively, as shown by the circle symbols in Fig. 5. This result demonstrates the good correlation between the fingerprint and the unknown UMF value and indicates that the UMF of a honey sample from a single manufacturer can be reliably determined based on the fluorescence fingerprint.

Eleven crosses and three circles correspond to the models and samples, respectively. The dotted line corresponds to the calibration curve.
This study revealed that the fluorescence fingerprints of manuka honey samples are useful tools for evaluating the manufacturer and UMF of the sample. The manufacturers were distinguished using PCA, while UMF was quantified using PLS. The separation of honey samples obtained from different manufacturers and with different UMF values was driven by the quantity or ratio of four chemical components, namely LD, LS, MBA, and NMP. This method provided a simple, rapid, and cost-effective prediction of UMF, and shows potential for implementation as a UMF screening method during the manufacture and marketing of manuka honey. Therefore, we expect that UMF can be more accurately and more easily evaluated by this method, which we expect will contribute to improving of the quality of manuka honey.
We thank Comvita for providing information of UMF. We would like to thank Mr. T. Yoshie for useful discussions of manuka honey. This work was supported by grants (Kakenhi) from the Ministry of Education, Culture, Sports, Science, and Technology (MEXT) of Japan, and JSPS Core-to-Core Program, A. Advanced Research Networks.
The authors declare no conflict and interest.
The online version of this article contains supplementary materials.