Abstract
Owing to occasional health damages caused by health food products derived from Pueraria mirifica (PM), the Japanese government has designated PM as an “ingredient calling for special attention.” Miroestrol is a specific isoflavone isolated from PM and possesses very strong estrogenic activity enough to induce side effects in small amount. Therefore, routine analyses for miroestrol quantification is recommended to control the safety and quality of PM products. However, miroestrol content in PM is quite low, and commercial reagent for its detection is rarely available. In this study, we developed a quantitative analysis method for miroestrol in PM without using its analytical standard by using the relative molar sensitivity (RMS) of miroestrol to kwakhurin, another PM-specific isoflavone, as a reference standard. The RMS value was obtained by an offline combination of 1H-quantitative NMR spectroscopy and a LC/photo diode array (PDA) and miroestrol content was determined by single-reference LC/PDA using RMS. Furthermore, we investigated miroestrol content in commercially available PM crude drugs and products, and the RMS method was compared with the conventional calibration curve method in terms of performance. The rate of concordance of miroestrol contents determined by two method was 89–101%. The results revealed that our developed LC/PDA/MS method with RMS using kwakhurin as a reference standard was accurate for routine monitoring of miroestrol content in PM crude drugs and products to control their quality.
Introduction
Pueraria candollei Wall. ex Benth var. mirifica (Airy Shaw and Suvat.) Niyomdham (commonly termed P. mirifica, PM) is a popular phytoestrogen-rich plant belonging to the Fabaceae family. Its tuberous roots, named White Kwao Keur, have been used in Thai traditional medicine for rejuvenation and for the treatment of menopausal symptoms. Notably, PM contains the unique phytoestrogens such as miroestrol (MIR), deoxymiroestrol (dMIR), and kwakhurin (KWA), as well as popular estrogenic isoflavones such as genistein, daidzein, and puerarin.1,2) Although its content in PM is low (<0.005%), MIR was found to have the considerably highest estrogenic activity (i.e., approximately 1000-fold stronger than that of genistein and daidzein). Subsequently, Ishikawa and colleagues isolated dMIR as an alternative and more active compound (approximately 10-fold stronger) than MIR and suggested that MIR was an artifact easily converted from dMIR by aerial oxidation.3) They also reported a quantitative analysis focusing on the more stable MIR and KWA as a marker compound for the standardization of PM.4) Although the total synthesis of MIR was previously reported by two research groups,5,6) a mass-producible method has not been realized because of its complicated structure requiring manipulation for stereoselective reaction and separation of structural isomers.
At present, there are many food products derived from PM in the global healthcare market claiming to have rejuvenating and antiaging effects, as well as potential to improve skin appearance, infertility, and menopausal disorders. However, more than 200 adverse events possibly caused by such products had been reported from 2012 to 2017 in Japan, and the Ministry of Health, Labour and Welfare (MHLW) has released a cautionary notice.7) Subsequently, MHLW has amended the Enforcement Regulation of the Food Sanitation Act to designate PM as one of four “designated ingredients calling for special attention” and required manufacturers to appropriately produce PM products and to properly manage its quality.8,9) To control the quality of PM products, identification of the characteristic marker compounds and quantification of the active compounds are essential. Several studies have reported conventional quantification methods for MIR and its derivatives in PM plants using HPLC4,10) and in PM dietary supplements using liquid chromatography/tandem mass spetrometry (LC/MS/MS).11) However, detection of MIR in PM may be difficult owing to its low content and the multiple interfering compounds in crude drugs or other ingredients in products. Additionally, not only analytical standards but also commercial reagent-grade MIR is hardly available for routine analysis. The lack of commercial reagents results in a bottleneck effect in the standardization of the quantification method for routine monitoring of MIR content in PM crude drugs and products.
Recently, Sugimoto and colleagues have developed a single-reference HPLC method with relative molar sensitivity (RMS) determined by off-line combination of 1H-quantitaive NMR (1H-qNMR) and LC/photo diode array (PDA) for quantitative analysis of analytes in natural products.12–16) A single reference standard is used as an internal standard in the 1H-qNMR and HPLC methods to calculate the RMS values of each targeted analyte in various samples. These values can be determined as analyte-specific factors from the response ratios obtained by HPLC and the molar ratios obtained by 1H-qNMR. Once the RMS value of analytes to the reference standard was determined by the reagent manufactures, the concentrations of the targeted analytes in natural products are able to be calculated using the external reference standard without a reliable standard and calibration curve. In fact, Masumoto et al. developed single-reference analysis of perillaldehyde in perilla herbs based on an indirect standard (3-(trimethylsilyl)-a-propanesulfonic acid-d6 sodium salt) for 1H-qNMR and a external reference standard (diphenyl sulfone) for RMS15) and the quantitative assay defined in the Japanese Pharmacopoeia is planning to be revised based on this method.17) Using this approach with RMS, we can propose a standard method for evaluating PM without using a MIR standard (Fig. 1). In this study, we employed KWA as a reference standard instead of an external reference standard for simultaneous confirmation of the characteristic peaks and quantification of MIR in PM crude drugs and products. We developed a single-reference LC/PDA/MS method with RMS for PM identification and for MIR quantification to evaluate the quality of PM crude drugs and products. MIR content in PM crude drugs and commercial products was determined by the RMS method using KWA as an internal reference standard, and the performance of the developed method was validated by comparison with the conventional absolute calibration curve method.
Results and Discussion
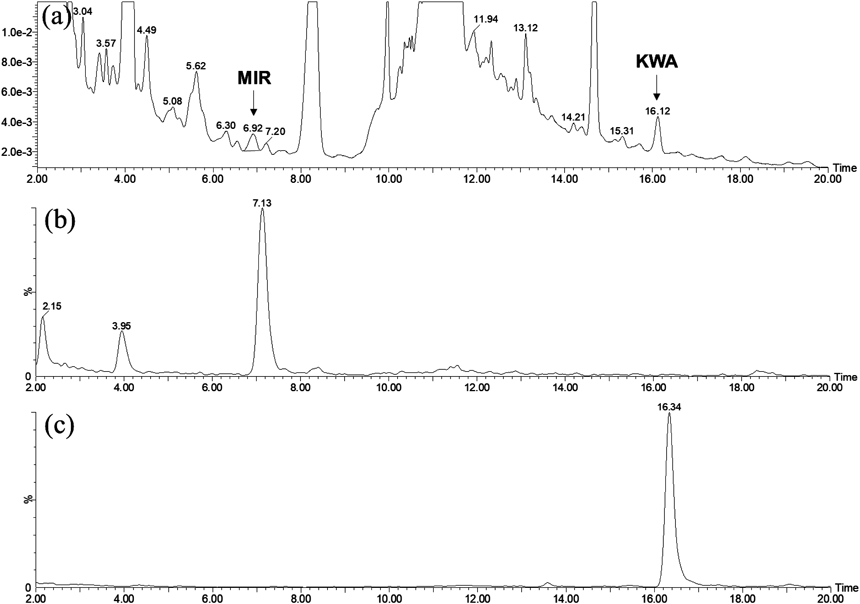
First, we established a repeatable LC method to identify the MIR peak using the relative retention time to KWA peak and determine the RMS. Isocratic LC conditions are usually developed for the RMS method to minimize the variance between LC instruments, but it was impossible to separate MIR, KWA, and numerous other components in PM rapidly and simultaneously under isocratic conditions because of their various physicality. Therefore, we adopted a stepwise UPLC system for the RMS method. Under the finalized condition within a 25-min analysis, MIR was detected at 6.9 min with absorption maxima at 214 and 285 nm, and KWA was detected at 16.0 min with absorption maxima at 218 and 291 nm (Figs. 2a–c). Thus, the relative retention time of MIR peak was determined as 0.43 to KWA peak. For reliable quantitative determination of an analyte using the single-reference method with RMS, it has been reported to be ideal to select the reference that has the same absorption maximum as the analyte for reducing the influence of differences in the absorption spectral resolution on the intensity of response from the detectors.18) Because the absorption curve of KWA was relatively shallow from 280 to 300 nm, the detection wavelength for the RMS method was set at 285 nm, the absorption maximum of MIR. The peaks of MIR and KWA were confirmed in the negative mass with the selected ion monitoring (SIM) mode as deprotonated molecules [M − H]− at m/z 357 and 367 (Figs. 2d, e). The purities of MIR and KWA used in this study was 98.71 ± 0.031 and 86.08 ± 0.122% by 1H-qNMR, respectively.
To confirm the linear range of the LC/PDA method, 10 points of calibration standards for MIR were analyzed, and a calibration curve was constructed based on the chromatographic peak areas. Clear linear trends with a correlation coefficient (R2) > 0.999 was achieved over a concentration range of 0.2–100 µg/mL. The limits of detection and quantification by the absolute calibration method were determined to be 0.004 and 0.0103 µg/mL, respectively.
To determine the exact RMS value of MIR to KWA, NMR mix std. was prepared at a concentration of 1 mg/mL and subjected to 1H-qNMR analysis (Fig. 3). As the quantitative signal used for 1H-qNMR, the objective signal should be well separated from other signals derived from the analyte, reference compound, and any impurities that may be present. The 1H-qNMR spectrum showed that position 2 signal from MIR (approximately 6.25 ppm) and position 2 signal from KWA (approximately 7.56 ppm) were well separated from other peaks. Therefore, they were applied as the objective peaks for the calculation of molecular ratios (Rn). The molecular ratio of MIR to KWA was determined to be 1.02737 with high accuracy (relative standard deviation (RSD) = 0.121%, Table S1).
To determine the applicable concentration range of RMS, LC mix std. solutions were prepared by diluting NMR mix std. at each concentration of MIR and KWA to 0.6, 3, and 15 µg/mL, and then analyzed. Although the RMS values of LC mix std. at 0.6 µg/mL slightly varied (RSD >3.5%), the invariance of the RMS values obtained from LC mix std. at the other concentrations was confirmed with enough accuracy (RSD <1.0%, Table 1). Therefore, the applicable concentration range of LC mix std. containing MIR and KWA was determined to be 3 to 15 µg/mL. For system suitability assay, LC mix std. solution at 3 µg/mL was injected six times, and the RMS value of MIR to KWA was determined as 0.2553. This RMS value was used for the subsequent quantitative analyses.
Table 1. Response Ratios and Relative Molar Sensitivities of
MIR to
KWA under Different Concentrations of LC Mix std.
| Concentration* (µg/mL) | | Measurement 1 | Measurement 2 | Measurement 3 | Average | RSD (%) |
|---|
| 0.6 | Rr | 0.22212 | 0.22474 | 0.23738 | 0.22808 | |
| RMS | 0.21620 | 0.21875 | 0.23106 | 0.22200 | 3.6 |
| 3 | Rr | 0.25936 | 0.26198 | 0.26052 | 0.26062 | |
| RMS | 0.25245 | 0.25500 | 0.25358 | 0.25368 | 0.51 |
| 15 | Rr | 0.26363 | 0.26244 | 0.26311 | 0.26306 | |
| RMS | 0.25660 | 0.25545 | 0.25610 | 0.25605 | 0.23 |
* Each concentration of MIR and KWA in LC mix std.
Before the quantitative analysis of real samples, detection of MIR and KWA peaks from PM crude drugs (PMC) and commercial products (PMP) were confirmed by LC/PDA/MS (Fig. 4). Among the crude drug samples, PMC-001, 004, and 005 contained both peaks, and these crude drug samples were considered to be derived from the correct species. In contrast, PMC-002 showed totally different chromatogram from the other samples’ pattern, and neither MIR nor KWA peaks were detected. This result indicated that PMC-002 was derived from wrong species. Because the chromatogram pattern of PMC-002 was similar to that obtained from the Red Kwao Keur derived from Butea superba, this species could be used for PMC-002 (data not shown). Thus, it was considered that MIR and KWA could be useful as species-specific marker compounds to discriminate PM (White Kwao Keur) from Red Kwao Keur. In the case of PMC-003, the KWA peak was not detected even under the SIM mode, but MIR peaks were identified on the UV and MS chromatograms. This sample was estimated to be derived from PM owing to the presence of MIR, but further investigation is needed to verify its original species.
Among the PM commercial products, PMP-001, 003, 004, and 005 showed both peaks at least under the SIM mode, and it was indicated that the correct species were used for these samples. On the contrary, PMP-002 showed totally different chromatogram from the other samples’ patterns, and only KWA peak was detected. It was considered that MIR and KWA content was quite low in this product, as PMP-002 was composed of three plant extracts, including PM extract, in a tablet form. Taken together, it was confirmed that the developed LC/PDA/MS method could apply to identify MIR and KWA in PM crude drugs and commercial products. Once the sample was analyzed by LC/PDA/MS, MIR peak was able to be detected by using relative retention time to KWA on LC/PDA for quantitative analysis. These results also indicated that the developed LC/PDA/MS method was useful to confirm the botanical origin of PM crude drugs and commercial products.
Furthermore, KWA content in PM crude drugs (PMC) and commercial products (PMP) were determined by the absolute calibration curve method using the LC/PDA data. The calibration curve for KWA was linear (R2 > 0.999) in the range of 0.1–100 µg/mL. The limit of quantification (LOQ) was 0.013 µg/mL, with signal to noise ratio (S/N) ≥10. The KWA content varied with a range of 0.35–5.36 µg/g in the crude drug samples (PMC-001 and PMC-004, Table S2). These values were in well accordance with the previously reported isolation yield (0.000762) and 0.0064–0.0067%10)). KWA content in the product samples was calculated to be in a range of 0.68–7.25 µg/g (Table S2). The peak of KWA obtained from PMP-003 was at the trace level. Because this is the first report of the quantification of KWA content in PMC and PMP, further investigations are needed to elucidate the effect of geographic and climatic factors on the biosynthesis and accumulation of KWA.
To validate the RMS method for MIR quantification, MIR content in PM crude drugs and commercial products was calculated by a single-reference LC/PDA method with RMS using KWA as a reference standard, and the value was then compared with that obtained by the conventional absolute calibration method (Table 2). First, MIR content was determined using the absolute calibration curve. The values were within a range of 15.12–31.83 µg/g in the four crude drugs. MIR content in the product samples was calculated to be in a range of 4.04–13.58 µg/g in PMP-001, 004, and 005. Subsequently, MIR content was determined by the RMS method using reference standards at three different concentrations. When 5 µg/mL KWA solution was used as a standard for the RMS method, MIR content were calculated to be in a range of 14.96–32.08 µg/g in crude drugs, and in a range of 3.61–25.19 µg/g in product samples (Table 2). These values correspond to 89–101% of the content values obtained by the calibration curve method. In fact, the difference in MIR content between these two methods was within up to 2% in the cases of PMC. Because the absolute calibration curve has y-axis intercept, errors on the quantitative values tend to be large at low concentrations. It is a possible reason why the difference between these two methods was larger in PMP than in PMC. The obtained quantification values were in well agreement with the previous results from PM raw materials (0.0022) and 0.004%10)) and with the concentration in PM dietary supplements previously determined by LC/MS/MS (7.6 to 27.7 µg/g11)). These results revealed that the single-reference method with RMS was suitable for quantitative assays of MIR in PM samples without using a MIR standard reagent.
Table 2.
MIR Content in
Pueraria mirifica Crude Drugs and Products Determined by the Single-Reference Method with Relative Molar Sensitivity Using
KWA Standard Solution at 5 µg/mL and That Determined by the Absolute Calibration Curve Method
| Sample ID | Labeled name | MIR content (µg/g)a) | Rate of concordance [%] |
|---|
| RMS method | Calibration curve method |
|---|
| PMC-001 | Powdered PM | 32.08 | 31.83 | 100.78% |
| PMC-002 | Powdered PM | ND | ND | |
| PMC-003 | White Kwao Keur | 18.21 | 18.29 | 99.55% |
| PMC-004 | White Kwao Keur | 23.22 | 23.18 | 100.16% |
| PMC-005 | White Kwao Keur | 14.96 | 15.12 | 98.95% |
| PMP-001 | Powdered PM | 13.38 | 13.58 | 98.55% |
| PMP-002 | Powdered PM extract and two other plant extracts | ND | ND | |
| PMP-003 | Powdered Pueraria spp. | Traceb) | Traceb) | |
| PMP-004 | Powdered PM | 25.19 | 25.11 | 100.34% |
| PMP-005 | Powdered PM | 3.61 | 4.04 | 89.38% |
a) Each value of the content (µg/g) is the average of three measurements for triplicate sample solutions. b) Detected only by SIM mass.
Conclusion
In this study, we developed a LC/PDA/MS method for the qualification and quantification of PM crude drugs and products using RMS of MIR to KWA. The applicable concentration range of LC mix std. containing MIR and KWA for RMS was determined from 3 to 15 µg/mL by off-line combination of 1H-qNMR and LC/PDA, and the RMS was determined as 0.2553. Next, we assayed five PM crude drugs and five PM products by LC/PDA/MS at qualitative and quantitative levels. We confirmed the botanical origin of samples by detecting MIR and KWA peaks on SIM chromatograms, and found that at least one sample from crude drugs was probably not derived from PM. MIR content in 10 samples was determined by the single-reference method with RMS using KWA as a reference standard and compared with that determined by the conventional absolute calibration method. The differences between the quantitative values obtained by the two methods were less than 2% in the crude drug samples and less than 11% in the product samples. The significant advantages of the developed single-reference method with RMS include cost-effectiveness and simplicity. Under the same analytical conditions as those used for the first RMS determination, the RMS can be considered the same value without re-analyses. Considering its sensitivity and reactivity to MIR, the LC/PDA/MS method was considered sufficiently accurate for routine monitoring of MIR content in PM crude drugs and products to control their quality. Notably, simultaneous identification and quantification was achieved in this study by using a species-specific internal compound as a reference standard without using a standard for analyte or a certified analytical standard. This approach can be applied to other plant materials and products to overcome the unavailability of reagent-grade analytes for routine analysis.
Experimental
Materials and ReagentsP. mirifica crude drugs were purchased from raw material suppliers in Japan and on a local market in Thailand. Commercial food products containing PM were purchased online from their Japanese manufactures in 2019. Details are shown in Table S3. Authentic MIR (C20H22O6, molecular weight (Mw) = 358.39) was kindly provided by Dr. Tsutomu Ishikawa, emeritus professor at Chiba University. KWA (C21H20O6, Mw = 368.39) was synthesized as previously reported.19) 1,4-Bis(trimethylsilyl)benzene-d4 (1,4-BTMSB-d4; C12H18D4Si2; Mw = 226.50; Code No. 024-17031; Lot. TWN2900; purity 99.9%), a certified reference material, was purchased from FUJIFILM Wako Pure Chemical Corporation (Osaka, Japan) and used as a reference standard for both chemical shift and qNMR measurements. Methanol-d4 (Lot. A0373436; deuteration rate 100.0 atom % D) was purchased from Acros Organics (NJ, U.S.A.). All other solvents of HPLC or LC/MS grade was purchased from Kanto Chemical Co., Inc. (Tokyo, Japan). An Ultra-Microbalance XPR2UV (Mettler Toledo, OH, U.S.A.) with a minimum reading of 0.0001 mg and a Multipette Xstream electric auto-pipette (Eppendorf, Hamburg, Germany) were used for accurate measurements of weight and volume.
Instruments and Parameters1H-qNMR analysis was performed for determination of the molar ratios of MIR/KWA using JNM-ECA600 (600 MHz; JEOL Ltd., Tokyo, Japan). The observed spectrum width was 20 ppm. A digital filter was used. The center of the spectrum was set at 5 ppm. The pulse width was set to the time at which a 90-degree pulse was obtained. Acquisition time, 4 s; digital resolution, 0.25 Hz; and delay time, 60 s. An auto FG shim was used for shim adjustment. The determination temperature was set at room temperature (20–30 °C). We performed 13C decoupling with MPF8. The dummy scan was performed twice, and the scan was performed 64 times. The determination was performed thrice in accordance with the internal standard method (AQARI: Accurate quantitative NMR with internal reference substance) to ensure that a S/N of the quantitative signal was 200 or higher. Purity Pro, manufactured by JEOL Ltd., was used for NMR data processing. The trimethylsilyl peak of the reference standard for qNMR (1,4-BTMSB-d4) was set at 0 ppm. Phase correction and baseline correction were performed manually. The integration range for each peak was determined using a manual method.
LC/PDA/MS analyses were performed using Acquity UPLC H-class coupled with Xevo TQD (Waters Co., MA, U.S.A.). An ACQUITY UPLC HSS C18 SB column (2.1 mm i.d. × 100 mm, 1.8 µm; Waters Co.) was used for chromatography at a flow rate of 0.3 mL/min and a column temperature of 55 °C. The mobile phase was composed of A (0.1% formic acid in water) and B (0.1% formic acid in acetonitrile) with a stepwise elution: 0–8 min, 10% B; 8–10 min, 15–27% B; 10–18 min, 27% B; 18.5–20 min, 98% B. A triple quadrupole mass spectrometer was operated with an electrospray ionization (ESI) source in the negative mode with a capillary voltage of 2.5 kV, and the cone voltage was set to 40 V. The desolvation and cone gas flow were set to 1000 and 50 L/h, respectively, and were obtained using a nitrogen source. The source temperature was set to 150 °C, and the desolvation temperature was set to 550 °C. Full-scan mass spectra were collected over the range m/z 100–1200, and SIM mass was collected using the target ions at [M − H]− m/z 357 for MIR and [M − H]− m/z 367 for KWA, respectively. All analyses and acquisitions were performed using the MassLynx 4.1 and TargetLynx 4.1 software (Waters Co.).
Determination of RMS of MIR to KWABriefly, 1.5 mg of MIR, 1.5 mg of KWA, and 1 mg of 1,4-BTMSB-d4 (reference standard for both chemical shift and qNMR) were accurately weighed in a same vial, and then dissolved in 1 mL of methanol-d4 to obtain a mixed standard solution (NMR mix std.). Using 1H-qNMR, the molar ratio (Rn) of MIR to KWA in NMR mix std. was calculated using the following equation:
where n is the mole number (mol), S is the average of 1H signal areas obtained by three measurements, and H is the number of 1H nuclei in one molecule contributing to S.
Next, the NMR mix std. was diluted 2500-, 500-, and 100-fold with methanol to obtain mixed standard solutions (LC mix std.) at low (each concentration of MIR and KWA was 0.6 µg/mL), medium (each concentration was 3 µg/mL), and high (each concentration was 15 µg/mL) concentrations, respectively, for LC/PDA/MS analysis. LC mix std. at medium concentration was injected six times to confirm the reproducibility of the peak areas of MIR and KWA under the measurement conditions shown above. The response ratio (Rr) of MIR to KWA in LC mix std. was determined as follows:
where A is the average of chromatographic peak areas obtained by six measurements at 285 nm.
The RMS of MIR to KWA is expressed by the following equation:
Determination of the Purity of KWA and MIRTo determine the purities of KWA and MIR, the NMR spectrum of NMR mix std. was analyzed and the trimethylsilyl peak of 1,4-BTMSB-d4 was set at 0 ppm. The purity of KWA was calculated using the following equation:
where S is the average of 1H signal areas obtained by three measurements, H is the number of 1H nuclei in one molecule contributing to the 1H signal area, M represents the molar mass (g/mol), W is the amount (mg) of compound weighed for NMR mix std., and PBTMSB is the certified purity of 1,4-BTMSB-d4 (%, w/w).
The purity of MIR was determined using the same method.
Preparation of Sample and Standard SolutionsIn brief, 0.4 g of each powdered sample was accurately weighed in a precipitation tube for centrifugal separation, dissolved in 2 mL of 80% methanol, and then sonicated for 15 min. After centrifugation, the supernatant was transferred to a volumetric flask, and 80% methanol was added to a final volume of exactly 2 mL. The resultant solution was filtered through a 0.45-µm Ultrefree-MC filter (Merck KGaA, Germany) and applied to the LC/PDA/MS system. Triplicate solutions for each sample were prepared, and each solution was injected three times. In addition, 1 mg of KWA was precisely weighed and dissolved in exactly 1 mL of methanol. This solution was then diluted 200-fold with methanol to obtain KWA standard solutions at a final concentration of 5 µg/mL.
Quantitative Determination of MIR by the Single-Reference Method with RMSSample and standard solutions were subjected to LC/PDA/MS. Using the peak areas of MIR in the sample solutions and those of KWA in the standard solutions at 285 nm, MIR content in each sample solution was determined as follows:
where A is the average of chromatographic peak areas obtained by three measurements, m is the mole weight, W is the amount (mg), V is the volume (mL), and PKWA is the determined purity of KWA (%, w/w).
Quantitative Determination of MIR by the Absolute Calibration MethodNext, 1 mg of MIR was precisely weighed and dissolved in exactly 1 mL of methanol and was diluted to 0.1, 0.2, 0.5, 1, 2, 5, 10, 20, 50 and 100 µg/mL as MIR calibration standards. These concentrations did not reflect the purity of MIR. Calibration standards were subjected to LC/PDA/MS, and the calibration curve was constructed based on the chromatographic peak areas. Subsequently, MIR content in each sample solution analyzed above was determined using the following equation:
where A is the average of chromatographic peak areas obtained by three measurements, Int and Slope are the intercept and slope of the calibration curve, respectively, W is the amount (mg), V is the volume (mL), and PMIR is the determined purity of MIR (%, w/w).
With the same procedure, the calibration curve of KWA was constructed, and KWA content in each sample solution analyzed above was determined.
Acknowledgments
We are grateful to Dr. Tsutomu Ishikawa for kindly providing authentic MIR. We also thank Dr. Naoko Sato-Masumoto for providing useful advice. This study was supported by a Grant from the Ministry of Health, Labour, and Welfare of Japan.
Conflict of Interest
The authors declare no conflict of interest.
Supplementary Materials
The online version of this article contains supplementary materials.
References
- 1) Cain J. C., Nature (London), 188, 774–777 (1960).
- 2) Chansakaow S., Ishikawa T., Sekine K., Okada M., Higuchi Y., Kudo M., Chaichantipyuth C., Planta Med., 66, 572–575 (2000).
- 3) Chansakaow S., Ishikawa T., Seki H., Sekine K., Okada M., Chaichantipyuth C., J. Nat. Prod., 63, 173–175 (2000).
- 4) Shimokawa S., Kumamoto T., Ishikawa T., Takashi M., Higuchi Y., Chaichantipyuth C., Chansakaow S., Nat. Prod. Res., 27, 371–378 (2013).
- 5) Ito F., Kumamoto T., Yamaguchi K., Ishikawa T., Tetrahedron, 65, 771–785 (2009).
- 6) Corey E. J., Wu L. I., J. Am. Chem. Soc., 115, 9327–9328 (1993).
- 7) Ministry of Health, Labour and Welfare, Japan. “Handling of health foods containing Pueraria mirifica” (No. 1-0713 of 2017 Notice of the director of the Food Safety Standards and Evaluation Division, Pharmaceutical Safety and Environmental Health Bureau, MHLW).: ‹https://www.mhlw.go.jp/file/06-Seisakujouhou-11130500-Shokuhinanzenbu/pueraria-letter_4.pdf›, cited 5 February, 2021.
- 8) Ministry of Health, Labour and Welfare, Japan. “Amendment of the Food Sanitation Act-Obligation to notify health damage incident caused by intake of their food products containing the designated ingredients or components.”: ‹https://www.mhlw.go.jp/content/000530354.pdf›, cited 5 February, 2021.
- 9) Ministry of Health, Labour and Welfare, Japan. “Designated ingredients stipulated by MHLW based on the provisions of Article 8, Paragraph 1 of the Food Sanitation Act. (No. 119 of 2020 Ordinance of MHLW).” ‹https://www.mhlw.go.jp/content/000614389.pdf›, cited 5 February, 2021.
- 10) Yusakul G., Putalun W., Udomsin O., Juengwatanatrkul T., Chiachantipyuth C., Fitoterapia, 82, 203–207 (2011).
- 11) Lee J. H., Kim J. Y., Cho S. H., Jeong J. H., Cho S., Park H. J., Baek S. Y., J. Chromatogr. Sci., 55, 214–221 (2017).
- 12) Kitamaki Y., Saito N., Yamazaki T., Otsuka S., Nakamura S., Nishizaki Y., Sugimoto N., Numata M., Ihara T., Anal. Chem., 89, 6963–6968 (2017).
- 13) Takahashi M., Nishizaki Y., Sugimoto N., Sato K., Inoue K., J. Chromatogr. A, 1555, 45–52 (2018).
- 14) Nishizaki Y., Sato-Masumoto N., Nakanishi A., Hashizume Y., Tandia M., Yamazaki T., Kuroe M., Numata M., Ihara T., Sugimoto N., Sato K., Shokuhin Eiseigaku Zasshi, 59, 1–10 (2018).
- 15) Masumoto N., Nishizaki Y., Maruyama T., Igarashi Y., Nakajima K., Yamazaki T., Kuroe M., Numata M., Ihara T., Sugimoto N., Sato K., J. Nat. Med., 73, 566–576 (2019).
- 16) Ohtsuki T., Matsuoka K., Fuji Y., Nishizaki Y., Masumoto N., Sugimoto N., Sato K., Matsufuji H., PLOS ONE, 15, e0243175 (2020).
- 17) Pharmaceuticals and Medical Devices Agency (PMDA), “JP drafts for public comments. (3 June, 2019).”: ‹https://www.pmda.go.jp/files/000229718.pdf›, cited 5 February, 2021.
- 18) Nishizaki Y., Sato-Masumoto N., Mikawa T., Nakashima K., Yamazaki T., Kuroe M., Numata M., Ihara T., Ito Y., Sugimoto N., Sato K., Food Addit. Contam. Part A, 35, 838–847 (2018).
- 19) Tsuji G., Yusa M., Masada S., Yokoo H., Hosoe J., Hakamatsuka T., Demizu Y., Uchiyama N., Chem. Pharm. Bull., 68, 797–801 (2020).