Abstract
For the quantitative analysis of phenolic compounds in beverage samples, a three-flow channel isocratic HPLC with electrochemical detection (3LC-ECD) system was devised using a column-switching technique. Phenolic compounds with significantly different hydrophobicity (the range of calculated log P: −0.77 to 3.02) were simultaneously measured to draw three chromatograms by the 3LC-ECD; the peaks of gallic acid (GA), protocatechuic acid (PCA), and gallocatechin (GC) were observed at electrochemical detector 1 (D1) within 42 min, the peaks of procyanidin B3 (B3), epigallocatechin (EGC), catechin (C), epicatechin (EC), procyanidin B2 (B2), ethyl gallate (Eg), and epigallocatechin gallate (EGCg) were observed at D2 within 50 min, and the peaks of epicatechin gallate (ECg), gallocatechin gallate (GCg), catechin gallate (Cg), propyl gallate (Pg), and resveratrol (RVT) were observed at D3 within 70 min. The relationships between the phenolic compound concentrations and their chromatographic peak heights gave good linearity with correlation coefficients of more than 0.998. The detection limits of the phenolic compounds by the 3LC-ECD ranged from 0.6 to 3.0 µg/L. Further, the phenolic compound concentrations of commercially available teas and wines were determined with a relative standard deviation (RSD) of less than 4.9% (n = 6), and their recoveries ranged from 91 to 109%. These results indicate that the 3LC-ECD system provided an accurate, precise, and specific determination of the phenolic compounds in beverages without affecting the matrices derived from these samples.
Introduction
Phenolic compounds, which are secondary metabolites of plants, affect the taste, flavor, and appearance of plant-derived beverages.1–5) Currently, the protective biological activities of phenolic compounds are focused on effects such as: anti-allergic, anti-biotic, anti-carcinogenic, anti-inflammatory, anti-oxidant, anti-thrombotic, anti-ulcerative, and vasorelaxing.6–15) Thus, to estimate the qualities and health-promoting properties of beverages, analytical methods for determining phenolic compounds will play an important role.15) As such, the quantitative analysis of phenolic compounds in beverages is challenging, because it requires a selective and sensitive detection method to obtain accurate and precise results without affecting the matrices derived from the samples. In addition, many kinds of phenolic compounds with significantly different hydrophobicity are present in beverages. For example, the phenolic compounds shown in Fig. 1 are mainly present in tea and wine, and the ranges of calculated log P value of these compounds are remarkably wide as shown in Supplementary Table S1. Thus, a suitable analytical method for the determination of phenolic compounds in beverages is selective, sensitive, and capable of covering a wide range of calculated log P values, enabling the simultaneous determination of phenolic compounds with significantly different hydrophobicity.
To accomplish the purposes mentioned above, gradient HPLC with UV detection (HPLC-UV), HPLC with photodiode array detection (HPLC-PDA), and liquid chromatography-tandem mass spectrometry (LC-MS/MS) systems have been devised and reported to determine phenolic compounds, and these methods have been applied to the field of beverage sample analysis.16–20) However, it would be difficult for HPLC-UV to determine low levels of phenolic compounds in beverage samples due to insufficient sensitivity and selectivity. Although LC-MS/MS systems have been widely applied to the high-sensitive determination of phenolic compounds in beverage samples, an LC-MS/MS system and its running costs are very expensive.
HPLC with electrochemical detection (HPLC-ECD) is an attractive and useful technique for determining phenolic compounds, which are electroactive species due to the hydroxy groups attached to the aromatic rings and being electrochemically oxidized on the working electrode.15,21) Furthermore, an HPLC-ECD has inherent advantages such as: simplicity, a broad linear measuring range, high sensitivity, good repeatability, and relatively low cost.22) So, various HPLC-ECD methods have been reported for determining phenolic compounds in foods and beverages.15,23–32) However, to the best of our knowledge, the application of HPLC-ECD methods for the simultaneous determination of phenolic compounds with significantly different hydrophobicity has been limited. In our literature review, there were no reported HPLC-ECD methods applicable to the simultaneous determination of gallic acid and catechin gallate in teas or gallocatechin and resveratrol in wines. The main reason would be that gradient elution interferes with the high-sensitive determination of redox compounds by HPLC-ECD. Because a change of the mobile phase composition on the working electrode surface by gradient elution enhances a large baseline drift, the sensitivity and repeatability in gradient HPLC-ECD are remarkably reduced.33,34) Thus, a gradient elution is inadequate to perform a high sensitive quantitative analysis by HPLC-ECD.
To overcome the above-mentioned disadvantages in HPLC-ECD, we devised multi-flow channel isocratic HPLC-ECD systems utilizing a column-switching technique for determining redox compounds with significantly different hydrophobicity. By these systems, the simultaneous determinations of various redox compounds were successfully performed by HPLC-ECD without a gradient elution. As a result, we have previously shown these systems to be useful for maintaining high sensitivity and saving measurement time in the quantitative analyses of caffeoylquinic acids, phenolic acids, tanshinones, and magnolosides in traditional Chinese medicines.35–37) The objective of the present study is an expansion of the practical utility of a multi-flow channel isocratic HPLC-ECD system in analyzing beverage samples. For this study, we fabricated a three-flow channel isocratic HPLC-ECD (3LC-ECD) system for determining 15 phenolic compounds (Fig. 1) with significantly different hydrophobicity (the range of calculated log P: −0.77 to 3.02, Supplementary Table S1) and demonstrate that the 3LC-ECD system provides a practical and useful method in the quantitative analyses of phenolic compounds in teas and wines.
Experimental
Reagents and ChemicalsGallic acid (GA, >95%), protocatechuic acid (PCA, >95%), propyl gallate (Pg, >95%), epigallocatechin (EGC, >98%), catechin (C, >98%), epicatechin (EC, >98%), epicatechin gallate (ECg, >98%), gallocatechin gallate (GCg, >98%), catechin gallate (Cg, >98%), and resveratrol (RVT, >95%) were purchased from FUJIFILM Wako Pure Chemical Corporation (Osaka, Japan). Epigallocatechin gallate (EGCg, >95%), gallocatechin (GC, >95%), procyanidin B3 (B3, >95%), and procyanidin B2 (B2, >98%) were obtained from Funakoshi (Tokyo, Japan). Ethyl gallate (Eg, >95%) was obtained from Tokyo Chemical Industry (Tokyo, Japan).
Apparatus and 3LC-ECD ConditionsA block diagram of the 3LC-ECD system is shown in Fig. 2. This system consists of a degasser (DG-34, Flom, Tokyo, Japan), three types of mobile phases (MP1–3), three intelligent pumps (P1–3, AI-12, Flom), a manual injector (Inj., 7725i, Rheodyne, Cotati, CA, U.S.A.) with 5 µL of a sample loop, two switching valve units (SV1-2, 405, Flom), a pre-column (C0, InertSustain AQ-C18 (30 × 1.0 mm, 3 µm, GL Science, Tokyo, Japan)), three analytical columns (C1, Develosil XG-C30M-3 (250 × 1.0 mm, 3 µm, Nomura Chemical, Aichi, Japan); C2 and C3, Develosil XG-C30M-3 (150 × 1.0 mm, 3 µm)), three electrochemical detectors (D1–3, LC-4C, BAS, Tokyo, Japan), and a recorder (TR-V1000, Keyence, Osaka, Japan). Columns, C0–3, were maintained at 35 °C in a column oven (CTO-10ASvp, Shimadzu, Kyoto, Japan). MP1 (acetonitrile–water–formic acid (3 : 97 : 0.5, v/v/v)), MP2 (acetonitrile–water–formic acid (10 : 90 : 0.5, v/v/v)), and MP3 (acetonitrile–water–formic acid (20 : 80 : 0.5, v/v/v)) were made to flow at a rate of 35 µL/min in each flow line. The detection potentials for monitoring the phenolic compounds in D1, D2, and D3 were set at +0.8 V, +0.9 V, and +0.9 V vs. Ag/AgCl, respectively.
Beverage Samples and Their Sample PreparationCommercial green tea, black tea, red wine, and white wine were purchased from a supermarket in western Tokyo. To determine the phenolic compounds in the green and black teas by an internal standard (IS) method, 0.1 mL of green or 0.25 mL of black tea were mixed with 50 µL of the mixed ISs (15 mg/L PCA as IS for D1, 5 mg/L Eg as IS for D2, 10 mg/L Pg as IS for D3). To determine the phenolic compounds in the red and white wines by an absolute calibration curve method, 0.2 mL of red or 1.0 mL of white wines were used to prepare the test solutions. Each sample was appropriately diluted with an acetonitrile-water-formic acid (3 : 97 : 0.5, v/v/v) mixture to prepare the test solution. The test solution was filtered through a 0.2 µm membrane syringe filter unit, and then 5 µL of the filtrate was injected into the 3LC-ECD system.
Results and Discussion
Construction of Flow Channels in the 3LC-ECD System for Each Phenolic CompoundBecause the appropriate separation of phenolic compounds (Fig. 1) has not been previously achieved by the use of previous multi-flow channel isocratic HPLC-ECD systems,35–37) we have newly fabricated a 3LC-ECD system by the use of two switching valve units in the flow line of an HPLC-ECD system. At first, to group the phenolic compound into three, we examined the chromatographic elution behaviors of phenolic compounds by isocratic LC-ECD using an InertSustain AQ-C18 (30 × 1.0 mm, 3 µm) and an acetonitrile–water–formic acid (3 : 97 : 0.5, v/v/v) mixture as a column and mobile phase, respectively. Usually, the use of a water-rich mobile phase such as acetonitrile-water (3 : 97, v/v) shortens an octadecylsilyl (ODS) column lifetime. To overcome this issue, we selected an InertSustain AQ-C18 column, which is designed to offer high ruggedness in reverse phase LC using water-rich mobile phases for achieving significant retention of hydrophilic compounds.38) Indeed, the column withstood about 600 h total flow time of the mobile phase under the present 3LC-ECD conditions. Thus, this column was useful to develop a robust 3LC-ECD system. According to the elution time from the column, phenolic compounds were divided to monitor each electrochemical detector in the 3LC-ECD system as follows: D1, GA, PCA, and GC; D2, EGC, C, EC, Eg, and EGCg; D3, ECg, GCg, Cg, and Pg.
Next, to determine the time for changing the flow way by SV1 and SV2, we examined the chromatographic elution behaviors of the phenolic compounds by the 3LC-ECD system without an analytical column, C1 and C2. As MP1 flowed into C0, GA, PCA, and GC were detected in D1 within 9.0 min after the injection of a phenolic compounds mixture, so the time for changing the flow way by SV1 was set at 9.0 min. Moreover, after SV1 was rotated at 9.0 min and MP2 was flowed into C0, EGC, C, Eg, EC, and EGCg were detected in D2 within 20.0 min, so the time for changing the flow way by SV2 was set at 20.0 min after sample injection.
During 0–9 min after sample injection, the flow lines in the 3LC-ECD system were kept as shown in Fig. 2A. The C0 was hyphenated with D1 via C1 in flow channel 1, and thus GA, PCA, and GC were eluted into C1 from C0 (Fig. 2A). Further, the flow line on SV1 was automatically changed at 9 min after sample injection. The C0 was hyphenated with D2 via C2 in flow channel 2, and thus EGC, C, Eg, EC, and EGCg were eluted into C2 from C0 (Fig. 2B). Finally, the flow line on SV2 was automatically changed at 20 min after sample injection. The C0 was hyphenated with D3 via C3 in flow channel 3, and thus GCg, ECg, Cg, and Pg were eluted into C3 from C0 (Fig. 2C). By use of the present flow channel construction, one of three different isocratic eluate conditions were kept on each electrochemical detector during the chromatographic measurements of the phenolic compounds. At 53 min after sample injection, the flow lines on SV1 and SV2 were recovered to the initial flow way as shown in Fig. 2A. When the initial flow way in 3LC-ECD was recovered, a ghost peak (about 5 min width) was appeared during baseline monitoring in D1. The appearance of this ghost peak was due to the increased pressure in flow channel 1 by the connection between C0 and C1. Thus, next test solution was injected 10 min after the initial flow way recovered. Considering the different hydrophobic properties of the analytes, we constructed the 3LC-ECD system, which made it possible to achieve sufficient separations of phenolic compounds at each electrochemical detector.
Optimization of the 3LC-ECD ConditionsAt first, to shorten the measurement time with sufficient separation, we optimized other 3LC-ECD conditions such as the analytical columns, mobile phase, flow rate, and column temperature.
Some reverse-phase columns (InertSustain C18 (GL Science), Capcell Pak C18 UG120 (Osaka Soda, Osaka, Japan), Develosil C30-UG-3 (Nomura Chemical), and Develosil XG-C30M-3 (Nomura Chemical)) were examined to see whether the separation of the phenolic compounds studied could be sufficiently performed within a short time. Because GA has strong hydrophilicity, this peak appeared close to the solvent peak on a chromatogram which was obtained from D1 in the 3LC-ECD system using C18 columns as C1. Therefore, we selected the C30 column, which is a more hydrophobic stationary phase compared to the C18 column. Finally, we selected the Develosil XG-C30M-3 column from the viewpoint of sufficient separations, symmetric peaks, and a short elution time of phenolic compounds. In addition, optimal water and acetonitrile ratios for MP1–3 were examined. The larger the component of acetonitrile, the shorter the elution of the analytes into each detector in the 3LC-ECD system. Three kinds of acetonitrile and water ratios (v/v), 3 : 97, 10 : 90, and 20 : 80 were found as the best selections for MP1, MP2, and MP3, respectively. By investigating the other chromatographic conditions, these mobile phases were made to flow at a rate of 35 µL/min in each flow line, and the temperature in the column oven was set at 35 °C.
Next, to determine the optimal detection potentials in D1–3, hydrodynamic voltammograms of the phenolic compounds were measured as shown in Fig. 3. The peak current heights of GA, PCA, and GC were elevated when the detection potential was set more positively, and each hydrodynamic voltammogram of GA, PCA and GC reached a maximum level at +0.8 V, +0.8 V, and +0.9 V vs. Ag/AgCl, respectively (Fig. 3A). At +0.9 V vs. Ag/AgCl, chromatographic baseline noise was slightly increased, and thus the detection potential in D1 was set at +0.8 V vs. Ag/AgCl based on the signal-to-noise ratio (S/N) of the peak current height. Figures 3B and C show hydrodynamic voltammograms of the analytes detected in D2 and 3, respectively. In a similar way, the detection potentials in both D2 and 3 were set at +0.9 V vs. Ag/AgCl, respectively. Using the 3LC-ECD system, the isocratic elution was kept on the working electrode surface in each ECD, and measurement conditions at each flow line and ECD were individually optimized to achieve sufficient separation and detection of each phenolic compound.
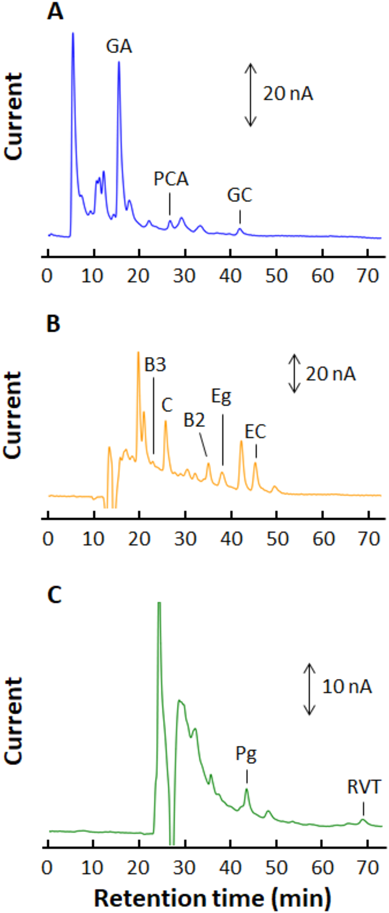
Quantitative Analysis Performance of 3LC-ECD for Phenolic CompoundsTo determine the phenolic compounds by IS methods, we selected PCA, Eg, and Pg as ISs for each flow channel 1, 2, and 3 in the 3LC-ECD, respectively. Under the 3LC-ECD conditions as described in “Apparatus and 3LC-ECD Condition,” the chromatographic peaks of GA, PCA, and GC were observed at 15.2, 25.6, and 40.2 min, respectively, as shown in Fig. 4A. In similar way, chromatographic peaks of EGC, C, Eg, EC, and EGCg were observed at 23.6, 25.2, 37.2, 44.5, and 47.9 min, respectively (Fig. 4B), and chromatographic peaks of GCg, ECg, Cg, and Pg were observed at 30.3, 36.1, 37.4, and 42.8 min, respectively (Fig. 4C).
Chromatographic peak heights of phenolic compounds were found to be proportional to their concentrations, and good linear relationships with correlation coefficients (r2) of more than 0.998 were found in the 3LC-ECD system as shown in Table 1. The repeatability (relative standard deviations (RSDs, %)) of chromatographic peak heights for standard phenolic compounds at 80 µg/L (except for EGC at 200 µg/L) ranged from 0.6 to 3.9% (n = 6). The detection limits (S/N = 3) of the phenolic compounds ranged from 0.6 to 3.0 µg/L as shown in Table 1. In the comparisons of EC detection, the detection limits of EC by HPLC-UV was 1.2 mg/L,17) while that by various LC-MS/MS systems ranged from 0.48 to 7 µg/L.18–20) However, the detection limit of EC by the 3LC-ECD was 1 µg/L, and thus it was thousand times more sensitive when compared with HPLC-UV. The sensitivity of 3LC-ECD was similar when compared with the LC-MS/MS. Because the 3LC-ECD saved instrumentation, maintenance, and running costs and electric power compared with an LC-MS/MS, the present method will have both environmental and economic advantages. In the quantitative analysis for phenolic compounds, we showed the 3LC-ECD was useful for keeping high sensitivity and saving measurement time without gradient elution.
Table 1. Linear Range and Detection Limit of 15 Phenolic Compounds by the 3LC-ECD System
| Flow channel | Analyte | Linear range (µg/L) | r2 | Detection limit (µg/L) |
|---|
| 1 | GA | 4–200 | 0.999 | 1.3 |
| PCA | 4–200 | 0.999 | 1.0 |
| GC | 10–600 | 0.999 | 3.0 |
| 2 | B3 | 2–200 | 0.999 | 0.6 |
| EGC | 10–400 | 0.999 | 1.3 |
| C | 2–200 | 0.999 | 0.6 |
| B2 | 4–200 | 0.998 | 1.0 |
| Eg | 4–200 | 0.999 | 1.0 |
| EC | 4–200 | 0.998 | 1.0 |
| EGCg | 8–600 | 0.999 | 2.5 |
| 3 | GCg | 8–200 | 0.998 | 2.5 |
| ECg | 6–200 | 0.999 | 2.0 |
| Cg | 6–200 | 0.999 | 2.0 |
| Pg | 4–200 | 0.999 | 1.0 |
| RVT | 4–80 | 0.998 | 1.0 |
In the green tea analysis, typical chromatograms obtained from each electrochemical detector in 3LC-ECD are shown in Fig. 5. The well-defined peak separations of phenolic compounds and three ISs (PCA, Eg, and Pg) were obtained with resolutions (RS) of more than 1.1, and this was enough for the quantitative analysis in HPLC by peak height measurements. The contents of the phenolic compounds in the green tea, along with recoveries of these analytes, are shown in Table 2. The RSDs of the contents of each phenolic compound were less than 4.9% (n = 6). The recoveries of phenolic compounds for the spiked test solutions ranged from 94.8 to 107.1%, and their RSDs were less than 4.0%. In a similar way, the phenolic compounds in the black tea sample were determined by the 3LC-ECD. A chromatogram from the black tea is shown in Supplementary Fig. S1, and the quantitative results are shown in Table 2. The RSDs of the contents of each phenolic compound were less than 3.0% (n = 6). The recoveries of the phenolic compounds for the spiked test solutions ranged from 90.9 to 108.5%, and the RSDs were less than 5.0% (n = 6).
Table 2. Contents of Phenolic Compounds in Beverages and Recoveries of Phenolic Compounds from Beverages Spiked with Their Standards
| Analyte | Content (n = 6) | Recovery (n = 6) |
|---|
| Measured concentration (mg/L) | RSD (%) | Spiked concentration (mg/L) | Recovery (%) | RSD (%) |
|---|
| Green tea |
| GA | 4.16 | 3.1 | 5.00 | 107.1 | 2.1 |
| GC | 188.88 | 1.6 | 188.88 | 96.6 | 2.4 |
| EGC | 77.86 | 4.9 | 85.00 | 105.9 | 4.0 |
| C | 11.40 | 1.3 | 11.40 | 99.0 | 3.1 |
| EC | 13.78 | 1.0 | 13.78 | 95.8 | 1.7 |
| EGCg | 117.32 | 4.1 | 117.32 | 106.8 | 1.9 |
| GCg | 105.01 | 3.4 | 105.01 | 105.8 | 3.6 |
| ECg | 9.18 | 2.0 | 9.18 | 97.7 | 3.1 |
| Cg | 10.05 | 2.3 | 10.05 | 94.8 | 2.4 |
| Black tea |
| GA | 12.90 | 1.6 | 12.20 | 90.9 | 2.2 |
| GC | 12.36 | 1.8 | 12.36 | 98.2 | 3.2 |
| EGC | 10.40 | 3.0 | 10.60 | 108.5 | 3.6 |
| C | 2.94 | 1.0 | 2.92 | 97.4 | 4.5 |
| EC | 6.03 | 0.9 | 5.80 | 91.3 | 1.6 |
| EGCg | 33.87 | 2.4 | 34.00 | 105.5 | 5.0 |
| GCg | 22.02 | 2.4 | 23.00 | 106.0 | 2.7 |
| ECg | 7.17 | 2.4 | 7.00 | 92.4 | 1.8 |
| Cg | 3.13 | 2.1 | 2.80 | 92.6 | 3.3 |
| Red wine |
| GA | 21.94 | 0.5 | 22.50 | 106.5 | 1.9 |
| PCA | 6.54 | 2.2 | 6.54 | 104.3 | 3.2 |
| GC | 4.31 | 2.7 | 4.50 | 101.0 | 4.4 |
| B3 | 2.49 | 4.6 | 2.50 | 103.7 | 3.0 |
| C | 11.25 | 1.1 | 11.25 | 108.1 | 1.5 |
| B2 | 17.09 | 2.2 | 17.09 | 94.2 | 1.5 |
| Eg | 11.71 | 1.6 | 11.71 | 100.4 | 2.5 |
| EC | 15.97 | 0.8 | 17.50 | 100.5 | 2.1 |
| Pg | 9.95 | 1.4 | 9.95 | 100.6 | 2.3 |
| RVT | 1.56 | 3.5 | 1.56 | 100.1 | 3.5 |
| White wine |
| GA | 0.36 | 3.8 | 0.38 | 103.4 | 2.9 |
| PCA | 2.18 | 1.0 | 2.30 | 99.3 | 2.1 |
| GC | 0.59 | 4.1 | 0.62 | 106.7 | 2.6 |
| C | 2.60 | 1.1 | 2.60 | 101.3 | 2.5 |
| B2 | 0.67 | 3.3 | 0.67 | 94.9 | 4.1 |
| EC | 1.96 | 1.7 | 1.96 | 97.7 | 4.5 |
| Pg | 0.26 | 1.7 | 0.26 | 96.1 | 4.1 |
| RVT | 0.22 | 4.3 | 0.22 | 100.0 | 4.9 |
The chromatogram in Fig. 6 was obtained following the injection of 5 µL of test solution from a red wine sample. On the chromatograms, peaks of B3, B2, and RVT were observed at 22.9 min in D2, 35.0 min in D2, and 69.0 min in D3, respectively, and thus these compounds were added as analytes. To determine RVT under the present 3LC-ECD conditions, the measurement times of the chromatograms in each flow channel were extended to 73 min, and then the flow lines on SV1 and SV2 were recovered to the initial flow way as shown in Fig. 2A. Moreover, because PCA, Eg, and Pg derived from red wine were also observed, the phenolic compounds were determined by an absolute calibration method. Typical chromatograms of phenolic compound standards for determining phenolic compounds in wines are shown in Supplementary Fig. S2. The linear ranges and detection limits of PCA, B3, B2, Eg, Pg, and RVT are also shown in Table 1. In a similar way, the phenolic compounds in the white wine sample were determined, and the chromatograms by the 3LC-ECD are shown in Supplementary Fig. S3. The contents of the phenolic compounds in the wine samples, along with the recoveries of these analytes are shown in Table 2. The RSDs of the contents of each phenolic compound were less than 4.6% (n = 6). The recoveries of the phenolic compounds for the spiked test solutions ranged from 94.2 to 108.1%, and the RSDs were less than 4.9%.
By the use of the 3LC-ECD system, the contents of GA and Cg in tea were simultaneously determined at each flow channel. In a similar way, the contents of GC and RVT in the wine were also simultaneously determined by the 3LC-ECD system. Although the test solutions for 3LC-ECD were prepared by dilutions of real samples, no peaks derived from impurities in real samples were observed on chromatograms after 53 and 73 min in the teas and the wines analyses, respectively. Thus, the measurement of a next chromatogram can be continued without procedures for the column washing. As such, we found that the 3LC-ECD provides accurate, precise, and specific determination of phenolic compounds in beverages, and the present method is practical and useful to avoid the effects of the matrices derived from the samples. The 3LC-ECD system is shown to have practical advantages for estimating both the qualities and health-promoting properties in the fields of food and/or beverage analyses.
Conclusion
The simultaneous determination of phenolic compounds, which have significantly different hydrophobic properties, was achieved by our 3LC-ECD system using a column-switching technique. Moreover, we demonstrated that the contents of the phenolic compounds in tea and wine samples were determined by the 3LC-ECD system using simple sample preparation procedures. In addition, this 3LC-ECD system avoided a loss of sensitivity using gradient elution, and thus the sensitivity of the present method was shown to be of a similar level in comparison with that of an LC-MS/MS.
Acknowledgments
Dr. Yuwen Sun, one of the authors, would also like to express her gratitude to the international exchange program between the China Academy of Chinese Medical Sciences and the School of Pharmacy, Tokyo University of Pharmacy and Life Sciences.
Conflict of Interest
The authors declare no conflict of interest.
Supplementary Materials
The online version of this article contains supplementary materials.
References
- 1) Cheynier V., Phytochem. Rev., 11, 153–177 (2012).
- 2) Soto-Vaca A., Gutierrez A., Losso J. N., Xu Z., Finley J. W., J. Agric. Food Chem., 60, 6658–6677 (2012).
- 3) Gao S., Hu M., Mini Rev. Med. Chem., 10, 550–567 (2010).
- 4) Murakami S., Takahashi S., Muguruma H., Osakabe N., Inoue H., Ohsawa T., Anal. Sci., 35, 529–534 (2019).
- 5) Tanaka T., Matsuo Y., Chem. Pharm. Bull., 68, 1131–1142 (2020).
- 6) Burns J., Gardner P. T., O’Neil J., Cawford S., Morecroft I., McPhail D. B., Lister C., Matthews D., MacLean M. R., Lean M. E. J., Duthie G. G., Crozier A., J. Agric. Food Chem., 48, 220–230 (2000).
- 7) Suganuma M., Rawangkan A., Wongsirisin P., Kobayashi N., Matsuzaki T., Yoshikawa H. Y., Watanabe T., Chem. Pharm. Bull., 68, 1123–1130 (2020).
- 8) Katanasaka Y., Miyazaki Y., Sunagawa Y., Funamoto M., Shimizu K., Shimizu S., Sari N., Shimizu Y., Wada H., Hasegawa K., Morimoto T., Biol. Pharm. Bull., 43, 675–681 (2020).
- 9) Tsai P. J., Wu S.-C., Cheng Y.-K., Food Chem., 106, 27–32 (2008).
- 10) Kuroda Y., Hara Y., Mutat. Res., 436, 69–97 (1999).
- 11) Bisht K., Wagner K.-H., Bulmer A. C., Toxicology, 278, 88–100 (2010).
- 12) Sano M., Suzuki M., Miyase T., Yoshino K., Maeda-Yamamoto M., J. Agric. Food Chem., 47, 1906–1910 (1999).
- 13) Sano S., Sugiyama K., Ito T., Katano Y., Ishihata A., J. Agric. Food Chem., 59, 6209–6213 (2011).
- 14) Hamauzu Y., Irie M., Kondo M., Fujita T., Food Chem., 108, 488–495 (2008).
- 15) Cortina-Puig M., Gallart-Ayala H., Lacorte S., Curr. Anal. Chem., 8, 436–455 (2012).
- 16) Zotou A., Frangi E., Chromatographia, 67, 789–793 (2008).
- 17) Tarola A. M., Giannetti V., Chromatographia, 65, 367–371 (2007).
- 18) Jeszka-Skowron M., Zgoła-Grześkowiak A., Frankowski R., J. Food Compos. Anal., 74, 71–81 (2018).
- 19) Wu R., Ma F., Zhang L., Li P., Li G., Zhang Q., Zhang W., Wang X., Food Chem., 204, 334–342 (2016).
- 20) Jin H., Tang G., Li J., Ma L., Li Y., Chang Y., J. Anal. Methods Chem., 2020, 8861765 (2020).
- 21) Makhotkina O., Kilmartin P. A., Anal. Chim. Acta, 668, 155–165 (2010).
- 22) Hensley K., Williamson K. S., Maidt M. L., Gabbita S. P., Grammas P., Floyd R. A., J. High Resolut. Chromatogr., 22, 429–437 (1999).
- 23) Ribeiro J. A., Fernandes P. M. V., Pereira C. M., Silva F., Talanta, 160, 653–679 (2016).
- 24) Yashin Y. I., Yashin A. Y., J. Anal. Chem., 59, 1121–1127 (2004).
- 25) Swartz M., J. Liquid Chromatogr. Relat. Technol., 33, 1130–1150 (2010).
- 26) Casella I. G., Colonna C., Contursi M., Electroanalysis, 19, 1503–1508 (2007).
- 27) Jandera P., Skerkova V., Rehova L., Hajek T., Baldrianove L., Skopova G., Kellner V., Horna A., J. Sep. Sci., 28, 1005–1022 (2005).
- 28) Alonso A. M., Dominguez C., Guillen D. A., Barroso C. G., J. Agric. Food Chem., 50, 3112–3115 (2002).
- 29) Kahoun D., Rezkova S., Veskrnova K., Kralovsky J., Holcapek M., J. Chromatogr. A, 1202, 19–33 (2008).
- 30) Bavol D., Scampicchio M., Zima J., Barek J., Dejmkova H., Electrochim. Acta, 281, 534–539 (2018).
- 31) Kolouchova-Hanzlikova I., Melzoch K., Filip V., Smidrkal J., Food Chem., 87, 151–158 (2004).
- 32) Novak I., Seruga M., Komorsky-Lovric S., Food Chem., 122, 1283–1289 (2010).
- 33) Ouchi K., Gamache P., Acworth I., Watanabe S., Biofactors, 22, 353–356 (2004).
- 34) Tian F., Zhu Y., Xie F., Long H., Duda C. T., Janle E. M., Kissinger P. T., J. Liquid Chromatogr. Relat. Technol., 25, 475–485 (2002).
- 35) Chen X., Kotani A., Hakamata H., Wang J., Du S., Kusu F., J. Chromatogr. A, 1256, 105–113 (2012).
- 36) Chen L., Kotani A., Kusu F., Wang Z., Zhu J., Hakamata H., Chem. Pharm. Bull., 63, 25–32 (2015).
- 37) Xue Z., Kotani A., Yang B., Hakamata H., J. Pharm. Biomed. Anal., 158, 166–173 (2018).
- 38) GL Sciences, “Reversed phased columns (C18 columns)”: ‹https://www.glsciences.com/product/lc_columns/c18_column/01712.html›, cited 21 August, 2021.