Regular Articles
Effect of the Physicochemical Properties of Liquid Paraffin on the Phase State and Rheological Properties of Lecithin Reverse Wormlike Micelles
2022 Volume 70 Issue 1 Pages 52-56
Details
2022 Volume 70 Issue 1 Pages 52-56
Lecithin reverse wormlike micelles (LRWs) have been studied recently for dermal application dosage use but the effects of the physicochemical properties of oils on the formation and rheological properties of LRWs have not been investigated. We studied the effect of oil on the formation of LRWs using 5 types of liquid paraffin (LP) with kinematic viscosities ranging from 4.00 to 88.0 mm2/s. Partial phase diagrams of lecithin/water/LP systems indicated that LPs with low molecular weights could form LRWs with only a small amount of water, but LPs with high molecular weights could not form LRWs, regardless of the water concentration. The solubility of lecithin in LPs was higher for low molecular weight LPs, thus possibly affecting the formation of LRWs. The zero-shear viscosity and relaxation time of LRWs initially increased with increasing water concentration, and then decreased. The water concentration providing the maximum value was dependent on the molecular weight of the LP, whereas the maximum amount and length of the LRWs were independent of the water concentration. Our results indicate that the molecular weight of LP affects the ease of formation and the viscoelasticity of LRWs.
Lecithin is an amphiphilic molecule composed of both hydrophilic and hydrophobic groups. Lecithin typically forms spherical or ellipsoidal reverse micelles when added alone to oil. However, when trace amounts of a polar compound (e.g., water) are added to this solution, lecithin reverse wormlike micelles (LRWs) are formed.
LRWs are highly viscoelastic bodies formed by the three-component lecithin/polar compound/oil system. Lecithin and the polar compound associate in oil to form long flexible cylindrical reverse micelles, which are entangled to form a three-dimensional (3D) network which holds a large amount of oil in the inter-micelle gaps.1) LRWs are prepared easily by stirring at room temperature and are thermodynamically stable. Various hydrophilic, lipophilic, low molecular weight and high molecular weight drugs, such as scopolamine,2) broxaterol,2) indomethacin,3) diclofenac,3) testosterone,4) and cyclosporine,5) have been solubilized in LRWs, suggesting that LRWs are potentially useful as transdermal dosage forms.6,7)
The polar compound is the key ingredient for the formation of LRWs. We have identified key ingredients that can be used as substitutes for water in the preparation of LRWs in n-decane, such as urea,8) sucrose fatty acid esters,9) D-ribose,10) 2-deoxy-D-ribose,10) polyglycerols,11) ascorbic acid,12) and multivalent carboxylic acids.13) The influence of amphiphilicity (i.e., hydrophile-lipophile balance) of the polar compound on the phase behavior and rheological properties of LRWs was previously investigated in detail.14) The other main component of LRWs is oil. A large variety of organic solvents such as linear and cyclic alkanes, fatty acid esters, and amines are effective for building LRWs.1) In contrast, there have been no detailed studies of the effect of the physicochemical properties of skin-applicable oils on the phase state and rheological properties of LRWs.
Liquid paraffin (LP, also called mineral oil) is a mixture of liquid hydrocarbons consisting of straight-chain, branched and ring structures with carbon chain lengths greater than C14 obtained from petroleum. LP has been used for many decades in external dosage forms and in skin and lip care cosmetic products due to its excellent skin tolerance, high protection and cleansing performance, and broad range of viscosities.15)
In this study, we investigated in detail the effect of the physicochemical properties of LP on the phase state and rheological properties of LRWs, using 5 types of LPs with kinematic viscosities between 4.00 to 88.0 mm2/s.
Soybean lecithin (Phospholipon 90G; phosphatidylcholine content = minimum 94.0%) was purchased from H. Holstein Co., Ltd. (Tokyo, Japan). All LPs were kindly donated by Kaneda Co., Ltd. (Tokyo, Japan). Water was purchased from Otsuka Pharmaceutical Co., Ltd. (Tokyo, Japan). The LP kinematic viscosities at 37.8 °C were provided by Kaneda Co., Ltd., and are shown in Table 1.
| Name of LP | Kinematic viscosity (mm2/s) |
|---|---|
| LP-A | 4.00–5.50 |
| LP-B | 5.80–8.90 |
| LP-C | 11.7–15.7 |
| LP-D | 34.0–37.5 |
| LP-E | 74.0–88.0 |
The required amounts of lecithin, LP and water were added to a vial, which was then capped tightly and mixed using a magnetic stirrer. The vials were maintained at 25 °C for several days to allow equilibration. The concentration of lecithin was fixed at 20%.
Measurement of the Water Concentration of the SamplesThe water concentration of the samples was measured using a Karl Fischer Moisture Analyzer (MKV-710; Kyoto Electronics Manufacturing Co., Ltd., Kyoto, Japan). KEMAQUA Titrant TR-3 (Kyoto Electronics Manufacturing Co., Ltd.) was used as the titration reagent, and KEMAQUA Solvent OIL (Kyoto Electronics Manufacturing Co., Ltd.) was used as the working medium.
Visual Observation and Phase DiagramsThe samples in the vials were evaluated visually for turbidity, viscoelasticity, and polarization through crossed polarizers at 25 °C, and the results were used to construct phase diagrams of the lecithin/water/LP systems.
Solubility of Lecithin in LPThe solubility of lecithin in the LPs was confirmed visually using samples prepared as follows. The required amounts of lecithin (0.1 to 0.5% in 0.1% increments, 0.5 to 2% in 0.5% increments, or 2 to 5% in 1% increments) and LP in sealed vials were stirred well using a magnetic stirrer at 60 °C. When the lecithin was completely dissolved in the LP, the samples were allowed to stand in an air incubator at 25 °C for one week. The maximum lecithin concentration of a uniform and transparent sample was defined as the maximum solubility.
Small-Angle X-Ray Scattering (SAXS) AnalysisSAXS measurements were conducted using the BL40B2 SAXS beamline (Structural Biology II Beamline) at SPring-8 (Hyogo, Japan) with a 2 m camera distance and using a large area pixel detector (PILATUS-3S 2M; Dectris, Baden, Switzerland). The wavelength of the beam was 0.1 nm and the exposure time was about 100 s. Data are shown for the scattering intensity versus the wave vector q [q = (4π/λ) sinθ, where λ is the X-ray wavelength and 2θ is the scattering angle]. LRW samples used for SAXS measurements were diluted ten times in LP to eliminate structure-factor effects. In general, SAXS measurements must be conducted in dilute systems in which the scattering objects do not interact and therefore can be assumed to be independent of each other.16) In this study, the LRW samples used for SAXS measurements were diluted in LP and thus the SAXS profiles were indicative of the shape of the micelle particles. The samples were injected into a capillary made from a ϕ2 mm quartz cell. All measurements were performed at 25 °C.
Rheological MeasurementsSteady and dynamic rheological measurements were performed on a MCR302 modular compact rheometer (Anton Paar GmbH, Glaz, Austria) with a cone-plate geometry (ϕ35 mm; cone angle, 1°). The temperature was maintained at 25 °C and a solvent trap was used to prevent water evaporation from the samples.
For steady-flow viscosity measurements, samples were subjected to a desired shear stress for sufficient time to achieve a steady state.
Before frequency (ω) sweep measurements, a linear viscoelastic region was obtained by strain sweep measurements under a constant frequency, then the frequency dependence of the storage modulus (G′) and loss modulus (G″) was investigated using the strain in the linear viscoelastic region in the frequency sweep measurements.
The samples were observed visually. Figure 1(A) shows photographs of lecithin/water/LP-C systems with different water concentrations as an example. A water concentration of 0.39% gave a cloudy sample and showed polarization. Translucent or cloudy samples showing polarization were defined as turbid in phase diagrams. When the water concentration was 0.74%, the sample was a transparent, highly viscoelastic body and showed no polarization, and was defined as a LRW in the phase diagrams. When the water concentration was 1.50%, the sample separated into two phases and was defined as two-phase in phase diagrams. LRWs have high stability because they are in a thermodynamic equilibrium state. All LRW samples remained stable at 25 °C for over a year, regardless of the LP species used.
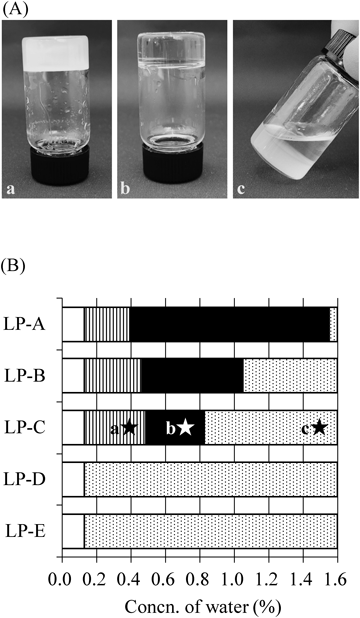
(A) Visual observations of lecithin/water/LP-C with a water concentration of (a) 0.39%, (b) 0.74%, and (c) 1.50%. (B) Phase diagrams with different water concentrations. □: Not tested,  : Turbid, ■: LRW,
  : two-phase. The lecithin concentration was fixed at 20%.
The resulting phase diagrams of the lecithin/water/LP systems at 25 °C are shown in Fig. 1(B). LPs do not contain water, but lecithin contains approximately 0.65% water, so it was not possible to prepare samples with a water concentration of 0.13% or lower. The LP-A system samples with a water concentration below 0.39% were in the turbid state, samples with water concentrations between 0.39 to 1.55% formed LRWs, and samples with a water concentration over 1.55% were in the two-phase state. In the LP-B and LP-C systems, samples with a water concentration between 0.46 to 1.05% and 0.49 to 0.83% were in the LRW state, respectively. All samples in the LP-D and LP-E systems were separated in two phases. The LP-A system showed the widest LRW region. The range of the LRW region decreased as the kinematic viscosity of the LP increased. The kinematic viscosity of LP increases with increasing molecular weight. Thus, the LRW region is wide when a low molecular weight LP is used. Robust LRWs can therefore generally be prepared using a low molecular weight LP.
Solubility of Lecithin in LPThe effect of the molecular weight of the LP on the LRW formation region was determined by the solubility of lecithin in the LPs. Figure 2 shows that the solubility of lecithin in the LPs differed depending on the molecular weight of the LP. Lecithin dissolved at 5% in LP-A. In contrast, LPs with a higher molecular weight showed lower solubility (about 0.1% in LP-D and LP-E).
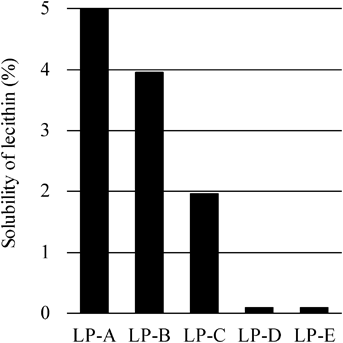
For lecithin to form micelles, it must dissolve in the LP. Lecithin dissolved only at 0.1% in the high molecular weight LPs LP-D and LP-E, suggesting why LRWs were not formed in LP-D or LP-E.
SAXS AnalysisSAXS is useful for the structural analysis of micelle particles between several to several tens of nanometers in diameter. The scattering vector q has the reciprocal dimension of length. The profile of a small q region provides information about a large structure (e.g., particle size), an intermediate q region provides information on a small structure (e.g., particle shape), and a large q region provides information on smaller structures (e.g., unevenness of the particle surface). A slope of an intermediate q region of 0, −1, or −2 indicates a globular, cylindrical, or lamellar shape, respectively.16) SAXS measurements were performed on samples with a uniform appearance to analyze the shapes of fine particles in the samples. Figure 3 shows examples of SAXS profiles for the lecithin/water/LP-B system. A water concentration of 0.43% (the turbid state) provided a clear diffraction peak, suggesting formation of a lamellar liquid crystal structure (Fig. 3(A)). In contrast, at a water concentration of 0.68%, a slope of −1, which is indicative of cylindrical particles (i.e., the presence of reverse wormlike micelles), was obtained in the intermediate q region (q = 0.1 to 1 nm−1), supporting the formation of LRWs (Fig. 3(B)).
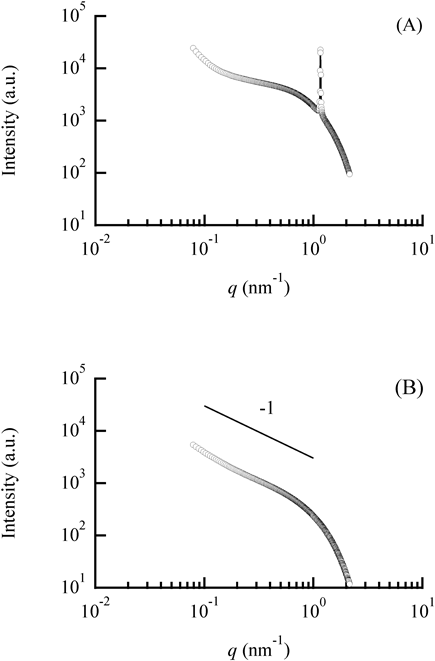
(A) Profile of the water concentration = 0.43% system. (B) Profile of the water concentration = 0.68% system. LRW samples were diluted ten times in LP for SAXS measurements, so (B) shows profile of sample with water concentration of 0.068%.
Steady flow viscosity measurements were performed on samples in the LRW state, and the effects of LP molecular weight and water concentration on LRW viscosity were investigated.
As an example, Fig. 4(A) shows the relationship between the viscosity (η) and the shear rate using LP-A. The viscosity remained constant up to a certain shear rate, characteristic of a Newtonian fluid, then decreased at higher shear rates, characteristic of a non-Newtonian fluid. Similar profiles were observed with samples with different water concentrations. In general, LRWs cause a decrease in viscosity in the high shear rate region, called “shear thinning,”1,11,14) because LRWs form transient 3D network structures that repeatedly collapse and form. When the added shear rate was slower than the time required to reform the 3D network, the viscosity remained constant because the 3D network structure was apparently not broken. However, if the added shear rate was faster than the time required to reform the 3D network, the viscosity dropped sharply because the 3D network structure was broken and could not reform. Similar profiles were obtained using LP-B and LP-C (data not shown).
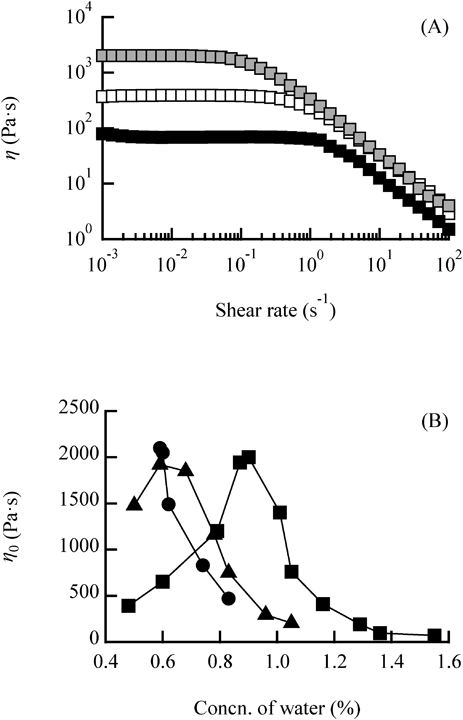
(A) Steady flow-viscosity (η) vs. shear-rate curves for the lecithin/water/LP-A system at various water concentrations. □: water = 0.48%,  : water = 0.90%, ■: water = 1.55%. (B) Zero-shear viscosity (η0) of lecithin/water/LP systems as a function of water concentration. ■: LP-A, ▲: LP-B, ●: LP-C. The lecithin concentration was fixed at 20%.
Next, the zero-shear viscosity (η0, the viscosity of the sample in the stationary state) was obtained from the viscosity at the constant value when the shear rate was extrapolated to zero. Figure 4(B) shows the effect of water concentration on η0. In the LP-A system, η0 increased with increasing water concentration, became a maximum at a water concentration of 0.90%, and then decreased. In the LP-B system, the profile was similar but η0 became a maximum at a water concentration of 0.59%. In the LP-C system, η0 was a maximum at a low water concentration of 0.59%, and decreased with increasing water concentration. This indicated that when a higher molecular weight LP is used to generate LRWs, the LRWs are sufficiently long to entangle and contain a smaller amount of water. In general, the critical micelle concentration of nonionic surfactant aqueous solutions is lower than that of ionic surfactant aqueous solutions because the solubility of nonionic surfactants is lower than that of ionic surfactants and thus they are thermodynamically more stable to form micelles at low water concentrations. On the other hand, lecithin is less soluble in high molecular weight LPs and therefore more likely to form reverse micelles in oil, so the addition of a small amount of water likely facilitates a transition of the reverse micellar structure from spherical to wormlike. Furthermore, the maximum value of η0 was similar (about 2000 Pa·s) regardless of the molecular weight of the LP. This η0 reflects the amount and length of LRWs that are sufficiently long to entangle.
Frequency Sweep MeasurementsFrequency sweep measurements were performed on samples in the LRW region to characterize their viscoelasticity. As an example, Fig. 5(A) shows the G′ and G″ for LP-A. G′ and G″ intersected at certain frequencies. The viscous component G″ was dominant on the low frequency side of the intersection and the elastic component G′ was dominant on the high frequency side. This behavior is observed in Maxwell model bodies, a basic model of viscoelastic bodies, and is characteristic of LRWs. The solid line in Fig. 5(A) is the result of fitting by the single Maxwell model based on equations (1) and (2).
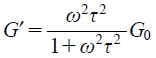 | (1) |
 | (2) |
Here, G0 is the plateau modulus and τ is the relaxation time, reflecting the amount and length of the LRWs, respectively.17)
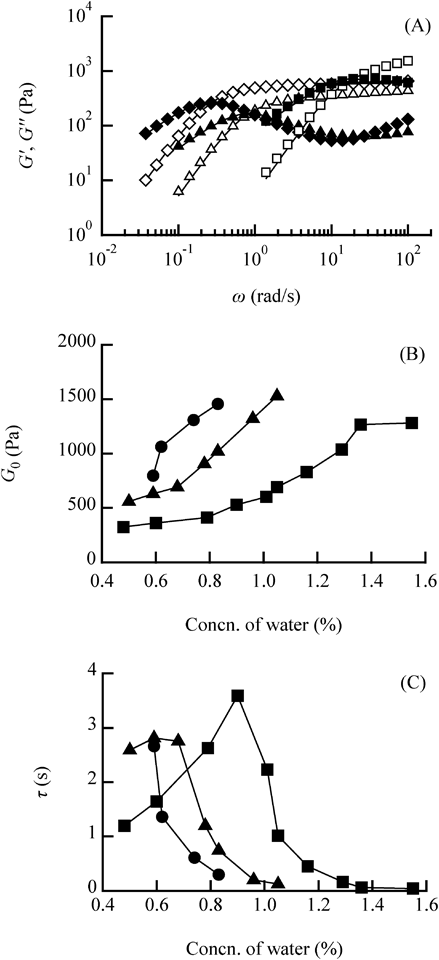
(A) Variation in G′ and G″ as a function of frequency (ω) at different water concentrations in the lecithin/water/LP-A system. △G′, ▲G″: water = 0.48%, ◇G′, ◆G″: water = 0.90%, □G′, ■G″: water = 1.55%. Solid lines are Maxwellian fittings to the experimental data. (B) Variation in plateau modulus (G0) and (C) relaxation time (τ) at different water concentrations in lecithin/water/LP systems. ■: LP-A, ▲: LP-B, ●: LP-C. The lecithin concentration was fixed at 20%.
Figure 5(B) shows the variation in G0 obtained from the Maxwell model fitting at different water concentrations. G0 increased monotonically with increasing water concentration in all LPs, indicating that the amount of LRWs in the samples increased with increasing water concentration. The maximum values of G0 were similar regardless of the LP used in the LRW, indicating that the maximum amount of LRWs formed in the samples was similar regardless of the type of LP used. Furthermore, G0 for samples with the same water concentration increased with increasing LP molecular weight, suggesting that LPs with higher molecular weight formed more LRWs with less water.
Figure 5(C) shows the variation in τ obtained from the Maxwell model fitting at different water concentrations. In the LP-A system, τ increased and then decreased with increasing water concentration. In the LP-B system the profile was similar but τ was a maximum at a lower water concentration. In the LP-C system, τ was a maximum at a low water concentration and decreased with increasing water concentration. The water concentration at the maximum τ for LP-A, LP-B and LP-C was 0.90, 0.59 and 0.59%, respectively, a variation similar to the variation in η0. These results suggested that the viscosity increased by extending the length of the LRWs and strengthened the 3D network as the water concentration increased. A water concentration that did not allow extension of the LRWs resulted in a viscosity decrease. In general, LRWs consisting of lecithin/water/oil have a maximum zero-shear viscosity value at a specific water concentration,18) suggesting a transition from linear LRWs to a branched structure. The bifurcation points in the branched LRWs are constantly moving and can relieve stress faster than linear LRWs, resulting in shorter relaxation times and lower viscosity.19)
Rheological measurements revealed that the molecular weight of LP affected the water concentration at which the maximum viscosity was observed, but did not affect the maximum viscosity value, suggesting that the variation in LRW viscosity is related to the formation of branched structures in the samples.
We studied the effect of oil physicochemical properties on the formation and characteristics of LRWs using five LPs with different molecular weights.
When the LP molecular weight was low, the LP dissolved lecithin easily and formed LRWs. LRWs formed over a wide range of water concentrations with lower molecular weight LPs. The viscosity of the LRWs depended on the LP molecular weight and the water concentration. Thus, the physicochemical properties of LP affect the phase state and rheological properties of LRWs. LRWs with various viscosities could be prepared using LPs with different molecular weights and the same water concentration.
The judicious use of LPs with different molecular weights may allow the preparation of pharmaceuticals such as transdermal dosage forms with various rheological properties.
The synchrotron radiation experiments were performed at the BL40B2 beamline of SPring-8 with the approval of the Japan Synchrotron Radiation Research Institute (JASRI), Proposal No. 2020A1076. We thank Kaneda Co., Ltd. for providing the oils.
The authors declare no conflict of interest.