Abstract
This study aimed to evaluate the interspecies difference in metabolism of mulberrin and examine the interaction between mulberrin and CYP enzymes or recombinant human uridine 5′-diphosphate (UDP)-glucuronosyltransferase (UGT) enzymes. Liver microsomes from human (HLMs), Beagle dog (DLMs), minipig (PLMs), monkey (MLMs), rabbit (RLMs), rat (RAMs), and mouse (MIMs) were used to investigate metabolic diversity among different species. Additionally, recombinant human supersomes were used to confirm that metabolic enzymes are involved in the biotransformation of mulberrin. We also evaluated the influence of mulberrin on protein expression by Western blot analysis. Mulberrin metabolism showed significant interspecies differences. We found four and two metabolites in phase I and II reaction systems, respectively. In phase I metabolism profiles of mulberrin for HLMs, PLMs and MLMs conformed to the classic Michaelis–Menten kinetics, RAMs and MIMs followed biphasic kinetics; phase II reaction of mulberrin in HLMs, DLMs, PLMs, MLMs, RLMs, RAMs and MIMs followed biphasic kinetics. UGT1A1 were the major CYP isoforms responsible for the metabolism of mulberrin. Mulberrin showed potent inhibitory effects against CYP3A4, CYP2C9, CYP2E1, UGT1A1, UGT1A3 and UGT2B7 with IC50 values of 54.21, 9.93, 39.12, 3.84, 2.01, 16.36 µM, respectively. According to Western blot analysis, mulberrin can upregulate the protein expression of CYP2C19, and downregulate the expression levels of CYP3A5 and CYP2C9 in HepG2 cells as concentration increased. The interspecies comparisons can help find other species with metabolic pathways similar to those in humans for future in vivo studies.
Introduction
The Chinese medicine Romulus Mori, which is the dried root bark of white mulberry (Morus alba L.), is reported to show antioxidant and anti-inflammatory activities,1,2) and has been used widely in clinical applications. Mulberrin, a flavone with two isoprenyl groups and four phenolic hydroxyl groups, is a key component of Morusalba L. extract, which has been found to suppress oxidative stress, inflammation2,3) and apoptosis in a spinal cord injury rat model.4) In addition, mulberrin has been reported to have a potential therapeutic effect in alleviating motor dysfunction in a rat model of Parkinson’s disease.5) The chemical structure of mulberrin is shown in Fig. 1. It has been reported that compounds with coumarin or flavonoid structure may affect CYP enzymes and uridine 5′-diphosphate (UDP)-glucuronosyltransferase (UGT) enzyme activities.6,7)
Over 90% of xenobiotics are metabolized by CYP and UGT enzymes. These are the key enzymes in phase I and phase II reactions, respectively.8,9) Medication errors can be associated with severe complications and even life-threatening side effects. These medication error-associated complicationsmay be caused by drug–drug interactions (DDIs), which are defined as the incidence of an unsafe combination of prescribed medications in an individual.10) A DDIs may occur if metabolic enzymes are inhibited.11) In oncology, DDIs is considered to be the most significant issue because cancer patients often take multiple medications during their treatment against cancer progression.12–14) If mulberrin and a drug, metabolized by the same enzyme, were co-administered, the two compounds will compete with each other to bind the finite number of binding sites of the metabolic enzyme and then affect blood concentration of the drug, which may lead to side-effects.15,16)
Through inter-species comparison, it is possible to determine which species with metabolic pathways similar humans. Species with similar metabolic cascades can serve as suitable models for future in-vivo research.17,18) Therefore, it is necessary to explore the metabolic activities of mulberrin and species diversity.
Furthermore, this study assessed the inhibitory profiling of mulberrin against CYP isoforms, and compared the metabolic profiles and diversity of mulberrin in various species, which will contribute to advance its pharmacokinetic study in vivo.
Experimental
Chemicals and ReagentsMulberrin (purity ≥95%) was provided by Chengdu Pufei De Biotech Co., Ltd. (Chengdu, China). HepG2 cells were obtained from Procell Life Science & Technology Co., Ltd. (Wuhan, China). CYP1A1 polyclonal antibody (CAT: BS6575), CYP2D6 polyclonal antibody (CAT: BS5685), CYP3A4 polyclonal antibody (CAT: BS8464), CYP3A5 polyclonal antibody (CAT: BS70851), CYP2C9 polyclonal antibody (CAT: BS603094), CYP2C19 polyclonal antibody (CAT: BS2517) and CYP2E1 polyclonal antibody (CAT: AP0016) were all obtained from BioWorld (Dublin, OH, U.S.A.). Anti-β-actin antibody was obtained from Servicebio (Wuhan, China). Radio immunoprecipitation assay (RIPA) lysis buffer was provided by BestBio (Shanghai, China), and BCA assay-kit was provided by Beyotime (Shanghai, China). Phenacetin, coumarin, diclofenac, paclitaxel, chlorzoxazone, dextromethorphan and testosterone were obtained from CN Biomedicals, Inc. (Aurora, OH, U.S.A.). 4-Methylumbelliferone (4-MU), 4-methylumbelliferone-β-D-glucuronide (4-MUG), analytical grade acetonitrile and formic acid were provided by Merck (Darmstadt, Germany). Tris–HCl, Brij58, D-glucose-6-phosphate (G-6-P), oxidized nicotinamide adenine dinucleotide phosphate (NADP+), uridine 5′-diphosphoglucuronic acid (UDPGA, trisodium salt), and glucose-6-phosphate dehydrogenase (G-6-PD), were provided by Sigma-Aldrich (MO, U.S.A.).
Liver microsomes of human (HLMs), Beagle dog (DLMs), mini pig (PLMs), monkey (MLMs), rabbit (RLMs), rat (RAMs) mouse (MIMs), recombinant CYP4F2, CYP2E1, CYP2D6, CYP2C19, CYP2C9, CYP2C8, CYP2B6, CYP1B1, CYP3A5, CYP3A4, CYP2A6, CYP1A2, CYP1A1, UGT1A1, UGT1A3 and UGT2B7isozymes were provided by the Liver Disease Co., Ltd. (Dalian, China). The recombinant CYP and UGT isozymes are expressed from human CYP or UGT cDNA using a baculovirus expression system. Baculovirus infected insect cells were used to prepare these microsomes. A microsome preparation using wild type virus should be used as a control for native activities. The stuff was stored at −80 °C until used. Research involving human subjects was performed under full compliance with government policies and the Helsinki Declaration, and informed consent was obtained from all subjects.
Incubation Conditions in Phase I and II Reaction SystemsThe optimal incubation conditions for microsomes have been reported.19,20) The total volume (200 µL) of phase I incubation reaction system consists of protein in liver microsomes, potassium phosphate buffer (pH 7.4), MgCl2, G-6-P, G-6-PD, and NADPH (0.5 mg/mL, 0.1 M, 4 mM, 10 mM, 1 unit/mL, and 1 mM, accordingly). The mixture was activated by adding NADPH after pre-incubated at 37 °C for 3 min. The incubation time was optimized for 60 min, and then interrupted by adding 200 µL of ice-cold acetonitrile.
In the phase II reaction system, liver microsomes (0.5 mg/mL protein) were incubated in 200 µL of incubation mixture containing 4 mM UDPGA, 5 mM MgCl2, 20 mg/mL Brij58, and 50 mM Tris–HCl buffer (pH 7.4). The mixture was initiated by UDPGA after pre-incubated at 37 °C for 3 min. Incubation of the mixtures was terminated (at 37 °C for 2 h) by adding 200 µL ice-cold acetonitrile, followed by 20 min of incubation on ice.
At 4 °C, the samples were then centrifuged (at 12000 × g) for half an hour. The supernatant was collected as a 10-µL aliquot and each aliquot of different experiments wasthen analyzed by HPLC.
Identification of the Metabolites in Liver Microsomes from Seven SpeciesThe biotransformation of mulberrinwas examined via incubating it with HLMs, DLMs, PLMs, MLMs, RLMs, RAMs, and MIMs. The metabolites were identified by HPLC using a Shimadzu HPLC system (Shimadzu, Kyoto, Japan) equipped with, a SIL-20 A auto-injector, a CTO-20AB column oven, an SPD-20 A UV detector and two LC-20AB pumps. A 10-µL aliquot was injected into a C18column (4.6 × 150 mm, 5 µm; Dalian Elite Analytical Instruments Co., Dalian, China) and analyzed using the HPLC system. The column oven was set as 40 °C, the velocity rate was kept at 1 mL/min, and samples were detected at 264 nm. The mobile phase composed of distilled water mixing with 0.1% formic acid (A) and LC grade methanol (B) followed by gradient program: 0.00–12.00 min, 55–70% B; 12.00–12.50 min, 70–95% B; 12.50–17.00 min, 95% B; 17.00–17.50 min, 95–55% B; 17.50–23.00 min, 55% B.
Structure Analysis of MetabolitesThe metabolite structures were identified by UPLC-MS/MS (Thermo Scientific Q Exactive) and ion source is electrospray ionization (ESI) and MS. The mass spectrometry conditions were as follows: capillary temperature and probe heater temp, 300 °C; sheath gas and aux gas, 40 and 8 Arb; max spray current, 100 µA, respectively.
Kinetic Study of Mulberrin Catalyzed by Different MicrosomesA pre-experiment needed to be performed before the experiment in order to determine the reaction time and concentration of microsomes that are required to keep the enzymatic reaction within the linear range. differentmulberrin concentrations (1–200 µM) were used to performe enzyme kinetics reactionst and the protein concentration of seven species was 0.5 mg/mL. The kinetic parameters, Vmax and Km, were obtained from fitting the experimental data to the Michaelis–Menten equation (Eq. 1) or Biphasic Kinetics equation (Eq. 2)21) and the obtained data have been shown in the form of graphs (Eadie–Hofstee plots). Intrinsic clearance (CLint) is equal to Vmax/Km. Enzymatic kinetic reactions must satisfy the assumptions of steady state and rapid equilibrium.
 | (1) |
Here V, [S], Km, and Vmax depict the reaction velocity, substrate concentration, affinity constant of the substrate, and maximum velocity of the reaction, accordingly.
 | (2) |
Here Vmax1 and Vmax2 are the estimated maximum velocity for the phase I and II metabolic reactions, respectively, and Ks1 and Ks2 are the affinity constants of the two metabolic phases
 | (3) |
where Ks and Ksi represent the substrate affinity and inhibition constants, respectively. Due to the lack of metabolite standards, the metabolites in the incubation systems were quantified using a standard curve of mulberrin. Kinetic constants are expressed as the mean ± standard deviation (S.D.).
Predictionof in-Vivo Hepatic ClearanceThe in vivo hepatic clearances of mulberrin in phase I and II metabolism were determined by using Eqs (4)–(6).22)
 | (4) |
 | (5) |
 | (6) |
where SF (scaling factor) means the weight of liver in grams multiplied by the milligrams of microsomal protein per gram of liver; fu represents the unbound fraction in the blood (the value of fu was set to 1 due to the absence of available data for mulberrin); CLH denotes the clearance of liver; QH means the hepatic blood flow in liver. The physiological parameters to calculate the intrinsic clearance are as follows: the weights of the human, dog and rat livers were 25.7, 32.0 and 40.0 g/kg body weights, respectively; the contents of HLMs, DLMs and RAMs were 48.8, 77.9 and 44.8 mg/g of liver, respectively; the blood flow in their liver were 20.7, 30.9 and 55.2 mL·(min·kg)−1 body weight, accordingly.23)
Reaction Phenotyping Assays with Recombinant CYPsDifferent cDNA-expressed human CYP isoforms were used to identify isoform(s) involved in the metabolism of mulberrin. The incubations conditions were as described in “Incubation Condition in Phase I and II Reaction Systems.” A 100 μMmulberrin sample was incubated with recombinant CYPs (15 nM) for 60 min at 37 °C and then analyzed by HPLC.
Metabolic Stability Assessment with Different MicrosomesA 100 µM mulberrin sample was subjected to phase I (CYPs) or phase II (UGTs) reaction system together with different species liver microsomes. The reaction volume was 600 µL, and activated by adding NADP or UDPGA after pre-incubation at 37 °C for 3 min. When the reaction was performed for 0, 30, 60, and 90 min, 100-µL aliquots of each of the samples were collected, and mixed with 100 µL of ice-cold acetonitrile to terminate the counterpart of reaction. The admixtures were centrifuged at 12000 × g for 20 min at 4 °C, and then a 100-µL aliquot of the supernatant was collected and analyzed by HPLC. The in vitro half-life (T1/2) was calculated by the formula T1/2 = ln2/slope.24)
Inhibitory AssaysThe inhibitory or stimulatory effects of mulberrin (100 µM) on the activities of CYP isoforms (CYP1A2, CYP2C9, CYP2D6, CYP2E1, CYP3A4, and CYP2C19) were assessed in HLMs.25,26)The reaction system was as described in “Incubation Condition in Phase I and II Reaction Systems.” The substrates for CYP1A2, CYP2C9, CYP2D6, CYP2E1, CYP3A4, and CYP2C19 were phenacetin (40 µM), diclofenac (10 µM), dextromethorphan (25 µM), chlorzoxazone (120 µM), testosterone (35 µM), and (S)-mephenytoin (20 µM), respectively.
Due to the lack of specific substrates for UGT isoforms, 4-MU was used as a nonspecific probe substrate for UGT isoforms to determine the inhibition of UGTs by mulberrin. A typical incubation mixture (total volume of 200 µL) contained recombinant UGTs, 5 mM UDPGA, 5 mM MgCl2, 50 mMTris-HCl buffer (pH 7.4), and 4-MU in the absence or presence of different concentrations of mulberrin. The final protein concentrations of recombinant UGT1A1, UGT1A3, and UGT2B7 were 0.125, 0.05, and 0.05 mg/mL, respectively. The incubation concentrations of 4-MU were 110, 1200, and 250 µM for UGT1A1, UGT1A3, and UGT2B7, respectively. The 100 µM mulberrin sample inhibited the total activity of CYP or UGT isoforms by more than 90%, and the inhibition kinetic parameters, Ki and IC50, were analyzed and determined. Lineweaver-Burk and Dixon plots were drawn to identify the type of inhibition.
Western Blot AnalysisAliquots of 5 mL of HepG2 cell suspension were seeded into 60-mm Petri dishes and then exposed to various dilutions of mulberrin (0, 1 and 10 µM) for 48 h. Subsequently, RIPA lysis buffer comprising proteinase inhibitor was used to extract total protein from HepG2 cells, followed by determining the concentration of protein via BCA assay kit. Next, sodium dodecyl sulfate-polyacrylamide gel electrophoresis (SDS-PAGE) was employed to separate proteins before being transferred to polyvinylidene difluoride (PVDF) membranes. Skimmed milk (5%) in tris-buffered saline Tween 20 (TBST) solution was used for membrane blockage at approx. 25 °C (for 60 min). The membrane was incubated with the corresponding primary antibody (antibodies against β-actin, CYP2C9, CYP1A1, CYP2D6, CYP2C19, CYP3A4, CYP2E1, and CYP3A5) for 24 h at 4 °C. TBST was then utilized for membrane washing (thricely). Following that the membrane was incubated with secondary antibodies (conjugated with HRP (horseradish-peroxidase)) for 60 min at approx. 25 °C. The intensity of each band was quantified and expressed relative to the β-actin signal as a measure of protein relative abundance in the various samples using ImageJ densitometry software (NIH, Bethesda, MD, U.S.A.).
Statistical AnalysisIn this study, all incubation experiments were carried out thricely, and the mean values were used to perform the analysis. The Ki and IC50 values were statistically evaluated and analyzed by nonlinear regression analysis using the GraphPad Prism 8.0 software (San Diego, CA, U.S.A.). The obtained data are indicated as the mean ± S.D. or mean ± standard error of the mean (S.E.M.). ANOVA and Student’s t-test were employed for comparing the two unpaired groups and test the differences of multiple groups, respectively. A p < 0.05 (two-tailed) was regarded as statistically considerable.
Results
Metabolic Profile of Mulberrinin Liver Microsomes from Different SpeciesAfter incubation of mulberrin (20 mM) with liver microsomes in phase I (CYPs) reaction system, four new peaks were found in the HPLC spectra than the control group (CTRL). The retention times (tR) of the four metabolites (M1–M4) were 9.71, 11.14, 11.87, and 13.39 min, respectively (Fig. 2A). After incubation of mulberrin with different species liver microsomes in phase II (UGTs) reaction system, two new peaks were detected at 10.18 min (M5) and 10.89 min (M6), respectively (Fig. 2B). The peak area percent of each metabolite in the different microsomes are shown in Table 1.
Table 1. The Peak Area Percent of Each Metabolite in Different Microsomes
| Species | Peak area (%) |
|---|
| M1 | M2 | M3 | M4 | M5 | M6 |
|---|
| HLMs | 1.1 | 2.0 | ND | ND | 10.8 | ND |
| DLMS | ND | ND | ND | ND | 8.4 | 19.8 |
| PLMs | 15.9 | 15.0 | 20.3 | 72.1 | 27.1 | 74.5 |
| MLMs | 73.0 | 31.2 | 59.4 | 27.9 | 21.0 | ND |
| RLMS | ND | ND | ND | ND | 12.8 | ND |
| RAMs | 9.0 | 14.3 | ND | ND | 7.5 | 4.2 |
| MIMs | 1.0 | 37.5 | 20.3 | ND | 12.4 | 1.5 |
| Total | 100 | 100 | 100 | 100 | 100 | 100 |
UPLC-MS/MS was used to determine the structures of the metabolites. Based on the direct comparison with the mass spectra of the control group, the structures of six metabolites were identified in all the groups (Fig. 3). The LC-MS/MS spectras of mulberrin and its metabolites were displayed in the supplemental material. The structural analysis of metabolites was based on LC-MS/MS information (Table 2).
Table 2. Identification of the Metabolites of Mulberrin by LC-MS/MS
| Number | tR (min) | Formula | Mass | Fragment | Metabolic reaction |
|---|
| M0 | 13.68 | C25H27O6 | 423.18 | 415, 421, 423, 435, 437, 439 | Parent Drug |
| M1 | 9.71 | C25H27O8 | 455.17 | 449, 454, 455, 456 | 2 × Hydroxylation |
| M2 | 11.14 | C25H27O7 | 439.18 | 439, 440, 455 | Hydroxylation |
| M3 | 11.87 | C25H25O7 | 437.16 | 434, 435, 437, 438, 439 | Reduction + Oxidation |
| M4 | 13.39 | C25H25O6 | 421.16 | 419, 421, 422, 423, 424 | Reduction |
| M5 | 10.18 | C37H43O18 | 775.24 | 705, 715, 775, 777, 813 | 2 × Glucuronidation |
| M6 | 10.89 | C31H35O12 | 599.21 | 525, 536, 547, 569, 585, 592, 599, 603, 621, 637, 653, 673 | Glucuronidation |
To differentiate the metabolic profiles among species and determine the optimal animal model for future study of mulberrin metabolism in humans, the enzyme kinetics of mulberrin in phase I and II reaction systems were studied and the kinetic parameter values were calculated using the metabolite with the largest peak area. According to the results of mulberrin metabolism in different species, the metabolite with the biggest peak area was used to calculate the kinetic parameter values (Km, Vmax, and CLint). According to the peak areas of metabolites (Table 1), kinetic parameters were obtained for HLMs (M2), PLMs (M4), MLMs (M1), RAMs (M2) and MIMS (M2) in phase I (CYPs) reaction system. In phase II (UGTs) reaction system, the peak areas of M5, M6, M6, M5, M5, M5, and M5were utilized to determine the kinetic parameters for HLMs, DLMS, PLMs, MLMs, RLMs, RAMs, MIMs, respectively. The metabolism profiles of mulberrin (1–200 µM) in phase I and II reaction systemswere shown in Figs. 4 and 5, respectively, and the kinetic parameters (Km, Vmax and CLint) for different species in phase I and II reaction systems were summarized in Tables 3 and 4, respectively.
Table 3. Kinetic Parameters of Metabolites from Mulberrin in Phase I Reaction System
| Kinetic parameters | HLMs | PLMs | MLMs | RAMs | MIMs |
|---|
| Vmax | 11.15 ± 0.27 | 11.03 ± 0.15 | 17.91 ± 0.66 | 12.34 ± 0.84 | 13.67 ± 1.24 |
| Km | 5.09 ± 1.70 | 19.04 ± 8.87 | 13.23 ± 5.79 | 6.05 ± 3.65 | 6.77 ± 0.82 |
| Clint | 0.04 | 0.01 | 0.01 | 0.03 | 0.03 |
The units of Vmax, Km, and CLint are pmol·min−1·mg−1 protein, µg/mL and mL·min−1·mg−1 protein, accordingly.
Table 4. Kinetic Parameters of Metabolites from Mulberrin in Phase II Reaction System
| Kinetic parameters | HLMs | DLMs | PLMs | MLMs | RLMs | RAMs | MIMs |
|---|
| Vmax | 35.37 ± 5.32 | 26.58 ± 2.06 | 92.36 ± 13.25 | 152.24 ± 13.74 | 93.17 ± 23.93 | 72.06 ± 15.12 | 39.88 ± 2.63 |
| Km | 24.35 ± 14.46 | 5.785 ± 2.41 | 38.22 ± 18.12 | 54.11 ± 13.98 | 118.35 ± 62.74 | 73.39 ± 38.73 | 3.38 ± 1.24 |
| Clint | 0.02 | 0.08 | 0.04 | 0.05 | 0.01 | 0.02 | 0.20 |
The units of Vmax, Km, and CLint are pmol·min−1·mg−1 protein, µg/mL and mL·min−1·mg−1 protein, accordingly.
The kinetic parameters of M1 in HLMs and RAMs were used to calculate the in-vivo CLH values, which were found to be 18.67 and 12.77 mL/min/kg body weight for rats and humans, accordingly. Furthermore, their percentages of CLHversus QH were 61.67 and 33.82%, accordingly.
Screening with Recombinant CYPsMulberrin was incubated with the underlined cDNA-expressed human CYP or UGT enzymes to validate the isoforms involved in mulberrin metabolic pathway catalysis. As shown in Fig. 6, there wasonly one metabolite by HPLC, implying that rh-CYP isoforms displayed very limited and even no catalytic activity in this biotransformation, and UGT1A1 is an important isoform involved in catalytic activity. The result was consistent with that in “Metabolic Profile of Mulberrinin Liver Microsomes from Different Species.”
Metabolic Stability Assessment with Different Liver MicrosomesMetabolic stabilities of mulberrin in phase I and II metabolisms were determined using liver microsomes from different species, and the results are shown in Fig. 7. The T1/2 values of mulberrin in phase I were255.6, 380.9, 180.4, 110.3, 401.2, 210.3, 195.4 min, and in phase II were 123.6, 169.1, 54.5, 135.2, 102.1, 82.8 and 105.6 min for HLMs, DLMs, PLMs, MLMs, RAMs, RLMs, and MIMs, respectively.
Inhibitory Effects of Mulberrin against CYPs and UGTsMulberrin(100 µM) showed inhibitory effects higher than 90% against CYP3A4, CYP2C9, CYP2E1 and UGT1A1, UGT1A3 and UGT 2B7, and then the inhibition kinetic parameters were calculated. The inhibitory effects of mulberrin against CYP3A4, CYP2C9, CYP2E1, UGT1A1, UGT1A3 and UGT2B7 were concentration dependent (Fig. S1A, S2A, S3A, S4A, S5A, S6A) with IC50 values of 54.21, 9.93, 39.12, 2.78, 0.49, 4.68 µM, respectively. Furthermore, the Lineweaver-Burk and Dixon plots revealed thatmulberrin inhibited CYP3A4 and UGT1A3 in a non-competitive manner and inhibited UGT2B7 in an uncompetitive manner while inhibiting CYP2C9 and CYP2E1 in a competitively manner (Supplementary Figs. S1–S6B, S1–S6C).The Kivaluesfor CYP3A4, CYP2C9, CYP2E1, UGT1A1, UGT1A3 and UGT2B7 were 15.87, 6.26, 29.28, 2.69, 16.36, 34.27 µM, respectively. The IC50 and Ki values with S.D. were presented in the supplemental materials (Supplementary Table S1).
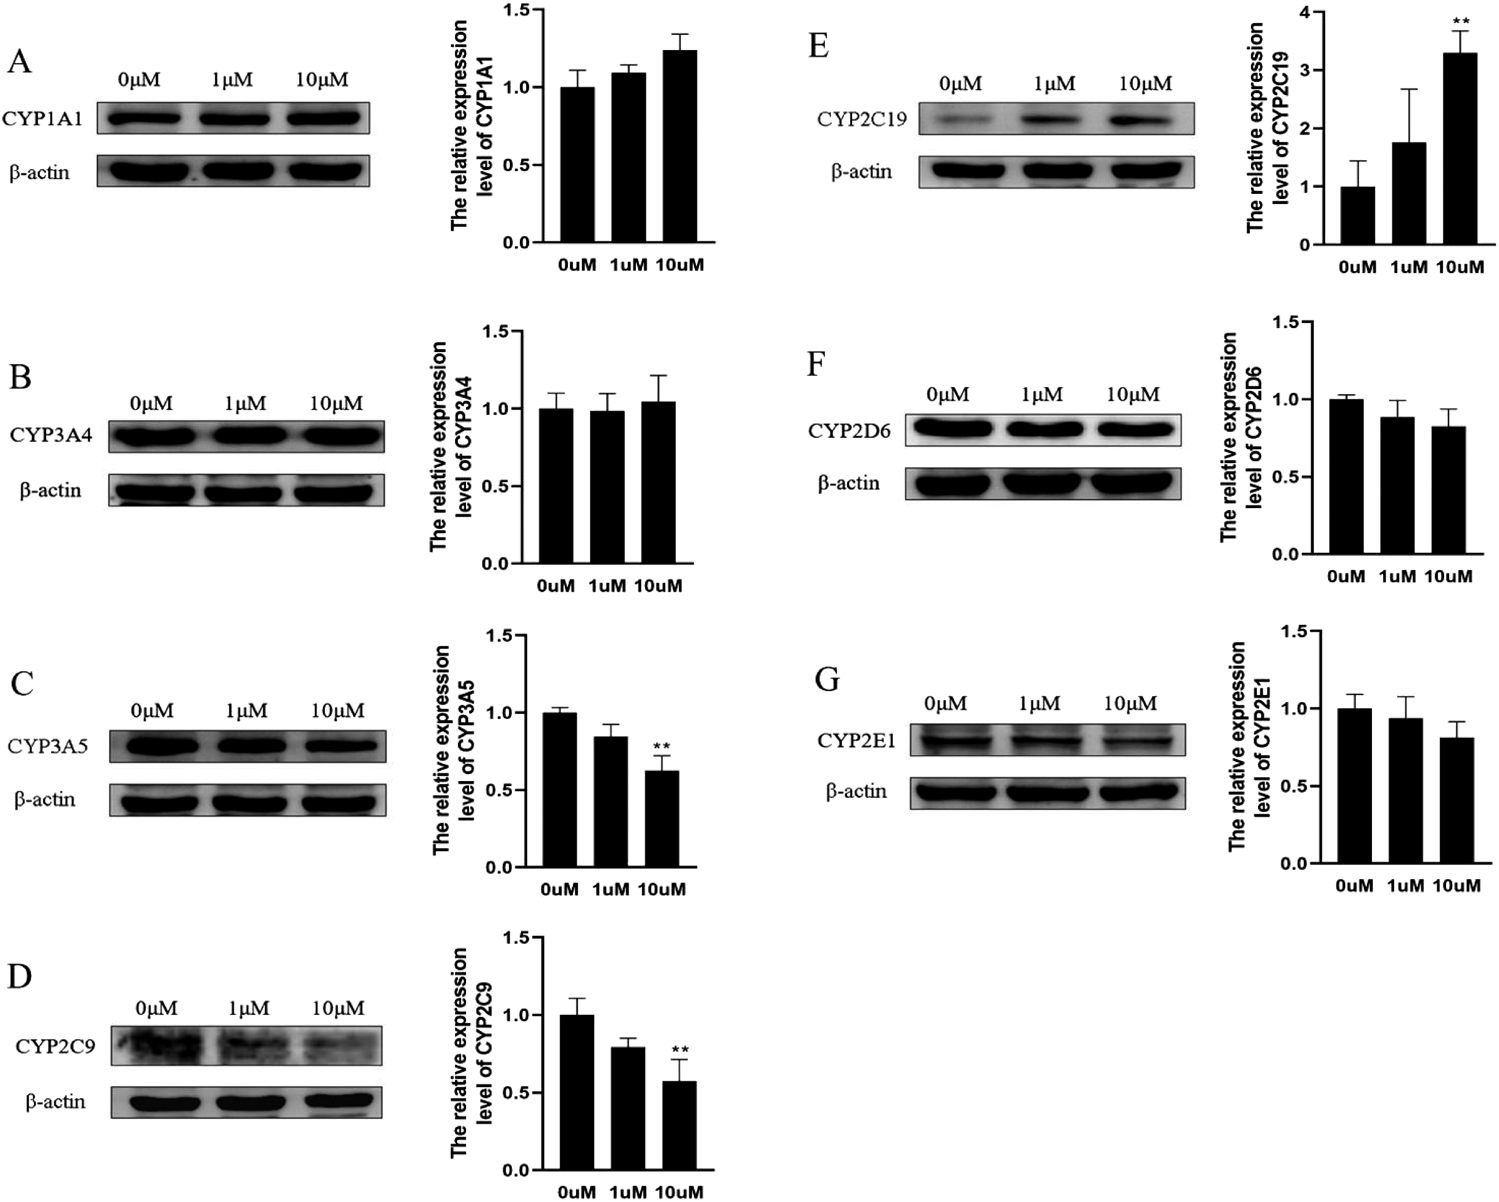
Effect of Mulberrin on CYP1A1, CYP3A4, CYP3A5, CYP2C9, CYP2C19, CYP2D6 and CYP2E1 Protein Expression in HepG2 CellsAs showed in Fig. 8, the protein expression of CYP2C19 was gradually up-regulated after treatment with 10 μMmulberrin relative to the untreated control (0 µM, p < 0.05). Conversely, the translational level of CYP3A5 and CYP2C9 were down-regulated after treatment with 10 μMmulberrin relative to the untreated control (p < 0.05). Although the corresponding protein expression of other CYP isoforms did show a slight change in the protein levels, the experiment was not statistically significant for all treatment conditions.
Discussion
Mulberrin is a naturally occurring flavone whose structure contains two isoprenylgroups and four phenolic hydroxyl groups. For most flavonoids methoxylated compounds, metabolizing enzymes in phases I and II can take part in their metabolism in vivo.27,28)
In this study, the species-specific differences in the NADPH- and UDPGA-dependent metabolism of mulberrin were determined. Four major mulberrin metabolites (M1–M4) in phase I, and two (M5, M6) in phase II were observed. Since M1 and M5 exhibited high peak areas in phase I (CYPs) and phase II (UGTs) reaction systems, respectively, they were considered as the main metabolites.29) Monkeys showed the strongest metabolic activity in phase I reactions with the largest peak areas for M1 and M3, the peak area percentages were 73.0 and 59.4%, respectively. Meanwhile, mini pigs showed the strongest metabolic activity in phase II reactions with the largest peak areas for M4 and M5, the peak area percentages were 72.1 and 27.1%, respectively, which were higher than those in other liver microsomes. We inferred the structures of M2 and M1 according to exact mass determination and the corresponding chemical composition. M2 and M1 had m/z of 16 and 32 Da more than mulberrin, indicating that they were hydroxylated or oxidized products of parent drug, respectively. However, we can’t distinguish whether the structures of two metabolites are enol-form or keto-form based on the data of LC-MS/MS. Mulberrin metabolism displayed large species differences. Humans showed weaker metabolic activity compared with monkeys and pigs in phase I reaction systems (p < 0.05), but the phase II reaction of humans was stronger due to the higher peak areas of metabolites M5 and M6 compared with the phase I reaction. Thus, the glucuronidationreaction was reckoned an important pathway for mulberrin clearance in humans. Mulberrin contains four phenolic hydroxyl groups, the glucuronidation reaction may occur by transferring a glucuronic acid to the substrate, thereby generating the conjugated metabolites.30,31) M6 and M5 had the m/z of 176 and 352 Da more than M0, indicating they were one and two glucuronidation metabolites of mulberrin, respectively. However, the structures of glucuronidated metabolites of mulberrin cannot be inferred only by mass spectrometry information. In future studies, the NMR method will be used to verify which of the hydroxyl groups is glucuronidated.
The study of enzyme kinetics of a substrate can reflect the catalytic efficiency and affinity of metabolic enzymes for the substrate,32,33) and identical Km value among diverse species reveals comparable binding affinity towards the metabolic sites and suggests similarities in species.34) According to the results of mulberrin metabolism in different species, phase I metabolism profiles of mulberrin for HLMs, PLMs and MLMs conformed to the classic Michaelis–Menten kinetics, as further demonstrated by the Eadie–Hofstee plot, which means that the phase I metabolism of mulberrin was handled by one or two isozymes with the identical Km value.35) However, such biotransformation in RAMs and MIMs followed biphasic kinetics, which means that the metabolic reactionsin rats and mice were catalyzed by more than one enzyme with largely different kinetic properties.36) Similarly, the phase II glucuronidation reaction of mulberrin in seven species followed biphasic kinetics, further demonstrated by the Eadie-Hofstee plot, as depicted in Fig. 5. For the production of M1 with HLMs, RAMs and MIMs had equal Km values, whereas PLMs and MLMs had considerably higher Km values, and the variations were found to be statistically considerable (all p < 0.05). Major concentration-dependent features were observed in reaction velocities.
We also predicted hepatic clearance in-vivo and the metabolic stability with different species liver microsomes.37) Based on the CLH predicted by the in-vitro results, compounds can be categorized into one of three groups: low-clearance drugs (less than 30% hepatic blood flow), intermediate-clearance drugs and high-clearance drugs (more than 70% hepatic blood flow).38) In humans and rats, mulberrin was shown to be an intermediate-clearance drug, which was also confirmed by a metabolic stability assay. The mulberrin had high T1/2 values, which indicated the considerable bioavailability and development prospect of mulberrin.39) In addition, MLMs showed relatively stronger metabolic activity compared with other species. DLMs showed a weaker metabolic activity in both phase I and II reaction systems. The metabolic characteristics of mulberrin in RAMs and MIMs were similar to those in humans. However, the phase I metabolic characteristics of mulberrin in pigs and monkeys showed significant differences (p < 0.05) compared with humans. These results indicate that rats and mice have similar metabolic characteristic as humans, with regards to mulberrin.
Co-administration of two drugs that are metabolized by the one enzyme or two similar enzymes is likely to result in DDIs.40) Thus, it is needed to evaluate the CYP isoforms involved in the biotransformation of mulberrin to avoid DDIs. As shown in Fig. 6, the main metabolite M5 was catalyzed by UGT1A1 in HLMs.
A drug with an IC50 of < 100 µM is considered the most effective inhibitor of CYP or enzymes, which can result in unfavorable herb-drug interactions.41–43)In this study, the results showed that mulberrin (100 µM) considerably inhibited CYP2C9, CYP3A4, CYP2E1, UGT1A1, UGT1A3 and UGT2B7. Moreover, the Ki value reflects an inhibitor’s absolute affinity for its target enzyme, with a lower Ki value indicating a higher inhibitory impact on the enzyme.44,45) Thus, if repress CYP or UGT isozymes may raise the concentration of substrates in the blood, which can have negative consequences.46,47) Inhibitory effect of mulberrin on UGT isoforms varied. The inhibition mode on UGT2B7 was uncompetitive mode. Uncompetitive inhibition requires that one or more substrates bind to enzyme before the inhibitor can bind. Uncompetitive inhibitors bind only to the enzyme-substrate complex and not to the free enzyme.48,49) UGT isoform, such as UGT1A9, was inhibited by p-cresol and valproic acid in an uncompetitive manner.50,51)
After treatment with 0, 1, and 10 μMmulberrin for 48 h, it has been revealed that mulberrin may disturb the protein expression of CYP enzymes. Mulberrin can significantly induce the protein expressions of CYP2C19. If mulberrin is co-administered with CYP2C19 substrates, the substratesmay be rapidly metabolized and result in loss of pharmacological activity. CYP1A1 is poorly expressed in human liver.52) In this study, CYP1A1 was abundantly expressed in HepG2 cells based on the results of Western blot. Feng et al.53)have shown that the expression of CYP1A1 is transiently induced by the culture medium in HepG2 cells because the medium used was exposed to light and the tryptophan in it was changed to the AHR ligand like FICZ, etc. Conversely, the protein expression of CYP3A5 and CYP2C9 was inhibited by mulberrin in a dose-dependent manner. Thus, co-administration of mulberrin with a drug that is a substrate for CYP3A5 or CYP2C9will also likely result in DDI.54) Expressions of the CYP2, 3, and 4 family members are controlled by transcription factors (CAR, PXR, and PPAR) of the nuclear receptor (NR) superfamily, mulberrin may affect the expression of transcription factors to regulate the expression of CYP isoforms.55,56) The mechanism of CYP isoform protein expression regulated by mubberrin needs to be further studied in future.
Conclusion
The metabolic profile of mulberrin varied from species-to-species in in vitro studies. Humans showed the lowest (CYP system) and highest (UGT system) metabolic activity levels to catalyze mulberrin compared with other species, and rats and mice exhibited similar metabolic characteristics as humans in phase I and phase II. The assessment of metabolism stability demonstrated the good stability of mulberrin among various species in both phase I and phase II reaction systems. UGT1A1 was the major UGT isoform involved in mulberrin metabolism. Mulberrin exhibited potent inhibitory effects against CYP3A4, CYP2C9, CYP2E1, UGT1A1, UGT1A3 and UGT2B7 activities. In addition, mulberrin can upregulate the protein expression of CYP1A1, and downregulate the protein expression of CYP3A5 and CYP2C9. Taken together, DDIs need to be carefully considered when mulberrin is co-administered with other drugs, and rats and mice will likely be suitable models for future in vivo studies.
Acknowledgments
The project was supported by the Doctoral Fund of Liaoning Province (Project No. 2019-BS-100) and transverse project of Jinzhou Medical University (2021003).
Author Contributions
Jiayin Hu: Investigation, Formal analysis, Writing—Original Draft & Editing
Tingting Hu: Resources, Investigation, Data Curation
Zhe Guo: Project administration
Lina Shan: Supervision
Xianbao Shi: Conceptualization, Funding acquisition
Conflict of Interest
The authors declare no conflict of interest.
Supplementary Materials
This article contains supplementary materials.
References
- 1) Jing H., Wang S., Wang M., Fu W., Zhang C., Xu D., PLOS ONE, 12, e0169560 (2017).
- 2) Park G. S., Kim J. K., Kim J. H., BMB Rep., 49, 232–237 (2016).
- 3) Jiang Q., Li X., Tian Y., Lin Q., Xie H., Lu W., Chi Y., Chen D., BMC Complement. Altern. Med., 17, 242 (2017).
- 4) Xia P., Gao X., Duan L., Zhang W., Sun Y. F., Biomed. Pharmacother., 107, 1480–1487 (2018).
- 5) Cao W., Dong Y., Zhao W., Lu X., Sun L., J. Chem. Neuroanat., 98, 63–70 (2019).
- 6) Li P., Lu Q., Jiang W., Pei X., Sun Y., Hao H., Hao K., Biomed. Pharmacother., 91, 425–435 (2017).
- 7) Shan L., Zhang G., Guo Z., Shi X., Life Sci., 234, 116770 (2019).
- 8) Shi X., Zhang G., Mackie B., Yang S., Wang J., Shan L., J. Chromatogr. B Analyt. Technol. Biomed. Life Sci., 1029–1030, 145–156 (2016).
- 9) Tang S., Chen A., Zhou X., Zeng L., Liu M., Wang X., Toxicol. Lett., 281, 74–83 (2017).
- 10) Buajordet I., Ebbesen J., Erikssen J., Brors O., Hilberg T., J. Intern. Med., 250, 327–341 (2001).
- 11) Wrighton S. A., Stevens J. C., Crit. Rev. Toxicol., 22, 1–21 (1992).
- 12) Zurth C., Koskinen M., Fricke R., Prien O., Korjamo T., Graudenz K., Denner K., Bairlein M., von Buhler C. J., Wilkinson G., Gieschen H., Eur. J. Drug Metab. Pharmacokinet., 44, 747–759 (2019).
- 13) van Leeuwen R. W., Brundel D. H., Neef C., van Gelder T., Mathijssen R. H., Burger D. M., Jansman F. G., Br. J. Cancer, 108, 1071–1078 (2013).
- 14) van Leeuwen R. W., Swart E. L., Boven E., Boom F. A., Schuitenmaker M. G., Hugtenburg J. G., Ann. Oncol., 22, 2334–2341 (2011).
- 15) Goey A. K., Mooiman K. D., Beijnen J. H., Schellens J. H., Meijerman I., Cancer Treat. Rev., 39, 773–783 (2013).
- 16) van Leeuwen R., Jansman F., van den Bemt P., de Man F., Piran F., Vincenten I., Jager A., Rijneveld A. W., Brugma J. D., Mathijssen R., van Gelder T., Ann. Oncol., 26, 992–997 (2015).
- 17) Zielinski J., Mevissen M., Toxicol. In Vitro, 29, 468–478 (2015).
- 18) Shi X., Zhang G., Ge G., Guo Z., Song Y., Su D., Shan L., Chem. Res. Toxicol., 32, 2125–2134 (2019).
- 19) Fang Z. Z., Zhang Y. Y., Ge G. B., Huo H., Liang S. C., Yang L., Br. J. Clin. Pharmacol., 69, 193–199 (2010).
- 20) Qi X. Y., Liang S. C., Ge G. B., Liu Y., Dong P. P., Zhang J. W., Wang A. X., Hou J., Zhu L. L., Yang L., Tu C. X., Food Chem. Toxicol., 56, 392–397 (2013).
- 21) He G., Troberg J., Lv X., Xia Y. L., Zhu L. L., Ning J., Ge G. B., Finel M., Yang L., Xenobiotica, 48, 109–116 (2018).
- 22) Li W., Liu Y., He Y. Q., Zhang J. W., Gao Y., Ge G. B., Liu H. X., Huo H., Liu H. T., Wang L. M., Sun J., Wang Q., Yang L., Xenobiotica, 38, 1551–1565 (2008).
- 23) Naritomi Y., Terashita S., Kimura S., Suzuki A., Kagayama A., Sugiyama Y., Drug Metab. Dispos., 29, 1316–1324 (2001).
- 24) Huang M., Ho P. C., Biochem. Pharmacol., 77, 1418–1428 (2009).
- 25) Smith P. K., Krohn R. I., Hermanson G. T., Mallia A. K., Gartner F. H., Provenzano M. D., Fujimoto E. K., Goeke N. M., Olson B. J., Klenk D. C., Anal. Biochem., 150, 76–85 (1985).
- 26) Liu Y., Ma H., Zhang J. W., Deng M. C., Yang L., Planta Med., 72, 126–131 (2006).
- 27) Lu H., Fang Z. Z., Cao Y. F., Hu C. M., Hong M., Sun X. Y., Li H., Liu Y., Fu X., Sun H., Fitoterapia, 84, 208–212 (2013).
- 28) Cong M., Hu C. M., Cao Y. F., Fang Z. Z., Tang S. H., Wang J. R., Luo J. S., Fitoterapia, 85, 109–113 (2013).
- 29) Ge G., Zhu M., J. Pharm. Anal., 10, iii–iv (2020).
- 30) Lu D., Liu H., Ye W., Wang Y., Wu B., Xenobiotica, 47, 304–313 (2017).
- 31) Wu Z., Liu H., Wu B., J. Pharm. Pharmacol., 67, 583–596 (2015).
- 32) Wang Y. Q., Shang X. F., Wang L., Zhang P., Zou L. W., Song Y. Q., Hao D. C., Fang S. Q., Ge G. B., Tang H., Chem. Biol. Interact., 315, 108871 (2020).
- 33) Ma H. Y., Yang J. D., Hou J., Zou L. W., Jin Q., Hao D. C., Ning J., Ge G. B., Yang L., Toxicol. In Vitro, 44, 280–286 (2017).
- 34) Zhang Y. Y., Liu Y., Zhang J. W., Ge G. B., Liu H. X., Wang L. M., Sun J., Yang L., Xenobiotica, 39, 903–914 (2009).
- 35) Jiang H., Meng X., Shi X., Yang J., Biosci. Biotechnol. Biochem., 84, 661–669 (2020).
- 36) Ge G. B., Chin. J. Nat. Med., 17, 801–802 (2019).
- 37) Miners J. O., Rowland A., Novak J. J., Lapham K., Goosen T. C., Pharmacol. Ther., 218, 107689 (2021).
- 38) Li X. Q., Björkman A., Andersson T. B., Gustafsson L. L., Masimirembwa C. M., Eur. J. Clin. Pharmacol., 59, 429–442 (2003).
- 39) Attwa M. W., Abdelhameed A. S., Kadi A. A., Drug Des. Devel. Ther., 15, 3915–3925 (2021).
- 40) Zhang F., Huang J., He R. J., Wang L., Huo P. C., Guan X. Q., Fang S. Q., Xiang Y. W., Jia S. N., Ge G. B., Phytomedicine, 77, 153287 (2020).
- 41) Savai J., Varghese A., Pandita N., Chintamaneni M., Phytother. Res., 29, 785–790 (2015).
- 42) Pan Y., Tiong K. H., Abd-Rashid B. A., Ismail Z., Ismail R., Mak J. W., Ong C. E., Phytomedicine, 21, 1645–1650 (2014).
- 43) Rastogi H., Jana S., Phytother. Res., 28, 1873–1878 (2014).
- 44) Mullapudi T. V. R., Ravi P. R., Thipparapu G., Xenobiotica, 51, 1236–1246 (2021).
- 45) Darras F. H., Pang Y. P., Biochem. Biophys. Res. Commun., 489, 451–454 (2017).
- 46) Qu W., Liu X., BMC, 32, 1 (2018).
- 47) Tang P. F., Zheng X., Hu X. X., Yang C. C., Chen Z., Qian J. C., Cai J. P., Hu G. X., Drug Des. Devel. Ther., 14, 5129–5141 (2020).
- 48) Saini D., Kala M., Jain V., Sinha S., BMC Biotechnol., 5, 33 (2005).
- 49) Epand R. M., Shulga Y. V., Timmons H. C., Perri A. L., Belani J. D., Perinpanathan K., Johnson-McIntire L. B., Bajjalieh S., Dicu A. O., Elias C., Rychnovsky S. D., Topham M. K., Biochemistry, 46, 14225–14231 (2007).
- 50) Ethell B. T., Anderson G. D., Burchell B., Biochem. Pharmacol., 65, 1441–1449 (2003).
- 51) Barnes K. J., Rowland A., Polasek T. M., Miners J. O., Eur. J. Clin. Pharmacol., 70, 1097–1106 (2014).
- 52) Rendic S., Di Carlo F. J., Drug Metab. Rev., 29, 413–580 (1997).
- 53) Feng Q., Kumagai T., Nakamura Y., Uchida K., Osawa T., Xenobiotica, 32, 1033–1043 (2002).
- 54) Shi X., Yang S., Zhang G., Song Y., Su D., Liu Y., Guo F., Shan L., Cai J., Xenobiotica, 46, 467–476 (2016).
- 55) Ding W., Cao C., Gao Y., Zhou X., Lai Y., Xenobiotica, 50, 1267–1274 (2020).
- 56) Fujii-Kuriyama Y., Mimura J., Biochem. Biophys. Res. Commun., 338, 311–317 (2005).