Abstract
Dapagliflozin (DAPA), sodium-glucose co-transporter 2 (SGLT-2) inhibitor, is used to treat Type 2 diabetes. In this study, a highly sensitive and selective analytical method based on ultra-high performance liquid chromatography-high resolution mass spectrometry (UHPLC-HRMS) was established and validated for the determination of DAPA in rat plasma. The separation of DAPA and internal standard (DAPA-d5) were performed on a reversed-phase ACQUITY UPLC® BEH C18 column (100 × 3.0 mm, 1.7 µm). The mobile phase is composed of 0.1% formic acid in water (solvent A) and methanol (solvent B) in gradient elution. Under the negative ion mode, full MS/dd-MS2 was adopted to collect data via Q-Orbitrap. DAPA was effectively separated from matrix backgrounds within 10 min, and DAPA in plasma showed a good linear relationship in the range of 10–10000 µg/L. The determination coefficient (R2) was 0.9987, and the lower limit of quantification (LLOQ) was 10 µg/L. The precision and accuracy were all less than 10%, and the extraction recovery of DAPA was 86.16–96.06% from plasma. This study offered an efficient separation and quantification method for DAPA. The improved and validated method succeeded in evaluating the pharmacokinetics of DAPA in rat plasma samples after a single oral administration of 1 mg/kg.
Introduction
It is estimated that about 537 million adults (20–79 years old) suffer from diabetes, and this number is predicted to increase to 643 million by 2030 and 783 million by 2045.1) Type 2 diabetes mellitus (T2DM) accounts for approximately 90% of all diabetes.2,3) Asia is the main area of T2DM, of which China and India are the two major diabetic countries.4) T2DM is a chronic and heterogeneous disease with a variety of causative and potentiating factors, such as obesity, bad lifestyle, genetics, epigenetics, and early developmental factors.5–8) Besides, T2DM can lead to complications in many parts of the body and may arise the overall risk of premature death.9) Many existing treatments for T2DM, especially those that rely on insulin action mechanisms, have side effects like hypoglycemia and weight gain.10,11) In recent years, the kidney has been paid attention to as a new target of glucose lowering treatment. Among them, sodium-glucose transporter 2 (SGLT2) inhibitor is a novel hypoglycemic drug that targets the kidney and is mainly located in renal tubules and glomeruli.12,13) It can eliminate glucose toxicity and reduce burden on pancreatic beta cells.14)
Dapagliflozin (DAPA) is one of the most representative SGLT2, and its chemical structure is presented in Fig. 1. It can reduce blood glucose concentration by decreasing the reabsorption of glucose, thus increasing glucose excretion in the kidney, independent of the role of insulin.15,16) Compared with baseline, DAPA at 25–100 mg can reduce the reabsorption of glucose by nearly 40%.17) In diabetic patients, DAPA can promote weight loss by inducing control of glucosuria with urinary loss (200–300 kcalories/d).18) Clinically, DAPA possesses good oral activity and bioavailability.19) However, DAPA has been proven to be less effective in patients with moderate renal insufficiency; it is therefore not recommended for patients with moderate to severe nephropathy.20) DAPA is mainly metabolized through the liver.21) Once liver function is impaired, the accumulation of drugs in the body may result in a series of adverse reactions. Given this, it is extremely important to determine the content of DAPA in vivo.
Recently, several studies have been reported to analyze DAPA using HPLC or HPLC-MS/MS methods.21–27) Singh et al. established an RP-HPLC method coupled with a photo diode array (PDA) detector to analyze DAPA and saxagliptin in a fixed-dose combination, which exhibited a limit of detection of 0.32 µg/mL, deficiency existed in terms of sensitivity.22) Aubry et al. used a solid phase extraction (SPE)-HPLC-TSQ-MS/MS method to detect DAPA in normal and diabetic rat plasma.26) A SPE-LC-QQQ method was also performed to simultaneously estimate the new antidiabetic combination of DAPA and saxagliptin.21) However, previous methods for the determination of DAPA in complex plasma samples and pharmacokinetic studies are often time-consuming or insensitive and lack selectivity. Thus, it is necessary to establish a high-resolution analysis approach to detect DAPA in the complex biological matrix, and further study its pharmacokinetic behavior to clarify its mechanism of action in vivo.
This paper establishes an accurate, rapid, and sensitive ultra-high performance liquid chromatography (UHPLC)-Q-orbitrap MS method to determine DAPA in rat plasma. The plasma samples were treated with simple solvent extraction and filtration with stable-isotope-labeled DAPA (DAPA-d5) as an internal standard (IS). The analysis time was only 10 min. The established method was validated and used to investigate the pharmacokinetics of DAPA in rats. This study was expected to provide a reference for understanding the mechanism of action of DAPA and further clinical efficacy studies.
Results and Discussion
Method DevelopmentOptimization for the Extraction Solvent and VolumeIn the process of solvent extraction, the choice of extraction solution is very important. In this study, four commonly used reagents, including methanol (MeOH), acetonitrile (ACN), isopropyl alcohol (IPA), and ethyl acetate (EA), have been compared for the extraction of DAPA and DAPA-d5 from plasma samples. Plasma is rich in proteins, thus it is necessary to precipitate them. According to the experiments, ACN showed the optimal protein precipitation effect and the highest recovery data, thus it has been chosen as the extraction solvent (Supplementary Fig. S1a). Then, in order to achieve the best extraction efficiency, the volumes (100, 200, 400, and 800 µL) of ACN were optimized (Supplementary Fig. S1b). The result revealed that a significant increase in recoveries was observed between 100 and 400 µL. However, there is no significant difference between 400 and 800 µL. Based on this, we decided to extract the targets from plasma using 400 µL of ACN in order to decrease the use of organic solvents and shorten the nitrogen blowing time.
Optimization of Chromatographic ConditionThe core of the chromatographic system is the column. During the process of method development, the resolution of the analytes will be greatly affected by the change of the column. In this part, a DAPA standard (20 µg/L) prepared in MeOH was used as the object to assess the actions of three different chromatographic columns (ACQUITY UPLC® BEH C18 column (100 × 3.0 mm, 1.7 µm), ACQUITY UPLC HSS T3 column (100 × 2.1 mm, 1.8 µm), and Agilent Eclipse XDB-C18 column (100 × 2.1 mm, 1.8 µm)). Ultimately, the ACQUITY UPLC® BEH C18 column (100 × 3.0 mm, 1.7 µm) showed the best analysis result considering the separation effect, peak width, and peak tailing. A short analysis time of 10 min has been achieved.
The mobile phase also plays an important role in obtaining good chromatographic behavior with appropriate retention time, high signal response, and good peak shape. MeOH and water were selected as mobile phases. In addition, the addition of acid to the mobile phase can improve the signal strength and help better reproducibility compared to the absence of acid. In this experiment, four different concentrations of formic acid (FA) (0.02, 0.05, 0.1 and 0.2%) were tested as potential additives. The results showed when the concentration of FA added to the mobile phase increased from 0.02 to 0.1%, the signal intensity increased significantly. However, when the acid concentration was further increased, there was no significant change in the signal response. Finally, MeOH-water containing 0.1% FA was chosen as the mobile phase.
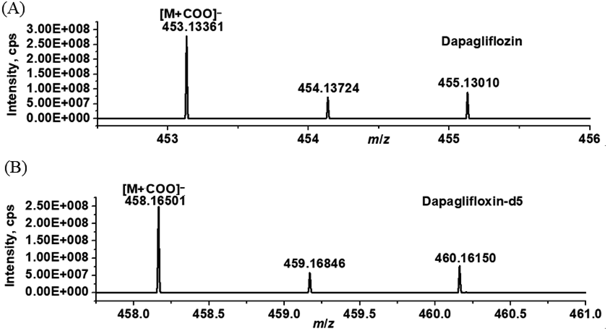
Optimization of MS ConditionScanning the DAPA standard solution in electrospray ionization (ESI) positive ion and negative ion modes, it was found that the peak response of DAPA in negative ion mode was better than that in positive ion mode. Molecular ions peak at an m/z 453.13361 ([M + COO]−) for DAPA and an m/z 458.16501 ([M + COO]−) for DAPA-d5 were observed in the presence of FA. The mass spectrogram of DAPA and IS were shown in Fig. 2. The precursor→product transitions of m/z 453.13361→329.09650 for quantitative analysis and m/z 453.13361→119.96657 for qualitative purpose of DAPA. For IS, m/z 458.16501→334.12851 were employed for quantitation and m/z 458.16501→ 119.97192 for qualitative studies (Fig. 3).
Method ValidationFigure 4 showed the extraction ion chromatogram of DAPA and DAPA-d5 in blank plasma (A1–A2) and plasma spiked at 20 µg/L standard solutions (B1–B2). As seen from chromatograms, no significant endogenous interference was found at the retention time of 4.89 min (DAPA) and 4.49 min (IS), indicating that the established method’s selectivity was satisfactory.
Seven different concentrations (10, 50, 100, 500, 1000, 5000, 10000 µg/L) of DAPA were prepared for linearity studies. The linear regression equation of DAPA was y = 0.0621x − 0.412 with a determination coefficient (R2) of 0.9987. The results showed that the peak area had a good correlation with the drug concentration in the selected concentration range. The lower limit of quantification (LLOQ) was detected at the signal-to-noise ratio (S/N) = 10. The results presented that LLOQ for DAPA was 10 µg/L, which was sufficient for pharmacokinetic studies of DAPA after oral administration to rats.
Intra- and inter-day precision and accuracy of DAPA at three QC levels were shown in Table 1. The precision (relative standard deviation (RSD)%) ranged from 2.89 to 7.02%. The accuracy (relative error (RE)%) was between −8.89 and 4.18%. The results testified that the established method to analyze DAPA was accurate and reproducible.
Table 1. Intra- and Inter-day Precision and Accuracy, Recoveries, Matrix Effects, and Stability of DAPA
| Parameters | Low QC (10 µg/L) | Mid QC (500 µg/L) | High QC (10000 µg/L) |
|---|
| Intra-day (n = 6) (%) | RSD | 4.25 | 2.89 | 4.29 |
| RE | 3.05 | −2.37 | 3.23 |
| Inter-day (n = 6) (%) | RSD | 5.67 | 5.29 | 7.02 |
| RE | −7.25 | −5.45 | −7.71 |
| Extraction recovery (%) | 91.27 ± 4.13 | 96.06 ± 5.35 | 86.16 ± 5.64 |
| Matrix effect (%) | 91.26 ± 5.15 | 94.57 ± 4.89 | 92.15 ± 2.18 |
| Stability (%) | Short-term | 94.14 ± 3.15 | 92.14 ± 3.68 | 92.16 ± 3.16 |
| Long-term | 83.16 ± 5.63 | 90.24 ± 5.79 | 92.50 ± 5.31 |
| Freeze-thaw | 86.18 ± 6.03 | 92.65 ± 4.98 | 95.21 ± 5.23 |
| Post-preparative | 94.27 ± 3.31 | 93.71 ± 2.34 | 95.25 ± 3.24 |
It can be knowable from Table 1 that the extraction recoveries of DAPA in three QC levels were in the range of 86.16–96.06% with RSD less than 10%. The results demonstrated no significant loss of DAPA after pretreatment. The matrix effect of DAPA was in the range of 91.26 to 94.57% (RSD: 2.18–5.15%), which indicated that there was little matrix interference in rat plasma.
The stability of the DAPA stored under different conditions was evaluated and the results were shown in Table 1. The RSDs of DAPA was in the range of 2.34–6.03%, indicating that the analyte was stable at room temperature for 8 h, at −20 °C for 30 d, at auto-sampler for 24 h, and after three freeze-thaw cycles.
Pharmacokinetic StudyThe developed UHPLC-Q-Orbitrap MS method was successfully used in the pharmacokinetic study of rat plasma after oral administration of DAPA. The mean plasma concentration-time curve of DAPA was depicted in Fig. 5, and the obtained parameters were listed in Table 2. As shown in Fig. 5, after oral administration, the plasma DAPA concentration increased firstly and then decreased, and reached the equilibrium around 12 h. Cmax in plasma samples was 843.133 ± 1.351 µg/L. The t1/2 of DAPA was 5.020 ± 0.626 h. The data obtained in this experiment are comparable with those in previous studies in which the elimination t1/2 in rats after oral administration were 4.6 ± 0.8 and 5.24 ± 0.34 h, respectively.28,29)
Table 2. The Pharmacokinetic Parameters of DAPA in Plasma (
n = 6)
| Pharmacokinetic parameters | DAPA |
|---|
| t1/2 | h | 5.020 ± 0.626 |
| Tmax | h | 0.542 ± 0.325 |
| Cmax | µg/L | 843.133 ± 1.351 |
| AUC(0–t) | µg/L·h | 5389.588 ± 74.117 |
| AUC(0–∞) | µg/L·h | 5578.116 ± 82.126 |
| MRT(0–t) | h | 8.016 ± 2.675 |
| CL/F | L/h/kg | 0.19 ± 0.051 |
| Vz/F | L/kg | 1.31 ± 0.220 |
Currently, a limited number of LC-based methods for the determination of DAPA in different sample matrices has been reported. The comparison of analytical performance between the method used in this experiment and the previously reported methods was shown in Supplementary Table S1. Compared with LC-UV method, which is often used for relatively clean sample determination, liquid chromatography-tandem mass spectrometry (LC-MS/MS) method shows higher sensitivity and wider linear range. Three LC-QQQ-MS methods for the quantification of DAPA or several hypoglycemic agents have been reported that demonstrated fast liquid phase separation speed and low LLOQ. In contrast, Q-Orbitrap MS, as a kind of high-resolution mass spectrometry (HRMS), has the competitive advantage of extremely high resolution (up to 280000 FWHM) for accurate target recognition, reducing interference with adjacent mass-to-charge ratio components in complex matrices, and has comparable sensitivity.30) In addition, the direct solvent extraction method was simple and time-saving, and superb recovery manifested the reliability of the method. The combination of UHPLC and Q-Orbitrap has shown potential in the qualitative and quantitative applications of DAPA due to its simple operation, high resolution, and good sensitivity.
Conclusion
A highly selective, rapid, and sensitive UHPLC-Q-Orbitrap MS method was established to determine DAPA in rat plasma and used to investigate the pharmacokinetics in rats. Compared with previous methods, this method had a shorter run time with the total analysis time of DAPA and IS less than 10 min, high sensitivity with an LLOQ of 10 µg/L for DAPA, and a simpler pretreatment procedure. The validated methods and results can provide useful evidence for clinical application.
Experimental
Reagents and ChemicalsStandard DAPA (purity ≥98%) and its stable-isotope-labeled DAPA-d5 (purity >98%) were obtained from Panphy Chemicals Corporation (LA, U.S.A.). HPLC-grade MeOH, ACN, isopropyl alcohol, and ethyl acetate were procured from Fisher Scientific (Waltham, MA, U.S.A.). FA (99.9%) was purchased from Sigma-Aldrich Corporation (Saint Louis, MO, U.S.A.). Ultra-pure water (18.2 MΩ cm at 25 °C) was obtained by the Millipore system (Millipore Corporation, Bedford, MA, U.S.A.).
Instrument and Analytical ConditionsChromatographic separation was carried out on a Thermo Finnigan HPLC system (ThermoFisher Scientific) consisting of a Surveyor MS pump, a Surveyor PDA detector, an autosampler, and Xcalibur TM 1.3 software. The analytical column was a reversed-phase ACQUITY UPLC® BEH C18 column (100 × 3.0 mm, 1.7 µm), and the column temperature was kept at 30 °C. DAPA was separated using MeOH (A) and 0.1% FA (B) as mobile phases at the flow rate of 0.3 mL/min and the injection volume of 2 µL. The gradient elution procedure was performed as follows: 0–0.5 min, 5% A; 0.5–1.0 min, 40% A; 1.0–5.0 min, 98% A; 5.0–5.5 min, 100% A; 5.5–6.0 min, 5% A; 6.0–10.0 min, 5% A.
MS analysis was carried out on a Q Exactive mass spectrometer (Thermo Fisher Scientific) using an ESI source in the negative ion and full MS/dd-MS2 mode. The scan ranges were set as 150–2000 m/z with a resolution of 17500 FWHM. MS was performed under the following conditions: spray voltage at 3.6 kV, capillary temperature at 350 °C, pressure for auxiliary gas at 10 arb, sheath gas at 40 psi, automatic gain control (AGC) target at 1 × 10⁶, the temperature of auxiliary gas at 320 °C, and maximum injection time (IT) at 50 ms.
Preparation of Stock Solutions, Calibration Standards, and Quality Control (QC) SamplesA stock solution of DAPA standard (1.0 mg/mL) in MeOH was prepared and diluted with MeOH into desired concentrations to obtain working solutions. The IS solution was dissolved in MeOH and prepared the concentration at 1 mg/mL. Minus twenty degree was the storage temperature for all solutions. Calibration curve concentrations were prepared at 10, 50, 100, 500, 1000, 5000 and 10000 µg/L for DAPA with 5000 µg/L of IS. The plasma samples were obtained by adding 20 µL of IS working solution (50000 µg/L) and 180 µL of ACN to 200 µL of blank rat plasma. Three kinds of QC samples with different concentrations (10 µg/L (low), 500 µg/L (medium), and 10000 µg/L (high)) for DAPA were prepared in blank plasma to evaluate the reliability of the method.
Method ValidationThe proposed UHPLC-Q-Orbitrap method for the determination of DAPA in rat plasma was verified according to U.S. Food and Drug Administration (FDA) Bioanalytical Method Validation.31) The validated parameters include selectivity, linearity, sensitivity, accuracy, precision, recovery, matrix effect, and stability.
SelectivitySelectivity was evaluated by comparing the chromatograms of blank plasma samples (n = 6) with the chromatograms of corresponding plasma samples spiked with DAPA and IS.
Linearity and SensitivityThe calibration curve was calculated according to y = ax + b, among which y was the ratio of the relative peak areas of DAPA to IS DAPA-d5, x was the concentration of DAPA, a and b were the constants obtained by the least squares regression analysis.
The LLOQ is considered the lowest concentration on the calibration curve at a satisfactory accuracy with RE ≤ 20% and precision with RSD ≤ 20%.
Precision and AccuracyPrecision and accuracy were calculated by QC samples of different concentrations (10, 500, and 10000 µg/L). Six replicates were performed for each QC concentration to calculate the intra-day precision and accuracy. The inter-day precision and accuracy were determined by analyzing the above three groups of QC samples on six different days.
Recovery and Matrix EffectThe extraction recoveries of DAPA were obtained at three QC concentration levels. After DAPA was added to the blank plasma samples and extracted according to the pretreatment process above, the peak areas obtained were considered to be A. The peak areas of the target spiked into the post-extraction supernatant were regarded as B. The peak areas obtained from standard solutions at equivalent concentrations were C. Based on the above, recovery (A/B × 100%) and matrix effects (B/C × 100%) were obtained.
StabilityThe stability of DAPA in rat plasma samples was examined by the determination of QC samples with different concentrations (n = 6). QC samples were placed at room temperature for 8 h to investigate short-term stability. After being placed at −20 °C for 30 d, long-term stability was observed. QC samples were cycled through freezing (−80 °C)-thawing (room temperature) 3 times to obtain freeze-thaw stability. Keep the sample in the automatic sampler for 24 h to obtain post-preparative stability.
Pharmacokinetic StudyAdult Wistar rats (equal number of males and females, 220–250 g) were obtained by laboratory animal center of Nantong University. All rats were acclimatized in laboratory conditions for 10 d before the experiment at a temperature of 22–23 °C, with a humidity of 70%, and under a 14:10 h light: dark cycle schedule. The study was approved by the Ethical Committee of Affiliated Hai’an Hospital of Nantong University.
Pharmacokinetic studies were performed in fasted, healthy rats. Rats were fed with laboratory standard food and free drinking water. During the fasting period, rats can have free access to water. The rats were given 1 mg/kg DAPA (dissolving DAPA in 0.9% sodium chloride) at a single dose by oral administration. At 5, 15, 30, 45 min, 1, 1.5, 2, 4, 8, 12, and 24 h after administration, took 1 mL blood sample and mixed into heparinized test tubes (n = 6/time point). The blood samples were centrifuged at 4000 rpm for 5 min, and the upper plasma was taken out and stored in a refrigerator (−20 °C). A plasma sample (0.2 mL), IS (50000 µg/L, 0.02 mL), and ACN (0.18 mL) were mixed in a 1.5 mL centrifuge tube, vortexed for 5 min, and then centrifuged at 8000 rpm for 5 min. The supernatant was injected into the UPLC-Q-Orbitrap system.
The time to reach maximum plasma concentration (Tmax) and maximum plasma concentration (Cmax) were directly obtained from the measured data. Pharmacokinetic parameters, including area under the concentration–time curve from zero up to a definite time AUC(0–t), area under the concentration–time curve from zero up to infinite time AUC(0–∞), the half-life of elimination phase (t1/2β), the half-life of distribution phase (t1/2α), the half-life of absorption phase (t1/2Ka), the volume of distribution (Vz/F), total clearance (CL/F), and mean residence time (MRT) was calculated using DAS 2.0 software (Chinese Pharmacological Society). Data were expressed as mean ± standard deviation (S.D.).
Acknowledgments
This work was supported by the Science and Technology Project of Nantong (JCZ19026).
Author Contributions
Lin-jiao Wang: Writing—review & editing. Wei Xi: Supervision. Xiao-lan Yuan: Supervision. Xiao-hua Yang: Conceptualization, Validation.
Conflict of Interest
The authors declare no conflict of interest
Data Availability
The data that support the findings of this study are available from the corresponding author upon reasonable request.
Supplementary Materials
This article contains supplementary materials.
References
- 1) “IDF Diabetes Atlas 10th Edition.”: ‹https://diabetesatlas.org/›, cited 6 December, 2021.
- 2) Bailey C. J., Day C., Br. Med. Bull., 126, 123–137 (2018).
- 3) Smushkin G., Vella A., Medicine, 47, 687–691 (2018).
- 4) Daousi C., Casson I. F., Gill G. V., MacFarlane I. A., Wilding J. P. H., Pinkney J. H., Postgrad. Med. J., 82, 280–284 (2006).
- 5) Zheng Y., Ley S., Hu F., Nat. Rev. Endocrinol., 14, 88–98 (2018).
- 6) Chen L., Magliano D., Zimmet P., Nat. Rev. Endocrinol., 8, 228–236 (2011).
- 7) Schellenberg E. S., Dryden D. M., Vandermeer B., Ha C., Korownyk C., Ann. Intern. Med., 159, 543–551 (2013).
- 8) Ong T. P., Ozanne S. E., Curr. Opin. Clin. Nutr. Metab. Care, 18, 354–360 (2015).
- 9) Kuroda S., Kobashi Y., Kawamura M., Kawabe K., Shiozawa F., Hamada M., Shimizu Y., Okumura-Kitajima L., Koretsune H., Kimura K., Yamamoto K., Kakinuma H., Chem. Pharm. Bull., 68, 635–652 (2020).
- 10) Jerram S., Leslie R. D., Genes, 8, 209 (2017).
- 11) Fukuda M., Doi K., Sugawara M., Naka Y., Mochizuki K., J. Clin. Med. Res., 7, 967–978 (2015).
- 12) Choi C.-I., Molecules, 21, 1136 (2016).
- 13) Hung H. Y., Qian K., Morris-Natschke S. L., Hsuc C. H., Lee K. H., Nat. Prod. Rep., 29, 580–606 (2012).
- 14) Horikawa T., Hiramoto K., Tanaka S., Ooi K., Biol. Pharm. Bull., 45, 934–939 (2022).
- 15) Yang L., Li H., Li H., Bui A., Chang M., Liu X., Kasichayanula S., Griffen S. C., LaCreta F. P., Boulton D. W., Clin. Ther., 35, 1211–1222.e2 (2013).
- 16) Meng W., Ellsworth B. A., Nirschl A. A., et al., J. Med. Chem., 51, 1145–1149 (2008).
- 17) Komoroski B., Vachharajani N., Boulton D., Kornhauser D., Geraldes M., Li L., Pfister M., Clin. Pharmacol. Ther., 85, 520–526 (2009).
- 18) Wilding J. P., Norwood P., T’joen C., Bastien A., List J. F., Fiedorek F. T., Diabetes Care, 32, 1656–1662 (2013).
- 19) Balakumar P., Sundram K., Dhanaraj S. A., Pharmacol. Res., 82, 34–39 (2014).
- 20) Fioretto P., Giaccari A., Sesti G., Cardiovasc. Diabetol., 14, 142 (2015).
- 21) Filippatos T. D., Liberopoulos E. N., Elisaf M. S., Ther. Adv. Endocrinol. Metab., 6, 29–41 (2015).
- 22) Singh N., Bansal P., Maithani M., Chauhan Y., New J. Chem., 42, 2459–2466 (2018).
- 23) Sanagapati M., Dhanalakshmi K., Nagarjuna R. G., Sreenivasa S., J. Adv. Pharm. Educ. Res., 4, 350–353 (2014).
- 24) Sanagapati M., Dhanalakshmi K., Reddy G. N., Sreenivasa S., Int. J. Pharm. Sci. Drug Res., 6, 270–272 (2014).
- 25) Debata J., Kumar S., Jha S. K., Khan A., Int. J. Drug Dev. Res., 9, 48–51 (2017).
- 26) Aubry A. F., Gu H., Magnier R., Morgan L., Xu X., Tirmenstein M., Wang B., Deng Y., Cai J., Couerbe P., Arnold M., Bioanalysis, 2, 2001–2009 (2010).
- 27) Hess C., Musshoff F., Madea B., Anal. Bioanal. Chem., 400, 33–41 (2011).
- 28) Obermeier M., Yao M., Khanna A., Koplowitz B., Zhu M., Li W., Komoroski B., Kasichayanula S., Discenza L., Washburn W., Meng W., Ellsworth B. A., Whaley J. M., Humphreys W. G., Drug Metab. Dispos., 38, 405–414 (2009).
- 29) Surendran S., Paul D., Pokharkar S., Deshpande A., Giri S., Satheeshkumar N., Anal. Methods, 11, 219–226 (2019).
- 30) Kaufmann A., Trends Analyt. Chem., 63, 113–128 (2014).
- 31) “Bioanalytical Method Validation Guidance for Industry.”: ‹https://www.Fda.Gov/files/drugs/published/›, cited 24 May, 2018.