Abstract
In order to introduce a cost-effective strategy method for commercial scale dry granulation at the early clinical stage of drug product development, we developed dry granulation process using formulation without API, fitted and optimized the process parameters adopted Design of Experiment (DOE). Then, the process parameters were confirmed using one formulation containing active pharmaceutical ingredient (API). The results showed that the roller pressure had significant effect on particle ratio (retained up to #60 mesh screen), bulk density and tapped density. The roller gap had significant influence on particle ratio and specific energy. The particle ratio was significantly affected by the mill speed (second level). The tabletability of the powder decreased after dry granulation. The effect of magnesium stearate on the tabletability was significant. In the process validation study, the properties of the prepared granules met the requirements for each response studied in the DOE. The prepared tablets showed higher tensile strength, good content uniformity of filled capsules, and the dissolution profiles of which were consistent with that of clinical products. This drug product process development and research strategies could be used as a preliminary experiment for the dry granulation process in the early clinical stage.
Introduction
High risk, long lead time to market, and being highly innovation-driven are a few facets of the pharmaceutical industry, the challenges and decline in research and development (R&D) productivity faced by the pharmaceutical industry place tremendous pressure on its success. The U. S. Food and Drug Administration (FDA) has introduced several expedited programs to speed the development and review of drugs to treat diseases with severe unmet needs.1) This has given a huge boost to the development of new drugs, such as osimertinib (TAGRISSOTM), an Epidermal Growth Factor Receptor (EGFR) inhibitor, which was approved for lung cancer by the FDA following a clinical development period of just over 2.5 years.2) In 2022, CDER approved 37 novel drugs, either as new molecular entities (NMEs) under New Drug Applications (NDAs), or as new therapeutic biological products under Biologics License Applications (BLAs). The active ingredient(s) in a novel drug has never been approved in the U.S.3)
In recent years, National Medical Products Administration (NMPA) has many positive attempts to accelerate the review and approval of innovative drugs, aiming to drive the development of domestic enterprises and the innovation investment, transformation, and upgrading of generic drug enterprises. In 2017, China National Drug Evaluation Center accepted 181 varieties of IND/NDA,4) 222 varieties in 2018,5) 244 varieties in 2019,6) and 258 varieties in 2020,7) overall increasing year by year.
Although the number of applications for IND/NDA in China was increasing year by year, the challenges and decline in research and development productivity remained because of lacking experience in the pharmaceutical industry.8,9) In the early clinical stages of drug discovery, drug development is challenging due to uncertainties in dose specifications, high price of active pharmaceutical ingredient (API), and short clinical sample preparation time. In general, in the early stage of candidate drug development, API availability is limited and the cost is high. In the scale-up process, a large number of API are needed to study and confirm the commercial scale drug product process, which often means huge costs and is time-consuming.
To address the problem of inefficient research and development, AstraZeneca scientists used a suite of in-house, commercial predictive tools to accelerate product development through integrated computer modeling methods. For example, they use GastroPlusTM, for oral drug absorption is well-established in drug development research. Some software inputs density and dose of API, calculates the relationship between API particle size and limit of content uniformity for tablet and capsule dosage forms assuming random mixing, etc. The method used dry granulation in formulation development to guide scale-up production to achieve “first time right.” They proposed a prediction-based scientific analysis strategy that provided a comprehensive approach for robust, scientific product development by integrating project knowledge and risk-based approaches, achieving significant savings in API, excipients, and packaging systems.10)
Dry granulation is commonly used in the pharmaceutical industry to increase the flowability of powders by forming granules of larger size and higher density.11,12) In the roller compaction process, a powder blend containing API and excipients passes through two counter-rotating rollers that compact the blend into ribbons, and then the ribbons subsequently are milled into granules of a desired size distribution that are mixed with the lubricant (e.g., magnesium stearate) and/or external mixture before tableting or capsule filling. Nowadays, roller compactors are usually incorporated with milling operation.
Most of scalability studies in the roll compaction process available focus their efforts on developing models to successfully scale-up the process.13–19) There are several approaches that can be used for scaling up or process transfer, either based on mechanical models, statistical methods, or based on hybrid modeling. Roll compactors on the market can be divided in systems with fixed gap width, where both rolls have a fixed position, and variable gap width, where only one roll is fixed (master roll) and the second one is movable (slave roll).20) This is important to consider in research and a critical step in the industry, as it is desirable that the results obtained in the laboratory can also be transferred to pilot, production or commercial scale. There are two scale-up strategies based on how the size of the rolls is modified between scales: one by changing the roll diameter together with the roll width, the other by just varying the roll width while keeping the diameter constant. Sheskey and Hendren21) performed a scale-up study using three compactors from Freund-Vector (TF-Mini, TF-156, and TF-3012) to transfer a drug-containing formulation where production conditions were optimized for the TF-Mini. However, limited work has been performed does not take into account that small-scale equipment may be made from different principles than commercially produced large-scale equipment.
Here, we also introduced a methodological strategy for commercial large-scale drug product process development of dry granulation in the early clinical stage of novel drug development. The strategy is a dry granulation process study using materials without API components (also can be called placebo formulation), which could greatly save research and development cost and improve research and development efficiency. In this study, we focused on the scale-up of dry granulation, which included ribbon formation process and milling process. As the granules are denser and larger compared to the pre-roller-compacted blend, the granules flow freely which results in consistent feeding to a tablet press or capsule filling. However, the trade-off of the roller compaction process is the reduction in compactability as a result of the powder being stressed, which may cause capping or lamination. Therefore, a balance between increased flowability and reduced compactability is a key consideration in the development of dry granulation processes. Type of roller compactor, feed screw speed, roller speed, roller pressure and roller gap may all affect the density and thickness of the ribbon during the ribbon formation, and maintaining the appropriate ribbon attributes (both ribbon density and thickness) during process scale-up is crucial for the development of solid dosage forms.
Although the unit operation of dry granulation has been widely studied, among different scale and types of roller compactors commercial experimental design to develop the dry granulation process development still needs to consume a large amount of API, especially in the early clinical development stage. The high cost and difficulty to obtain API limit the feasibility of preparation development research. To simplify the process to the commercial scale without affecting the drug product process robustness, we developed a method based on process development without API that could maximize the use of research data to simulate the subsequent development of drug-containing production processes. After the parameter range of the production process is determined, the formulation containing API is used to confirm the feasibility of the drug product process by evaluating the critical quality attributes before and after process scale-up. The API used in this study is an NME developed by our company, which has a molecular weight greater than 500, a melting point of 218.3 °C, a pH-dependent solubility, and is slightly hygroscopic. API has obvious pH dependence. With test methods described in USP42 <Description and Relative Solubility>, the solubility of the API are as follows: sparingly soluble in pH 1.2, slightly soluble in pH 2.0–3.0, very slightly soluble in pH 4.0–5.0, insoluble in pH 6.0–6.8. Based on the maximum dose used in phase I clinical study, the API is considered to be with low solubility as the maximum dose cannot completely dissolve in 250 mL buffer.
Experimental
A Brief Flow Chart of the Methodology StrategyTest Methods and MaterialsUsing about 15% (w/w) for commercial scale drug product process development of dry granulation, all excipients except for API were commercially available products, including pregelatinized starch (Starch 1500®, Colorcon, U.S.A., Lot: IN541670), microcrystalline cellulose (Microcellulose weissenborn® Type102, Lot: 56102207138, 56102209049, 56102200504, Germany), lactose (Molkerei Meggle, Germany, FlowLac100®, Batch Lot: L101503720), colloidal silica (Evonik, Germany, AEROSIL® 200 pharma, Lot: 159050314), sodium carboxymethyl starch (Taiwan Chemical Industry Co., Ltd., Taiwan, Type A, Lot: SSG7020064), magnesium stearate (Liaoning Aoda Pharmaceutical Co., Ltd., China, Lot: 20191204).
All the ingredients were mixed in a bin blender as follows: First, the pregelatinized starch and colloidal silica were added into the bin for 50 revolutions, and then compelled through a Quadro Comil (with a 1.0 mm screen opening). Second, lactose, sodium carboxymethyl starch, and microcrystalline cellulose were added into the bin for 100 revolutions. Third, magnesium stearate was added into the bin for 50 revolutions. The milling operation was used for enhanced local mixing, rather than size reduction. In the mixture, pregelatinized starch accounted for 57.04%, microcrystalline cellulose 27.97%, lactose 8.50%, colloidal silica 0.55%, sodium carboxymethyl starch 4.75%, and magnesium stearate 1.19%. After the powder was mixed, it was added to the roller compactor, and dry granulation was carried out according to the operational parameters. The formulation of placebo and formulation with API is presented in Table 1.
Table 1. The Formulation of Placebo and Formulation with API
| Placebo (%) | Formulation with API (%) |
|---|
| API | 0 | 15.38 |
| Pregelatinized starch | 57.04 | The prescription components were consistent with the placebo |
| MCC | 27.97 |
| Lactose | 8.50 |
| Colloidal silica | 0.55 |
| Sodium carboxymethyl starch | 4.75 |
| Magnesium stearate | 1.19 |
| Total | 100 | 100 |
The dry granulation process is developed on a DG150 roller compactor (Shandong Xinma Pharmaceutical Equipment Co., Ltd., China) with double screw feeding to ensure uniform distribution of materials at the roller. During horizontal screw feeding, a vacuum exhaust system is provided to remove the air generated during material compression, and the roller compactor includes ribbon forming and milling operations.
The operational parameters of the roller compactor mainly included feed screw speed, roller surface design, roller pressure, roller speed, roller gap, mill speed, and mill screen size. In this study, a 23 full factorial Design of Experiments (DOE) with three center points were included to evaluate if any curvature effects exist. The responses in this design were granules attributes (flowability, bulk density, tapped density, and particle size distribution), ribbon attributes (thickness, and ribbon density), and compactability under a condition with roller pressure 40–60 bar, roller gap 0.7–1.7 mm, and mill speed (second level) 90–170 rpm. The DOE test parameters of this study are mainly obtained by combining preliminary feasibility experiment, the factors such as the speed of feed screw and the surface design of roller have little influence on the powder properties of particles, the parameters with relatively good powder properties are fixed, and the range of parameters of roller pressure, roller gap, and mill speed were obtained. Statistical analysis of the DOE was completed with MiniTab 17 software.
Process study was performed according to DOE in Table 2. Other parameters of the equipment were set as fixed parameters: the roller with a knurled surface was selected, and the revolution speed of the crushing knife was 50 rpm. The size of the primary milling screen was 2.0 mm, the size of the secondary milling screen was 1.0 mm, and the primary milling revolution was 80% of the secondary milling revolution.
Table 2. Design of the 2
3 Full Factorial DOE to Study Roll Compaction and Integrated Milling Process Variables
| Factors: process variables | Levels |
|---|
| −1 | 0 | 1 |
|---|
| A | Roller pressure (bar) | 40 | 50 | 60 |
| B | Roller gap (mm) | 0.7 | 1.2 | 1.7 |
| C | Mill speed (second level) (rpm) | 90 | 130 | 170 |
| Responses | Goal | Acceptable ranges |
|---|
| Y1 | Ribbon density (g/mL) | 1.3 | 1.2–1.5 |
| Y2 | Particle ratio (above 60 mesh) | 0.20 | 0.15–0.30 |
| Y3 | Bulk density (g/mL) | 0.55 | 0.40–0.65 |
| Y4 | Tapped density (g/mL) | 0.70 | 0.65–0.80 |
| Y5 | Flow function (FF value) | Max | >4 |
| Y6 | Wall friction (WF) | / | / |
| Y7 | Stability index (SI) | 1 | 0.9–1.1 |
| Y8 | Specific energy (SE) | Min | Min |
| Y9 | Tensile strength | / | 1.7 MPa–2 MPa |
The design of full factorial 23 was shown in Table 2. Operational parameters were shown in Table 3.
Table 3. Experiment Design on DG150
| Number | A: Roller pressure (bar) | B: Roller gap (mm) | C: Mill speed (second level) (rpm) |
|---|
| F1 | 60 | 1.7 | 170 |
| F2 | 40 | 0.7 | 170 |
| F3 | 40 | 1.7 | 90 |
| F4 | 40 | 0.7 | 90 |
| F5 | 50 | 1.2 | 130 |
| F6 | 60 | 1.7 | 90 |
| F7 | 60 | 0.7 | 90 |
| F8 | 50 | 1.2 | 130 |
| F9 | 40 | 1.7 | 170 |
| F10 | 50 | 1.2 | 130 |
| F11 | 60 | 0.7 | 170 |
The ribbons before milling were sampled to determine the ribbon density and thickness. The density of the ribbons was determined using the weight and volume of ribbons disks cut from ribbon samples, which by adding certain weight of the ribbons into medium-chain triglycerides. Ribbon thickness was measured with a digital vernier caliper. The bulk density and tapped density of the milled granules were determined according to the requirements of USP <616 bulk density and tapped density of powders>.22) Granule flowability was determined by an FT4 powder rheometer (Freeman Technology, Gloucestershire, U.K.) for flow function (FF value), wall friction angle (WF), stability index (SI), and specific flow energy (SE). The particle size distribution was determined by the sieving method. Weighted particles were placed on the topmost layer, and then turn on the vibration. Material from each layer was quantified after vibration in turns. The compactibility of granules was determined by tableting the mixture of the prepared particles with 0.55% magnesium stearate with 8.0 mm round, biconvex tooling. Under the same tablet pressure conditions, samples with and without magnesium stearate were pressed to confirm the change of the tensile strength of granules.
Content Uniformity and Dissolution ProfilesHPLC method and UV method were used to detect drug content uniformity and dissolution profiles. The USP II method (paddle method) was used. The dissolution method selected for drug product development used 900 mL of 0.1N HCl and 900 mL of pH 4.0 aqueous media in a dissolution apparatus equipped with paddles (speed 50 rpm) and maintained at a temperature of 37 ± 0.5 °C, followed by UV spectroscopy (UV-2600, Shimadzu Corporation, Japan) at a wavelength of 324 nm.
High performance liquid chromatograph 1260 (Agilent Technologies, U.S.A.) was used for content uniformity. The validated reversed phase HPLC method employed an Agilent Zorbax SB-C-18 column (15 cm × 4.6 mm, 5 µm particle size) maintain at 25 °C with a mobile phase composed of 0.05% phosphoric acid solution–acetonitrile (v/v, 70 : 30) at a flow rate of 1.0 mL/min with detection at 234 nm.
Results
According to the test conditions given in the DOE test design, the ribbon density, bulk density and tapped density of granules, granule flowability (represented by FF value), wall friction angle (WF), stability index (SI) and specific flow energy (SE) were shown in Table 4. The factor equations for the DOE experiments were presented in Table 5.
Table 4. Results for the Roll Compaction and Integrated Milling DOE
| Number | A: Roller pressure (bar) | B: Roller gap (mm) | C: Mill speed (second level) (rpm) | Ribbon density (g/mL) | Bulk density (g/mL) | Tapped density (g/mL) | FF value | WF | SI | SE |
|---|
| Acceptable ranges | 1.2–1.5 | 0.40–0.65 | 0.65–0.80 | >4 | / | 0.9–1.1 | min |
| F1 | 60 | 1.7 | 170 | 1.28 | 0.630 | 0.788 | 7.59 | 7.05 | 0.964 | 4.29 |
| F2 | 40 | 0.7 | 170 | 1.33 | 0.579 | 0.720 | 3.86 | 8.47 | 1.02 | 4.31 |
| F3 | 40 | 1.7 | 90 | 1.30 | 0.577 | 0.720 | 4.58 | 8.15 | 0.97 | 4.31 |
| F4 | 40 | 0.7 | 90 | 1.26 | 0.574 | 0.722 | 4.72 | 7.57 | 1.03 | 4.40 |
| F5 | 50 | 1.2 | 130 | 1.34 | 0.586 | 0.730 | 4.62 | 7.41 | 1.09 | 4.30 |
| F6 | 60 | 1.7 | 90 | 1.29 | 0.602 | 0.752 | 5.54 | 7.24 | 0.988 | 4.19 |
| F7 | 60 | 0.7 | 90 | 1.32 | 0.597 | 0.749 | 3.73 | 7.44 | 1.06 | 4.28 |
| F8 | 50 | 1.2 | 130 | 1.29 | 0.584 | 0.730 | 6.64 | 7.08 | 1.00 | 4.24 |
| F9 | 40 | 1.7 | 170 | 1.27 | 0.574 | 0.730 | /* | 7.59 | 0.99 | 4.24 |
| F10 | 50 | 1.2 | 130 | 1.29 | 0.582 | 0.738 | 4.05 | 7.02 | 1.03 | 4.27 |
| F11 | 60 | 0.7 | 170 | 1.29 | 0.598 | 0.750 | /* | 7.29 | 1.03 | 4.33 |
* Note: No data were given for the test instrument.
Table 5. Correlation Regression Equation of Factors in DOE Experimental Design
| Factors | Regression equations |
|---|
| Strip density | Strip Density = 1.027 + 0.00410 × Roller Pressure + 0.075 × Roller Gap + 0.00185 × Mill Speed − 0.00050 × Roller Pressure × Roller Gap − 0.000025 × Roller Pressure × Mill Speed − 0.000500 × Roller Gap × Mill Speed +0.0142 × Ct Pt |
| Bulk density | Bulk Density = 0.6233−0.00073 × Roller Pressure − 0.0554 × Roller Gap − 0.000468 × Mill Speed + 0.000975 × Roller Pressure × Roller Gap +0.000008 × Roller Pressure × Mill Speed+ 0.000119 × Roller Gap × Mill Speed − 0.00738 × Ct Pt |
| Tapped density | Tapped Density = 0.7708 − 0.000331 × Roller Pressure − 0.0672 × Roller Gap − 0.000665 × Mill Speed + 0.000825 × Roller Pressure × Roller Gap +0.000009 × Roller Pressure × Mill Speed+ 0.000294 × Roller Gap × Mill Speed − 0.00871 × Ct Pt |
| FF value | FF value = 17.0 − 0.281 × Roller Pressure − 4.04 × Roller Gap − 0.0835 × Mill Speed+ 0.098 × Roller Pressure × Roller Gap + 0.00182 × Roller Pressure × Mill Speed+ 0.16 × Ct Pt |
| WF | WF = 6.49 − 0.0027 × Roller Pressure + 1.21 × Roller Gap + 0.0219 × Mill Speed − 0.0035 × Roller Pressure × Roller Gap − 0.000213 × Roller Pressure × Mill Speed − 0.00938 × Roller Gap × Mill Speed − 0.430 × Ct Pt |
| SI | SI = 0.906 + 0.00444 × Roller Pressure − 0.026 × Roller Gap + 0.00059 × Mill Speed − 0.00120 × Roller Pressure × Roller Gap − 0.000020 × Roller Pressure × Mill Speed + 0.000225 × Roller Gap × Mill Speed +0.0335 × Ct Pt |
| SE | SE = 5.234 − 0.01562 × Roller Pressure − 0.167 × Roller Gap − 0.00540 × Mill Speed+ 0.00075 × Roller Pressure × Roller Gap + 0.000097 × Roller Pressure × Mill Speed + 0.000438 × Roller Gap × Mill Speed − 0.0238 × Ct Pt |
*Note: The Ct Pt of regression equations means center point.
As shown in Table 4, within the roller pressure range of 40–60 bar and the roller gap range of 0.7–1.7 mm, the ribbon density was equivalent (1.27–1.34 g/mL). As shown in Fig. 1, it was a semi-normal plot of the normalization effect, which could determine the size and importance of the effect. The further away from the red statistical significance reference line in the figure, the more statistically significant the effect was. Figure 1 shows that at the level of 0.05, neither the roller pressure nor the roller gap had a significant effect on the ribbon density.
The ribbon thickness is different under different processing conditions (Table 6), which indicated different ribbon porosity. The thicknesses of the ribbon were highly related to the roller gap set value, and this roller compactor worked to monitor the roller gap to automatically adjust the feed screw speed. Combined with Table 4 and data of tabletability (Table 7), with the same roller gap of 0.7 mm, the granules prepared under the lower roller pressure (40 bar) had higher tensile strength under the same compression force (150 MPa). However, under the condition of low roller pressure (40 bar), with the increase of roller gap, the tabletability decreases because of granule size enlargement, but the FF value of granules was basically the same, and no significant improvement was observed. By comparing the particles prepared with F2 and F4 parameters, the tabletability of granules was the same, indicating that the milling speed had little influence on the tabletability of granules under the condition of 40bar roller pressure. It showed that at low pressure, the rolling speed might only affect the speed of particle formation, but because the roll gap was constant, the powder properties of the particles themselves did not change significantly, so it would not have a significant impact on the performance of the tablet. At the high roller pressure (60 bar) and the roller gap of 1.7 and 0.7 mm, there was no difference in tabletability of granules between the two gap widths, although the ribbon thickness was different. This indicated that under the condition of higher roller pressure, the deformation and bonding of particles were more significant. It has therefore been suggested to describe this phenomenon as granule hardening.
Table 6. Ribbon Thickness under Different Process
| Number | F1 | F2 | F3 | F4 | F5 | F6 | F7 | F8 | F9 | F10 | F11 |
|---|
| Average ribbon thickness (mm) | 3.55 | 2.53 | 3.63 | 2.46 | 3.31 | 3.92 | 2.87 | 3.38 | 3.85 | 3.37 | 2.75 |
Table 7. Results of Tabletability after Granulation
| Number | F1 | F2 | F3 | F4 | F5 | F6 | F7 | F8 | F9 | F10 | F11 |
|---|
| Granules from roller compacted (MPa) | 0.52 | 0.86 | 0.69 | 0.81 | 0.71 | 0.61 | 0.67 | 0.70 | 0.71 | 0.85 | 0.56 |
| Granules from roller compacted mixing magnesium stearate (MPa) | 0.34 | 0.54 | 0.54 | 0.55 | 0.46 | 0.37 | 0.40 | 0.49 | 0.54 | 0.47 | 0.36 |
The particle size distribution of dry granulation was determined by screening and weight granules larger than 60 mesh to calculate the particle ratio. Particle size distribution was shown in Table 8, the particle size distribution diagram was shown in Fig. 2, and data of particle size greater than 60 mesh was shown in Table 9 and Fig. 3.
Table 8. Experimental Results of Particle Size Distribution
| Granularity distribution | Occupy% |
|---|
| F1 | F2 | F3 | F4 | F5 | F6 | F7 | F8 | F9 | F10 | F11 | MD | GSD |
|---|
| > 20 orders | 1.19 | 1.55 | 1.12 | 1.33 | 1.27 | 1.46 | 2.7 | 1.56 | 0.77 | 0.66 | 2.21 | 1.33 | 5.7 |
| 20–40 | 12.25 | 10.48 | 7.92 | 12.81 | 13.16 | 17.2 | 19.29 | 13.99 | 7.69 | 10.83 | 15.71 | 12.81 | 99.4 |
| Entry 40–Entry 60 | 6.78 | 5.62 | 8.42 | 7.37 | 7.45 | 7.38 | 8.86 | 7.48 | 6.94 | 6.83 | 8.43 | 7.38 | 69.1 |
| 60–80 | 12.43 | 15.29 | 18.8 | 18.51 | 18.43 | 16.61 | 13.73 | 13.22 | 15.5 | 14.6 | 13.02 | 15.29 | 115.0 |
| 80 Entry–100 Entry | 21.68 | 29.45 | 34.38 | 30.19 | 22.82 | 27.07 | 21.77 | 27.95 | 28.64 | 23.59 | 26.28 | 27.07 | 151.9 |
| 100 Entry–120 Entry | 6.64 | 6.72 | 8.46 | 4.83 | 6.36 | 4.47 | 7.22 | 6.24 | 11.85 | 9.7 | 6.62 | 6.64 | 64.8 |
| <120 orders | 38.95 | 30.88 | 20.9 | 24.97 | 30.51 | 25.82 | 26.43 | 29.21 | 28.62 | 33.76 | 27.74 | 28.62 | 156.8 |
* Note: MD means median diameter, GSD means geometric standard deviation.
Table 9. Summary of Particle Ratio
| Number | F1 | F2 | F3 | F4 | F5 | F6 | F7 | F8 | F9 | F10 | F11 |
|---|
| More than 60 entries% | 20.22 | 17.65 | 17.46 | 21.51 | 21.88 | 26.04 | 30.85 | 23.03 | 15.4 | 20.12 | 26.35 |
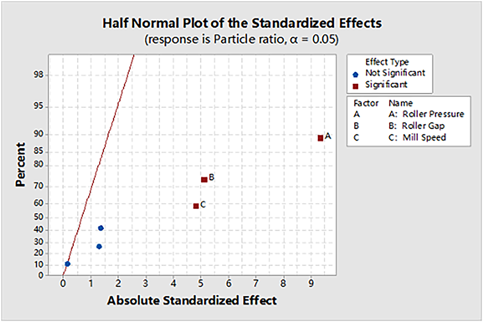
According to the statistical analysis results and the half-normal plot of process variables affecting particle ratio in Fig. 4, the significant factors affecting particle ratio were roller pressure (A), roller gap (B), and mill speed (C), and there was no interaction between them. The main effect plot (Fig. 5), shows the three parameters exhibited a strong interaction, and the main effect had a significant effect. The effect of roller gap and roller pressure on particles is shown in Fig. 6.
Influence of Bulk Density and Tapped DensityBulk density and tapped density were the key factors of tabletability of granules,23) and the specific operation could be conducted with reference to the methods described in USP<616>. The bulk density of the mixture was determined, as shown in the half-normal plot (Fig. 7), and the significant factor affecting the bulk density was roller pressure (A) with no interaction with other process parameters. The tapped density of the mixture was determined, as shown in the half-normal plot (Fig. 8), and the significant factor affecting the particle ratio was the roller pressure (A), without any effect caused by interaction.
Significant Factors Affecting Granule PropertiesThe shear box (FT4 powder rheometer, Freeman technology, Gloucestershire, U.K.) was used to determine the powder parameters of the particles such as FF value, wall friction angle, particle stability index, and specific flow energy index. They were used to confirm whether the granules could be continuously and fully discharged in the equipment relying on gravity. When the pressure imposed on the powder exceeded the pressure the powder could bear, the powder in any state would flow. This ability varied across particles, depending on cohesive strength. The Jenike shear cell assay was the most accepted method and was introduced in the ASTM standard D6128.24) The flowability (represented by FF value) of granules after milling was determined using a FT 4 powder rheometer. As shown in half-normal (Fig. 9), roller pressure, roller gap, and mill speed had no significant effect on granule flowability. However, the higher milling speed (secondary level) had a greater impact on the FF value.
The wall friction test was particularly important in determining whether a specific container could be overall flow and funnel flow discharge. It was particularly important to understand the feeding behavior of the powder from the bin, the flow continuity in the delivery chute, and the injection force of tableting, and also conducive to investigate whether adhesion would occur between powders and the wall of equipment as well as other materials such as inner bags and capsules. The wall friction angle of granules after milling was determined (reported as WF) using a FT 4 powder rheometer. As shown in the half-normal plot (Fig. 10), the roller pressure, roller gap, and mill speed had no significant effect on the wall friction angle (WF value), the WF value of the granules made by each group was equivalent.
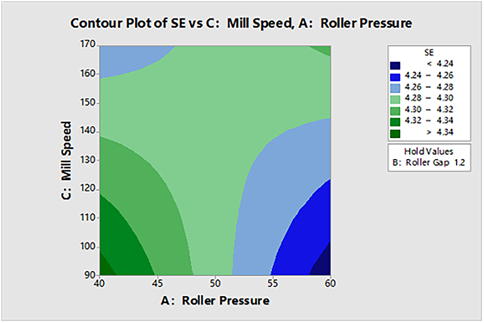
The stability and rheology assay of granules after milling were determined using a FT 4 powder rheometer and the particle stability index (expressed as SI values) as shown in the half-normal figure (Fig. 11). The roller pressure, roller gap, and mill speed had no significant effect on the particle stability index (SI). As a result, the SI value is 0.9–1.1, which meets the acceptable range. The specific flow energy (SE) quantifies the resistance to the relative movement of the granules in the unconstrained state, and irregular shapes and rough particles tend to bridge with each other to form temporary mechanical bridging. Higher SE values indicated a greater likelihood of forming a bridge within the bin. As shown in Fig. 12, the half-normal plot showed that the significant factors affecting the specific flow energy of the granules were the roller gap (B) and the interaction of the roller pressure and the mill speed (AC). As in Fig. 13, Fig. 14 and the contour plot presented in Fig. 15 showed the effect of roller pressure and mill speed on the SE value. The SE value increased obviously with the increase of pressure and milling speed (second level).
The above results showed that although the roller pressure had a significant impact on the density of granules after dry granulation, the granules flowability was not affected between particles prepared by different processes.
Comparison of Tablet Mechanical PropertiesIn this study, the tablet compression of granules from roller compacted and non-compacted powders, respectively. A fixed tablet weight of around 220 mg for all formulations was prepared using 8.0 mm round, biconvex tooling. And also, the granules were then mixed with 0.55% (w/w) magnesium stearate to examine the changes in tensile strength.
At 150 MPa tablet compression, the tensile strength of non-compacted powders was 2.61 MPa. Under the condition of the same compression force, the tensile strength of the granules from roller compacted decreased significantly. The maximum tensile strength of the granules obtained from 11 groups was 0.86 MPa and the minimum was 0.52 MPa (Table 7). The tensile strength of the granules decreased further after mixing magnesium stearate, with the maximum value of 0.55 MPa and the minimum value of 0.34 MPa.
The results showed that the tablet mechanical properties of non-compacted powders were significantly affected by dry granulation process and magnesium stearate. The loss of tabletability of powder after granulation was the most common defect of roller compaction (Fig. 16). The excipients used in this study were microcrystalline cellulose as plastic excipients, pre-gelled starch as plastic-elastic excipients and sodium carboxymethyl starch as elastic excipients.25) Therefore, the compression molding process of this formula material was greatly affected by magnesium stearate.26) It has been shown that tabletability was affected by bonding area and/or bonding strength.27) For plastic deformation materials, the main mechanisms affecting powder tabletability include lubrication, particle enlargement, and particle hardening. These factors were the main factors in the dry granulation process of this study.
Usually, the tensile strength of the tablets should be at 1.7–2 MPa,28) and the tabletability of the particles decreased significantly after the dry granulation, which also indicates that this formulation was more suitable for capsule dosage form than tablet dosage form. As a matter of fact, the dosage form of this product in the phase I clinical stage was a capsule. At the same time, because the lubricant not only affected the strength of the tablet, but also affected the disintegration and dissolution of the particles,29) appropriate lubrication should be conducted according to the characteristics of the material, and the amount of magnesium stearate should be optimized later. As magnesium stearate coats the particles, determination of the specific external surface area could be an approach to find the optimal lubricant amount to prevent adhesion and minimize the effect on the tensile strength.
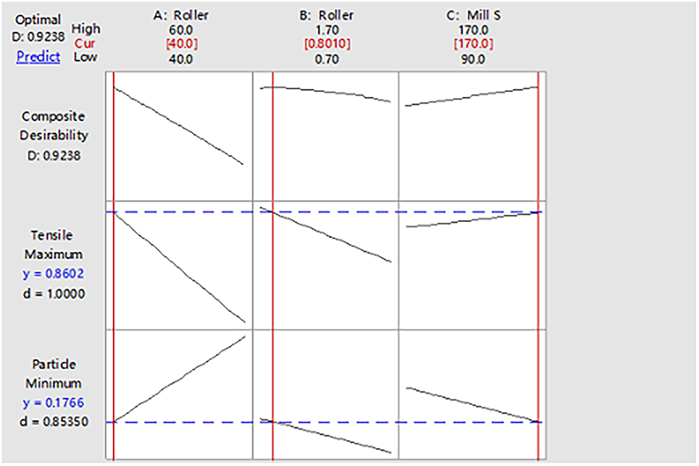
Process Confirmation of Formulation Containing APIAccording to the experimental results of the roller compaction and integrated milling DOE study without API, with the maximum tensile strength and minimum particle ratio were set as objectives (as we know, smaller particles were more useful to control content uniformity in the process of capsule filling), MiniTab17 software was used for statistical analysis of process parameters, and the results was shown in Fig. 17. The figure showed the curve of DOE response optimization results, and the red number corresponding to each factor was the optimal level of preliminary screening. Considered the optimization results, the particle properties in the effect diagrams in Figs. 5 and 13 and the material properties comprehensively, the roller pressure of 40 bar, roller gap of 0.7 mm and mill speed (second level) of 170 rpm were selected as the optimal process parameters.
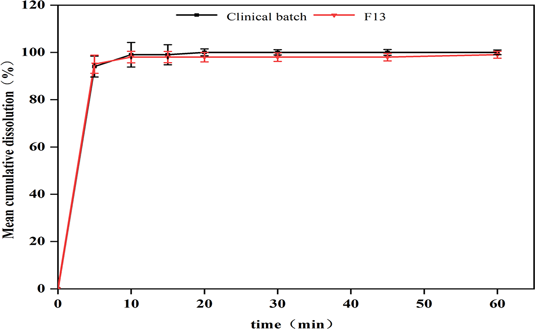
To verify the reliability of the dry granulation research strategy using blank formulation without API, the drug-containing formulation was further used for process validation. In the experiment, blank formulation without API (F12) and formulation with API component (F13) were used for confirmation study simultaneously. After dry granulation, results such as ribbon density, particle size distribution, bulk density and tapped density, and tabletability were detected and compared (Table 10). Then, capsules were filled with granules prepared by formulation F13. The content uniformity (Figs. 18, 19) and dissolution profiles (Figs. 20, 21) of the capsules were detected, and the results were compared with those of the product during phase I clinical study. It is confirmed that the quality of the granules prepared by using the process parameters obtained by software fitting was consistent with clinical products, and that the existing methods and strategies of commercial scale process development of dry granulation were applicable. The proportion of API in the formulation was 15.38% (w/w).
Table 10. Experimental Results for F12 and F13
| Acceptable ranges | F12 | F13 |
|---|
| Ribbon density (g/mL) | 1.2–1.5 | 1.30 | 1.49 |
| Particle ratio | / | 24.67 | 30.66 |
| Bulk density (g/mL) | 0.40–0.65 | 0.570 | 0.600 |
| Tapped density (g/mL) | 0.65–0.80 | 0.691 | 0.707 |
| FF | >4 | 16.0 | 10.4 |
| WF | / | 10.4 | 10.3 |
| SI | 0.9–1.1 | 1.00 | 0.944 |
| SE | min | 4.53 | 6.00 |
The results showed that the ribbon density, bulk density and tapped density of the granules prepared by F12 were basically similar to the experimental results of F1–F11 in DOE, but the granules tabletability of F12 was better, indicating that the loss of tabletability of the non-compacted powder under the condition with F12 parameter was less. The granules prepared by F13 had a higher ribbon density and particle ratio than those of F12, indicating that the API had a positive effect on the compactability of the non-compacted powder in the roll compaction. It could also be seen from the results in Table 11 that the tensile strength of F13 was superior to that of F12 under the same compression force. The FF value of F13 was greater than 10, indicating good flowability. The content uniformity of the prepared capsules was consistent with that of clinical products, and the dissolution profiles was also consistent. At the same time, the SE value of F13 was also observed to be slightly higher than F12, suggesting that it was necessary to pay attention to whether the material would be bridged in the bin after dry granulation when the optimized process parameters were used for subsequent commercial scale production.
Table 11. Results of Granules Tabletability after Roller Compaction
| Batch number | F12 | F13 |
|---|
| Granules after roller compacted (MPa) | 1.02 | 1.54 |
| Granules from roller compacted mixing magnesium stearate (MPa) | 0.88 | 1.22 |
Discussion
The important characteristics of the API, including particle size and mechanical properties, affect dry granulation processes.30) In this study, the particle size distribution of API was less than 40 µm. As we know, three common types of mechanical properties of materials were elastic deformation, plastic deformation, and brittle fracture, which mainly affect the compression characteristics of the powder.31) Therefore, we take the powder mixed with API and excipients as a whole, and then studies the intermediates prepared by different process parameters, such as ribbon thickness, porosity and particle size distribution of granules, so as to obtain better parameter properties.
As could be seen from the analysis of Tables 4 and 5, the roller pressure had a significant influence on particle ratio, bulk density, and tapped density of granules. The increase of roller pressure increased in particle ratio, bulk density, and tapped density. The selected roller pressure range had no significant effect on the ribbon density, granule flowability, wall friction angle, stability index, and specific flow energy. The results showed that with the increase of pressure, the bonding force between the materials could be increased, and the granulation of the strip could be improved,32) thus improving the powdering properties of the crushed particles and contributing to the binding of excipients.
The roller gap had a significant influence on the particle ratio and specific flow energy with the roller gap increasing the particle ratio and specific flow energy decreased. The results showed that as the roller gap increased, the pressure on the material decreased, and the binding force decreased, then the binding capacity of the excipients decreased, hence the particle ratio decreased and the granule flowability became worse. The milling speed (secondary level) also had a significant effect on the particle ratio. The milling speed had no significant effect on the other response values. As the milling speed increased, the material particle ratio gradually decreased. It was inferred that the faster the crushing speed, the more times the particles were crushed per unit time, and the particles were more likely to be crushed into finer particles, so the particle ratio increased.33)
Magnesium stearate had a significant effect on the tabletability of the granules prepared by this formulation. The addition of magnesium stearate increased the fluidity of particle filling, reduced the phenomenon of sticking in the process of tablet pressing, and made the tablet show better performance.
Through DOE and process parameters by prediction fitting, blank material formulation was used to confirm the process, the tensile strength was improved, and the particle ratio was basically in line with experimental expectations. The process parameters were confirmed by using the formulation containing API. The particle properties basically met the range of indicators in DOE, and the tensile strength of the tablet was significantly increased. The content uniformity of capsules filled with the prepared granules met the qualification specification and the capsules had same dissolution profiles compared with the products from phase I clinical study.
The design and development of solid dosage forms and galenical processes relied on the physicochemical and mechanical properties of active, excipient components and mixtures. There were some generalized procedures to evaluate material properties of API, excipients, and mixtures. The impact of a given material (API or excipient) was dependent on its concentration and function in the formulation and therefore needed to be studied in the context of its ability to affect the performance of a given formulation or process. The mechanical properties of powder included elastic deformation, plastic deformation and brittle fracture. FlowLac® 100 was composed of spherical particles of α-lactose monohydrate and amorphous lactose,34) which was a medium plastic material with brittle deformation characteristics. Starch 1500 was prepared by subjecting corn starch to physical compression or shear stress under high moisture conditions, causing temperature rise and gelatinization of part of the starch. The fluidity could be improved by the addition of colloidal silica. Density-stress (Heckel plots) and stress-relaxation studies showed that Starch 1500 exhibited extensive and slow plastic deformation during compression. The tableting properties of Starch 1500 could be improved by combining it with another filler binder such as microcrystalline cellulose.35) Microcrystalline cellulose was described in the NF as a purified, partially depolymerized cellulose prepared by treating a-cellulose. Its strong binding properties were caused by hydrogen bonds between hydrogen groups on the plastically deformed, adjacent cellulose particles.36) As an effect of their plastic behavior, celluloses were sensitive to mixing with lubricants,37) this was also reflected in our study.
Because of the processing development, particularly at manufacturing scale, required substantial costs with materials and experimentation. However, the current trend for manufacturing development was 'digital twin', which was a type of 'lab on chip' technology, by harnessing data analysis and modelling to explore the whole design space before actually doing experiments. The experiments in the 'digital twin' approach were only used for results verifications and validation. The API was expensive. The failure batches which were accounted for as 'cost of waste' were much more expensive. This approach was promoted by the FDA as a QbD application and employed by various international pharmaceutical companies. Hayashi et al.38) studied the relationship between the properties of directly pressed placebo tablets and those containing API, and the combination of placebo tablets and API tablets could predict the properties of pressurized tablets. However, this paper was just a case study. When using other APIs, some of the necessary validation needed to be done.
Conclusion
In this study, a method and strategy for the development of commercial scale drug product process of dry granulation in the early clinical stage of drug development, using a blank formulation without API components, which could greatly save research and development cost and resources. At the same time, it also reduced the risk of the possible API nature variability of candidates, batch to batch in the early clinical phase, and provided a robust process research method to achieve 'First time right'.
The study was based on a capsule dosage form, since the API was very expensive, it was high-cost to research in large commercial batches in the early clinical stage, because the candidates had not shown good therapeutic effects. However, often due to commercial competition, when the effectiveness and safety of candidates were proved, the commercialization process would be greatly accelerated, and the time for process development was extremely limited. Therefore, it was necessary to design and develop a development strategy that can be used in the early clinical stage of drug product development, which can effectively ensure the robustness of the subsequent commercial scale drug product process.
Funding
This project was funded by the National Natural Science Foundation of China (No. 81773968), and the Jiangsu Province Chinese Medicine Science and Technology Development Programme Project (MS2023178).
Conflict of Interest
The authors declare no conflict of interest.
References
- 1) Chambers J. D., Thorat T., Wilkinson C. L., Neumann P. J., Health Aff. (Millwood), 36, 1408–1415 (2017).
- 2) Yver A., Ann. Oncol., 27, 1165–1170 (2016).
- 3) “Novel Drug Approvals for 2022.”: ‹Novel Drug Approvals for 2022|FDA›, cited 9 February, 2023.
- 4) China: National Medical Products Administration. 2017. “China drug review annual report.”: ‹https://www.nmpa.gov.cn/›, cited 9 June, 2021.
- 5) China: National Medical Products Administration. 2018. “China drug review annual report.”: ‹https://www.nmpa.gov.cn/›, cited 9 June, 2021.
- 6) China: National Medical Products Administration. 2019. “China drug review annual report.”: ‹https://www.nmpa.gov.cn/›, cited 9 June, 2021.
- 7) China: National Medical Products Administration. 2020. “China drug review annual report.”: ‹https://www.nmpa.gov.cn/›, cited 9 June, 2021.
- 8) Wu Y. L., Zhang H., Yang Y., Drug Discov. Today, 20, 766–771 (2015).
- 9) Zhong Q., Tao Y., Chen H., Zhou Y., Huang L., Han X., Shi Y., Lancet Reg. Health West. Pac., 11, 100151 (2021).
- 10) Kalaria D. R., Parker K., Reynolds G. K., Laru J., Drug Discov. Today, 25, 505–518 (2020).
- 11) Kleinebudd P., Eur. J. Pharm. Biopharm., 58, 317–326 (2004).
- 12) Shi W., Sprockel O. L., Eur. J. Pharm. Biopharm., 106, 15–19 (2016).
- 13) Rowe J. M., Charlton S. T., McCann R. J., “Developing solid oral dosage forms (second edition),” Chap 32, ed. by Qiu Y., Chen Y., Zhang G. G. Z., Yu L., Mantri R. V., Academic Press, Boston, 2017, pp. 869–915.
- 14) Skelbæk-Pedersen A. L., Vilhelmsen T. K., Rantanen J., Kleinebudde P., Int. J. Pharm., 592, 120035 (2021).
- 15) Pérez Gago A., Reynolds G., Kleinebudde P., Powder Technol., 337, 92–103 (2018).
- 16) Liu Y., Wassgren C., Powder Technol., 297, 294–302 (2016).
- 17) Esnault V., Heitzmann D., Michrafy M., Oulahna D., Michrafy A., Chem. Eng. Sci., 104, 717–726 (2013).
- 18) Zheng Z. X., Appl. Mech. Mater., 159, 115–121 (2012).
- 19) Liu Y., Wassgren C., Powder Technol., 297, 294–302 (2016).
- 20) Kleinebudde P., J. Pharm. Sci., 111, 552–558 (2022).
- 21) Sheskey P. J., Hendren J., Pharm. Technol., 23, 90–106 (1999).
- 22) The United States Pharmacopieial Convention, USP32-NF27. Chap 616, Bulk and Tapped Density, 2012, pp. 226–231.
- 23) James W. B., Powder Metallurgy Methods and Applications [Z]. “Powder Metallurgy,” Vol. 7, ASM International, OH, U.S.A., 2015.
- 24) Li X. H., Zhao L. J., Ruan K. P., Feng Y., Xu D. S., Ruan K. F., Powder Technol., 247, 47–54 (2013).
- 25) Schulze D., Powder Technol., 62, 96 (1990).
- 26) Bolhuis G. K., Reichman G., Lerk C. F., Van Kamp H. V., Zuurman K., Drug Dev. Ind. Pharm., 11, 1657–1681 (1985).
- 27) Sun C. C., Kleinebudde P., Eur. J. Pharm. Biopharm., 106, 9–14 (2016).
- 28) Mosig J., Kleinebudde P., Powder Technol., 266, 156–166 (2014).
- 29) Sabri A. H., Hallam C. N., Baker N. A., Murphy D. S., Gabbott I. P., J. Drug Deliv. Sci. Technol., 46, 1–6 (2018).
- 30) Mangal S., Meiser F., Morton D., Larson L., Curr. Pharm. Des., 21, 5877–5889 (2015).
- 31) Govedarica B., Ilić I., Šibanc R., Dreu R., Srčič S., Powder Technol., 225, 43–51 (2012).
- 32) Nakamura S., Jinno M., Momoka Hamaoka M., Sakurada A., Sakamoto T., Chem. Pharm. Bull., 71, 887–896 (2023).
- 33) Kokubo H., Sunada H., Chem. Pharm. Bull., 44, 1546–1549 (1996).
- 34) Li X. H., Zhao L. J., Ruan K. P., Feng Y., Xu D. S., Ruan K. F., Powder Technol., 247, 47–54 (2013).
- 35) Manudhane K. S., Contractor A. M., Kim H. Y., Shangraw R. F., J. Pharm. Sci., 58, 616–620 (1969).
- 36) Reier G. E., Shangraw R. F., J. Pharm. Sci., 55, 510–514 (1966).
- 37) De Boer A. H., Bolhuis G. K., Lerk C. F., Powder Technol., 20, 75–82 (1978).
- 38) Hayashi Y., Tsuji T., Shirotori K., Oishi T., Kosugi A., Kumada S., Hirai D., Takayama K., Onuki Y., Int. J. Pharm., 532, 82–89 (2017).